Sive Morten
Special Consultant to the FPA
- Messages
- 18,648
Good morning,
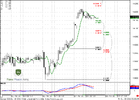
So, market has reached significant area of resistance that we’ve discussed during previous week, also this is daily level of overbought.
If you’re bullish – this is not the time to enter long, although momentum is strong and market has solid chances to continue move up. Bulls need some retracement to enter.
If you’re bearish – market shows bearish ”Stretch” pattern, that could lead to retracement down. Stretch is a combination of Fib resistance and overbought condition, that forces market to turn south in short-term. This pattern does not show precise target, since market could reverse right back at any time, when it will correct overbought. Theoretical target of this pattern is a middle between the bands of oscillator predictor – this is around 1.39 K-area on daily time frame.
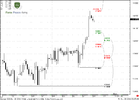
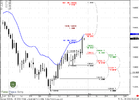
Still, I suppose that better to use as target K-area at hourly chart around 1.40-1.4050. Also you can see that hourly trend is bearish now.
But be careful with this pattern. This context is rather risky, since you have to trade against major trend and market momentum – all that you have is just some overload with purchases that, as you hope, should be adopted by the market during retracement. Probably it makes sense to reduce trading volume if you still want to take this “Stretch” context.
Video:
So, market has reached significant area of resistance that we’ve discussed during previous week, also this is daily level of overbought.
If you’re bullish – this is not the time to enter long, although momentum is strong and market has solid chances to continue move up. Bulls need some retracement to enter.
If you’re bearish – market shows bearish ”Stretch” pattern, that could lead to retracement down. Stretch is a combination of Fib resistance and overbought condition, that forces market to turn south in short-term. This pattern does not show precise target, since market could reverse right back at any time, when it will correct overbought. Theoretical target of this pattern is a middle between the bands of oscillator predictor – this is around 1.39 K-area on daily time frame.
Still, I suppose that better to use as target K-area at hourly chart around 1.40-1.4050. Also you can see that hourly trend is bearish now.
But be careful with this pattern. This context is rather risky, since you have to trade against major trend and market momentum – all that you have is just some overload with purchases that, as you hope, should be adopted by the market during retracement. Probably it makes sense to reduce trading volume if you still want to take this “Stretch” context.
Video:
Attachments
Last edited by a moderator: