4 hour Anchor

Status
Not open for further replies.
Bullish Butterfly on the 4hr chart PTZ @1.3882 and 1.3640
and Bullish Crab on the 1hrly price are in the PTZ (Potential turning Zone) 1hrly PTZ RR @ 1.3790 and 1.3633. Look for buy signal in this zone.
Prices currently @ 1.3745
50% retracement of the daily
 

Attachments

  • Daily_Trading_Planeurcad111110.doc
    73 KB · Views: 9
Last edited:
Daily Bearish look for the Pound looking for Rallies to Short
@ 1.5720 and 1.5735

Daily Bearish Looking for Euro/USd Rallies to Short.
1.3340 and 1.3316
 

Attachments

  • gbpusd.jpg
    gbpusd.jpg
    152.1 KB · Views: 9
  • eurusd.jpg
    eurusd.jpg
    173.9 KB · Views: 11
0.9920 Needs to be broken and held for a test of 1.0010 nearset target
Other wise we should be heading dwn to test support levels
0.38/0.9811
0.50/0.9761
0.62/0.9711
a break of these levels the Bye Bye!!!!!;-) 4hr Chart
Below possiable Bearish Gartley
Bearish Garley Forming if it does not stop at 100% or 127% Expansion
0.9943:)

So maybe look for Weakness Around that 0.9920/0.9935 to short tight stops else
If there's a clear break of these level then elwave count to 1.000 and 1050 will be in play
pls check out my Blog tell me what you think
Timeless Trading
Personal goal to like Sive!!!!:p
 

Attachments

  • USD-CHF4HRS081210.jpg
    USD-CHF4HRS081210.jpg
    155.7 KB · Views: 9
  • USDCHF4HRS081210.jpg
    USDCHF4HRS081210.jpg
    158.6 KB · Views: 7
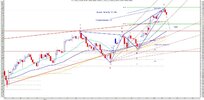
4hr Anchor Currency Map Building The Case

Timeless Trading

Hello, My name is Kasim and I am a Sniper Jar head Swing Trader.
I am imploying this method of trading to improve my Timing, patience and management of each trade.
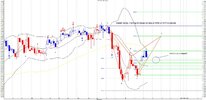
I am using the Daily but Mainly 240min Time Frame as an Anchor. As a Sniper we must be quietly patient. Therefore there may not be many signals as i look for intraday set up's that complement my
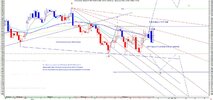
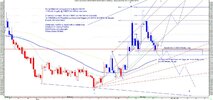
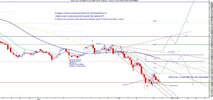
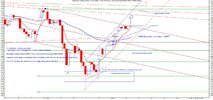
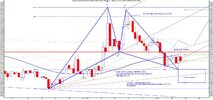
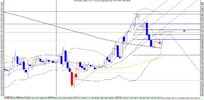
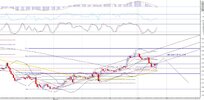
4hr outlook of the 6 Currencies ( GBPUSD, EURUSD,AUDUSD,USDCHF,USDJPY,USDCAD are all dollar based. Therefore, I will be analysing and monitoring the Dollar index and gold,oil for clues. The strategy is to build a case for each currency and try to spot the best Low risk High Probability Trades that I recognize.
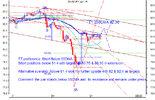
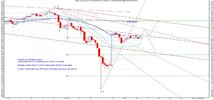
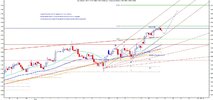
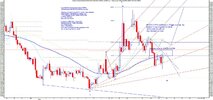
In each chart there is a 'Blue Print' of what I think might happen with alternative scenarios. Depending on whether Mr prices breaks or respects certain junctions I will act accordingly following Price behaviour with news.
In 90% of cases we are bullish above the 55DMA and bearish Below the 55DMA always going with the trend.Comments are welcome​
[/LEFT]

Arsenal of Skill
Harmoincs
Poseidon (Andrews Pitchfork)
Elliot wave
Speed Line. Trend line breaks
News to match Techincals outlook

Technique
DMA(Day Moving average )

Bollinger bands (21)
8DMA Cross Momentum
55DMA Bullish above Bearish Below
90DMA,200DMA Trend indicator
4hr Stochastics
MAC/D
RSI

I would just like to add this is my personal journal so that i may improve my Forex Military Rank. So comments welcome
You can also vist my blog to see charts at Timelesstrading.blogspot.com
but the signal shall be posted here
 
Last edited:

Attachments

  • AUDUSD240update18032011.jpg
    AUDUSD240update18032011.jpg
    161.3 KB · Views: 9
  • EURUSDupdate24018032011.jpg
    EURUSDupdate24018032011.jpg
    137.3 KB · Views: 11
  • GBPUSDUPDATE18032011.jpg
    GBPUSDUPDATE18032011.jpg
    156.7 KB · Views: 10
  • USDCAD24018032011.jpg
    USDCAD24018032011.jpg
    176 KB · Views: 9
  • USDCHF24018032011.jpg
    USDCHF24018032011.jpg
    135.5 KB · Views: 8
Last edited:
5 currency Update. Prediction have been very good since the last update. hope you were able to profit
so i've made ajustments accordingly to follow price on my prefrence 4 hour anchour time frame.
Not a lot of heavy news events coming out of the US this week
Treasury Secretary Geithner Speaks
House Price Index
Richmond Manufacturing Index

Focus is mainly on the Pound whcih recently presented some good numbers next
MPC Member Sentance Speaks
as Britain tackle inflationary pressure and the toss between Growth and the deficit lays in the fore front
Pls post commment or visit blog at Timelesstrading.blogspot.com
or twitter me on
Timeless77
pls Help me become a Master Trader i wont to earn my Rank strips
Thanks:D
 

Attachments

  • AUDUSD24022032011.jpg
    AUDUSD24022032011.jpg
    165.2 KB · Views: 5
  • GBPUSD4HR22032011.jpg
    GBPUSD4HR22032011.jpg
    258.6 KB · Views: 5
  • USDJPY24022032011.jpg
    USDJPY24022032011.jpg
    128.7 KB · Views: 4
  • EURUSD24022032011.jpg
    EURUSD24022032011.jpg
    126.2 KB · Views: 6
  • USDCAD24022032011.jpg
    USDCAD24022032011.jpg
    164.1 KB · Views: 5
Bearish Butterfly 161.8%

If wks out remember where you saw it 1st if it doesn't then remember where i learnt 1st Scott Carney
:)

Just Spotted
 

Attachments

  • EURUSDUPDATEBEARISGbUTTERFLY24022032011.jpg
    EURUSDUPDATEBEARISGbUTTERFLY24022032011.jpg
    152.7 KB · Views: 10
A-B Point that is less than 0.618 retracement, Preferably a 0.50 or 0.382 of XA leg defines the Bullish BAT Pattern The bullish 0.886 retracement is critical in the setup. Typically, bulllish BAt pattern are excellent 5-point corrective structures found in well established support level
might i add if it does get above 55DMA this pattern is very very powerful
Still we have well exstablish support Zone and price has stopped at the 113%secert fib line
very powerful too
I forgot to mention this pattern is very very powerful

would like to keep an ear out for stunning news supporting the US against the CAD very Soon!!!:eek:oh::D


pls post comments
 

Attachments

  • USDCAD Bullish BAT 240min22032011.jpg
    USDCAD Bullish BAT 240min22032011.jpg
    164.1 KB · Views: 10
cad News

For a second month in a row, Canadian consumers cut back on spending as headline retail sales for January slid 0.3% to a seasonally adjusted C$37.1 billion.

That follows a decline of 0.2% in December. Both figures undershot expectations, and January’s data surprisingly so. The consensus forecast had been for a 1.1% increase in retail sales.

If we take motor vehicles out of the equation, sales were flat for the month of January, after a 0.6% increase in December.

Therefore, where in December, the bulk of negative reading could be blamed on a big drop in car sales, this time overall core retail sales show that consumer spending has hit a rough patch.

For the official release, follow this link to the Canadian Statistics report.

The data is slightly dated, since it measures the first month of the 1st quarter and we are almost done with the quarter, but it can cause some consternation among economists that the Canadian economy may not be as strong as anticipated.

The Canadian Dollar weakened in the aftermath of the data.
 
Leading Indicator Cad News

The composite leading index rose 0.8% in February, double its gain in each of the previous three months and its largest advance since May 2010. The increase was broadly-based, with 9 of the 10 components posting gains in February compared with 5 rising the month before. A turnaround in manufacturing contributed to the overall increase in the index.


In manufacturing, new orders for durable goods rebounded 1.0%, after three straight declines. Some of this upturn reflects the marked improvement in exports in December. The ratio of shipments to inventories posted its first gain in five months. Manufacturers appeared optimistic that the improvement in demand was sustainable, as they extended the length of the workweek and substantially boosted employment levels over the last three months.

The stock market continued to lead all components with a 2.7% increase in February. The housing index was close behind with a 1.8% advance, mostly due to higher existing home sales. The improvement in housing was reflected in furniture and appliance sales, up 0.9% for their first gain in eight months. Spending on other durable goods rose 0.6%.;)
 
Status
Not open for further replies.
Back
Top