5 Forex Scams Used in EAs, Indicators and Signals - Repainting MT4 Indicators Scam
In this article, I will discuss the first common forex scam, namely repainting indicators. Before I delve into it, I will provide some background.
Understanding repainting and non-repainting indicators
Let’s start with the difference between repainting and non-repainting indicators:
- A repainting indicator keeps changing its values. It shows the new price ticks coming in from the markets. As the current market price changes, the indicator performs a recalculation, changing its values, and redrawing itself accordingly. The biggest issue with repainting indicators is that they change their values on previously closed bars.
- A non-repainting indicator does not change its values. It uses price bars to calculate its values. Once a price bar has closed, the indicator should not change its values on that bar again. Also, a non-repainting indicator does not change values on any bar if it was applied to “Open” price, or if it was created to use “Open” price to calculate its values. In other words, if an indicator uses the “Open” price to calculate its values, it should not repaint on any price bar.
It’s important to understand that all indicators repaint on the “Current” price bar if they are using any or all “Close,” “High,” and “Low” prices to calculate their values. They repaint themselves while the “Current” price bar is being formed, as long as it has not closed.
I will illustrate with some screenshots from the MetaTrader4 platform. I have used a special module called “Strategy Tester,” which allows you to simulate the trading of an indicator or Expert Advisor to see how it would have performed on a certain range of prices. For this demonstration, I have used data from September 1, and a period of 1 minute so that the data would come in faster.
In the image below, you can see a red and a green arrow, each one indicating the crossover points of the two “Moving Averages.” The first “Moving Average,” shown here as a red line, is applied to the “Close” price and has a period of 5. The second “Moving Average,” shown here as a yellow line, is also applied to the “Close” price and has a period of 6.
Each bar has its own “Close,” “Open,” “High,” and “Low” prices, which are based on the new price ticks coming in from the markets. At the end of the graph, you can see the “Current” price bar beginning to form. The red and yellow lines of the “Moving Averages” keep going up and down because they are being calculated based on the “Close” price of all previous price bars.
After the last price bar closes, the next one starts to form. Once the “Current” price bar has finished forming, its “Close,” “Open,” “High,” and “Low” prices never change. Also, the “Moving Averages” will not change on any of the closed price bars. Any indicator, which is based on price bars that have closed, should not change.
However, if the “Moving Average” is applied to “Open” price, it never changes, not even on the current price bar – this is shown on MetaTrader4 as the red line. As the simulation continues, the red line never changes; it remains static. The yellow line keeps changing, and that’s normal.
Please continue reading or watch Repainting MT4 Indicators Forex Scam Video #3
Repainting indicators are misleading
The next point that I want to make about repainting indicators is that they use the price bars on the right to calculate their values, and change their values and entry signals even on closed price bars. They mislead traders, causing them to incur unnecessary losses.
As you can see in the screenshot below, I ran a simulation using the special panel called “Trading on Chart,” and applied the “Moving Average Cross” indicator. This generates the arrows that I mentioned earlier when the lines of the “Moving Averages” cross. A red arrow indicates that a cross has occurred on the down side, signaling us to go “Short,” in other words, to place a “Sell” trade. A green arrow indicates that a cross has occurred on the up side, signaling us to go “Long,” to put in a “Buy” trade. 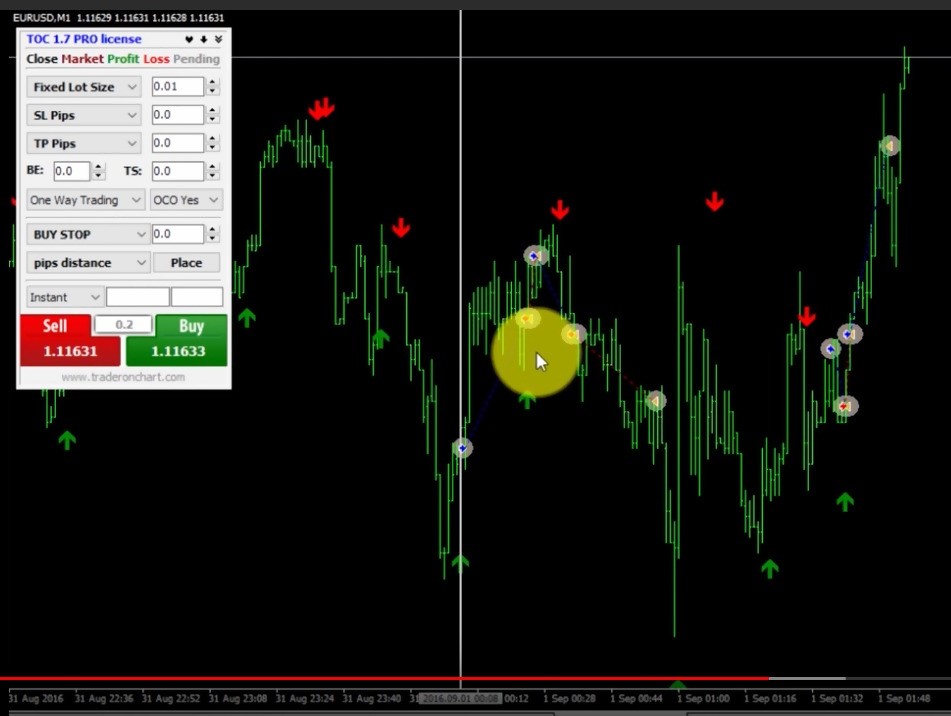
In the above picture, you can see a green arrow telling me to go “Long.” If I acted on that signal, I would click “Buy,” and wait until I saw an opposite signal – a red arrow. When the red arrow appeared, I would click “Sell” after the price bar closed. In other words, I would be closing my “Buy” trade and opening a “Sell” trade.
In theory, since the price bar had already closed, the “Short” signal that I saw should not go away. However, a few bars later, the “Sell” signal disappears because this indicator – which is actually a bad repainting indicator – determined that the “Sell” signal was false since a “Buy” signal was generated a few bars later. This means that the “Short” signal is no longer valid, but I did not know that when I acted on it.
What I am emphasizing is that some of these signals are false; they turn your trading into a disaster, causing unnecessary losses. When you are using repainting indicators, you never know which signal to take, since any one of them can turn out to be false.
Nevertheless, the entry signals look nice and neat on the history. They look so good because the indicator uses the price bars on the right to determine whether a signal is false or not. Basically, once enough new price bars have formed (unfortunately generating false signals in the process), the indicator makes a recalculation to verify the validity of those past signals. If it determines they were false, they disappear – that’s why you don’t see them on the history.
Needless to say, it’s a very bad decision to trade Forex using indicators like this one because you will be basing your trading on false signals.
Now, I will talk about another type indicator. In the picture below, the number 3 inside the yellow dot signals a new perfect “Low.” In theory, the “Low” should not move since the bar has closed. However, when a new “Low” starts to form, the number 3 keeps moving lower and lower, eventually showing another new perfect “Low.” If you had acted on the first perfect “Low,” you could have made a trading decision based on a false signal.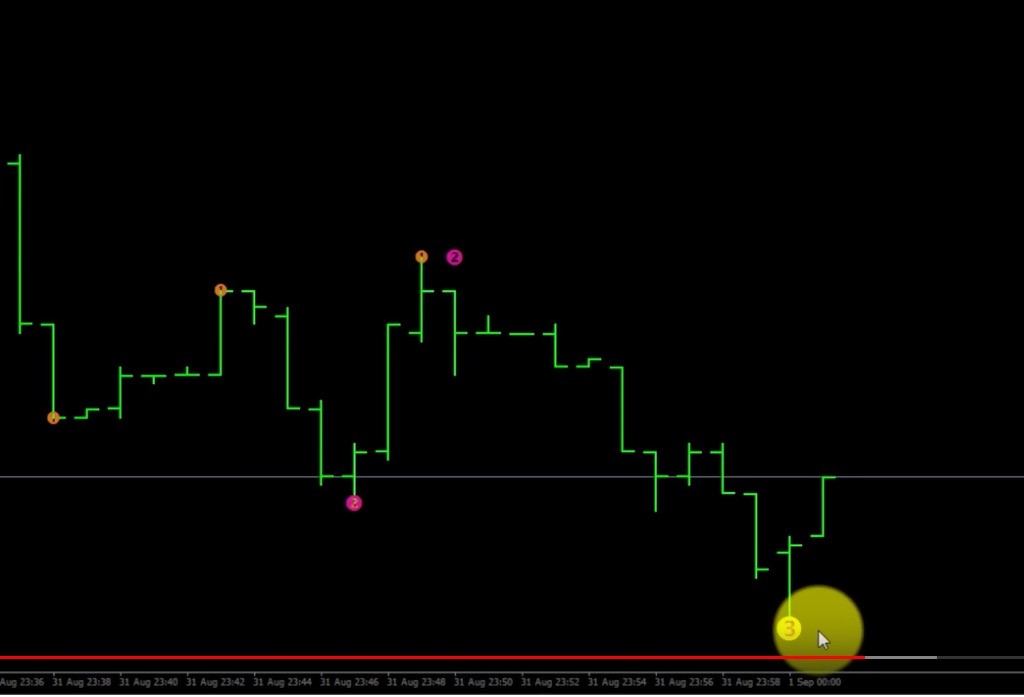
In addition, as the simulation continues, a new “High” forms causing the indicator to keep jumping from one bar to the next, redrawing itself to show the new “Highs” and “Lows.” This creates the impression that the indicator can detect the perfect “Highs” and “Lows,” misleading you to sell and buy. If you had entered a trade on these “High” or “Low” signals, there’s a good chance that – after you placed your trade – the indicator would no longer show what it was showing before.
These types of indicators are very bad, and you should avoid using them. Also keep in mind that, if the creator of an indicator does not mention that it’s a repainting indicator, it means that it’s a bad repainting indicator, and you are likely to be fooled. If an indicator generates entry signals that disappear after the price direction has changed, it means that it’s a bad repainting indicator because entry signals should not change or disappear.
Not all repainting indicators are bad
At this point, I want to make clear that not all repainting indicators are bad. Good repainting indicators, like Fractals or Zigzag, were not created to fool anyone.
In the screenshot below, you can see an example of a Fractal indicator. A Fractal indicator is formed when you have the highest bar in the middle, two lower bars on its left, and two on its right. Basically, it looks like an arrowhead.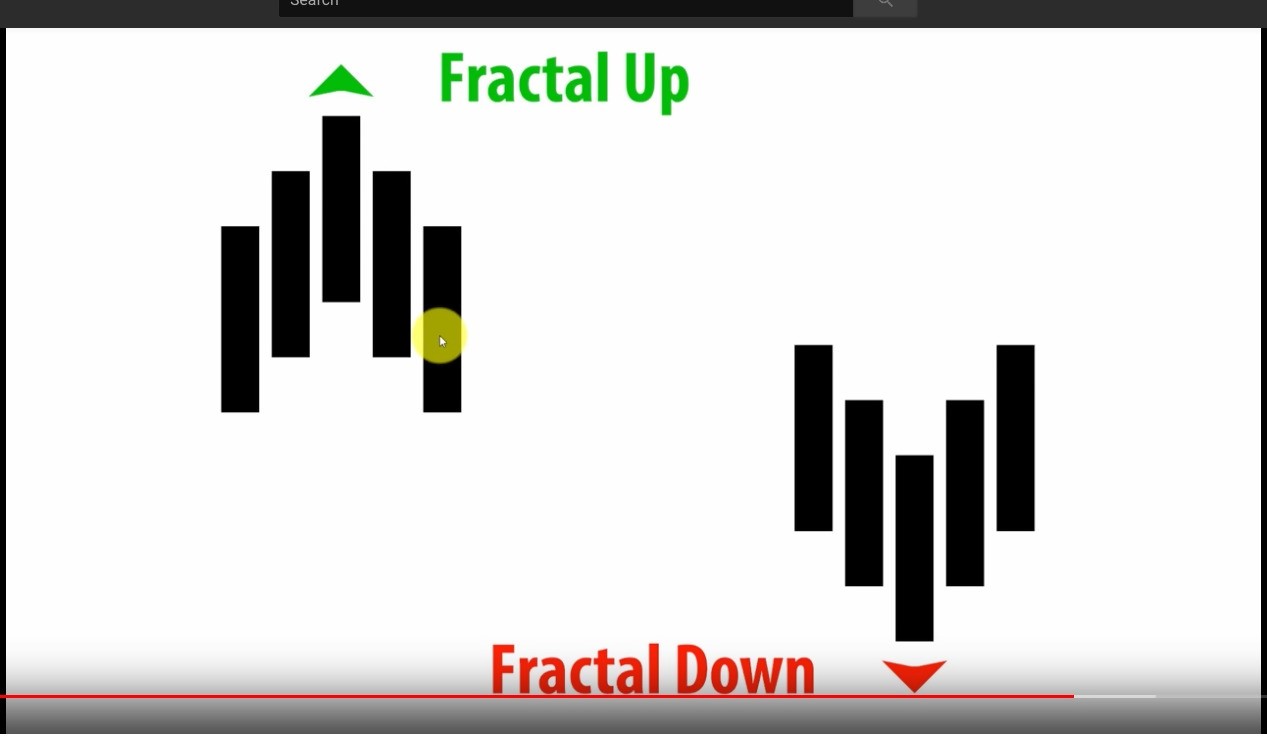
While the two bars on the right side are still forming (not fully-formed yet), either the Fractal Up or the Fractal Down symbol will appear on the chart. If the bars on the right side of the pattern go up, the arrow shape will be ruined, and the Fractal indicator will disappear. However, once this upward or downward pattern is fully-formed and closed, the Fractal will never disappear.
Once you know how Fractal indicators work and have learned to use them, they are actually good. Personally, we had a lot of success with them.
How bad repainting indicators fool traders
To summarize, there are three ways that bad repainting indicators mislead traders:
- Bad indicators show perfect entry signals on the history. But in real-time trading, false entry signals disappear after the indicator has determined that signal was false.
- Bad repainting indicators pretend that they can “predict” support and resistance levels, and show them as “Highs” and “Lows.” But they change them later if there has been a new “High” or “Low.”
- Bad repainting indicators always use “future” data to calculate their values, meaning the bars on the right of the entry signal.
How to know if an indicator is repainting
To verify that an indicator is repainting, you can run a backtest using the “Strategy Tester” module in MetaTrader4. You need to use a low timeframe so you can see the results faster – try a few until you find one that works. I typically use a one-minute timeframe to get the new bars coming quickly.
If you are not familiar with MetaTrader4’s interface, “Strategy Tester” can be accessed through the top menu under “View.” Go there, and select the indicator that you want to test, and the period – one minute, for example. If you want a very precise test, use “Every Tick” mode. If you want to run a quick test, use “Control Points” or “Open Prices.” Also, make sure to select the date range. I always select a date range of a few weeks so I won’t have to wait for ages for the data to be prepared. Always use “Visual Mode” to see the indicator on the chart. It also allows you to control the speed.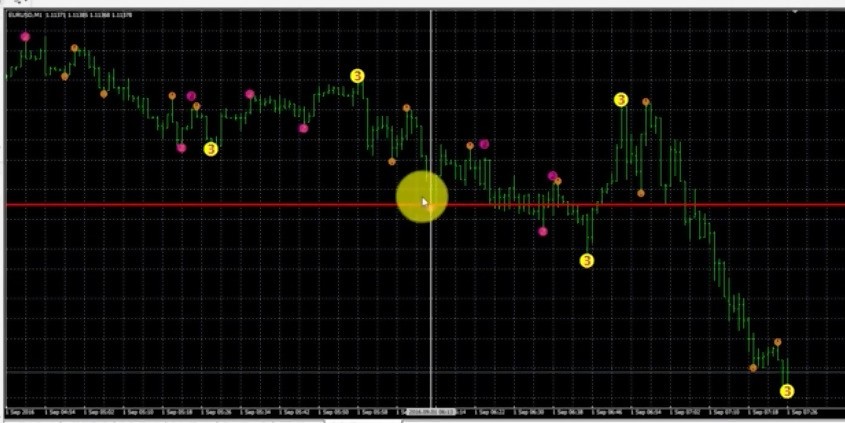
Once you have some data, you can plot vertical and horizontal lines to mark the position of the signal that you received, as shown in the above screenshot. Then resume the simulation, and check the positions of the signals later on. If you see that the number 3 has appeared and disappeared because a new “Low” was formed, this means that this is a repainting indicator. To make things easier, you can take screenshots and compare them using the actual chart.
To summarize:
- Go to MT4’s “Strategy Tester.”
- Run a backtest of the selected indicator.
- Use a low timeframe to see results faster.
- If it’s a non-repainting indicator, the values will remain unchanged after the price bar closes. If it’s a repainting indicator, the values will be replaced on already closed bars – if that’s the case, it’s bad.
That’s it! It’s easy to do a backtest to determine whether an indicator is repainting or not.
In closing
I hope that you’ve found this article helpful and that you’ll join me for the next one where I look at Forex Signal Services Scam
Editor's Note: The original video on this page was produced by Rimantas Petrauskas. The text version was prepared by the FPA. The text follows the primary concepts in the video, but has a number of differences in wording.Comments


Who doesn't? :-D
I have never tried this system myself, but if it repaints then it repaints :-)
Anything that repaints on closed bars cannot be reliable for entry or exit.
This is an excellent video for newbies and people alike. A point I would like to make is not the money people lose on spending the money on the indicator. It is the money they lose by applying these repainting indicators on their live trading account. So these videos as a must for anybody new to trading. Well done in taking the time to educate traders.
Kieran Dublin
This is an excellent video for newbies and people alike. A point I would like to make is not the money people lose on spending the money on the indicator. It is the money they lose by appl..
Thanks Kieran. You are right. It's sad to hear how much money people lose trading Forex by such repainting indicators.
Excelente explanation. Quite reachable!
Thanks!
Thanks!
Thanks. Glad you like it ;-)
I have found one that is good and doesn't repaint and I am sure there are good ones out there but bloody hell it is a minefield :(

As many lights as a christmas tree and 100 % winner trades
= 100% a repaint indicator 😅.
For beginners in fx-trading is that a very good video.