Weekly Market Brief - by Trade View Investments

Trade View Investments is an Algorithmic Proprietary Trading Firm based in Melbourne, Australia.
www.tradeview.com.au

WEEKLY MARKET BRIEF - 23rd August 2015


This market brief is an overview of the week ahead and some of the events we see as being important to the markets.

Please be aware that our views may change throughout the course of the week, and we do not publish updates of such changes.


For a more detailed day-to-day overview of the markets and trade opportunities you need to go to our LIVE CHAT ROOM.


We may take multiple trades throughout the week and discuss in our LIVE CHAT ROOM.

Trade View has entered the weekend Net Long.


FOREX


AUD.USD – 7312 ( - 61 or - 0.83% )


Another sideways move for the AUD. These are the time you cannot be complacent

As always BE PREPARED.


If we are to see a continuation of last weeks up move then 7407 needs to hold as a strong level of support. Once this occurs then 7494 could be see. If the momentum is strong then we could see 7635 which would complete the range.


If we see a quick reversal back down past 7407 and a downside move starts then we need to see an early long down bar reaching 7263 followed by 7116 which is now in line with levels back in early 2009.


EUR.USD – 11388 ( + 278 or + 2.50% )


After a slow start the EUR moved higher once again. The sell off in equity markets probably helped.


If the EUR continues this week as it did last, then we need to see a strong long up bar break and close past our FICM level of 11395. Once this occurs we could see 11471 reached. If the upward momentum is strong then the EUR could push towards 11666 very quickly.


If the EUR cannot get past 11395 early in the week and we see a leg back down then we would like to see tit break past 11315 before reaching 11166. Once this occurs then 11038 could be next to fall before reaching our downside FICM level of 10925.


GBP.USD – 15694 ( + 46 or + 0.29% )


The GBP is in a sideways move at the moment with a slight upside bias, but many of the levels discuss will be the same.


For the GBP to restart its run higher we would like to see 15644 hold as a strong level of support before before reaching our FICM level of 15744. If the upward momentum is strong then 15834 could be seen.


For the down move to continue we would like to see a strong break past 15591 before reaching 15549. Once this occurs then we could see our FICM level of 15458 reached very quickly where we could see some temporary support.


USD.JPY – 12205 ( - 225 or - 1.81% )


As the equity markets fell the USD also fell away with GOLD rallying. It is an Interesting time for the FED as it is caught between a rock and a hard place.

Raise rates - risk of complete market meltdown

Keep rates on hold - high possibility of (dare I say it) QE4?


For the USD to restart its move higher we would like to see our FICM level of 12151 hold as a strong level of support before push back above 12225. Once this occurs then 12275 could be seen on its way up before 12332 is reached. We would then need to see a long up bar break and close past 12332 if the USD has any chance of a continued move higher.


For this pair to continue lower we would like to see a strong break and close past 12151 before reaching 12064 and possibly the July 2015 low of 12041. If this occurs and the momentum is still strong then we will discuss further downside levels on our website.


COMMODITIES


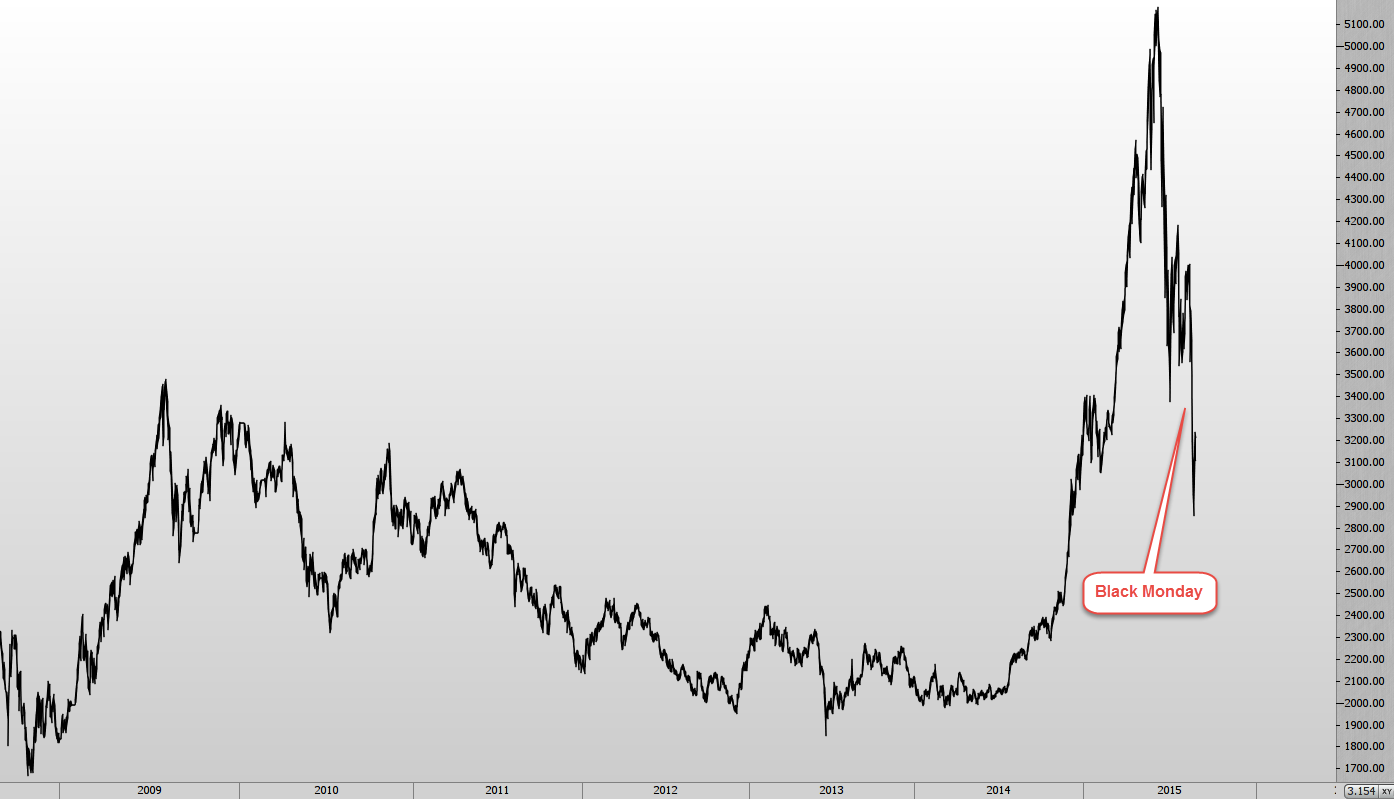
GOLD – 1160 ( + 46 or + 4.13% )


Who said GOLD was no longer a safe haven play?

“Gold is moving sideways at the moment. Be Prepared for the next strong move.”


For the upward move to continue we would like to see a strong push past 1167 before reaching 1177. 1177 will then need to be broken with a long up bar before completing the range at 1192. But if the equity markets pile off and traders buy GOLD then we could see a over extension towards 1216 and possibly 1226.


For GOLD to come back down, equities need to rally and 1149 needs to be broken leading down towards 1134. Once 1134 is broken then 1103 here we come.


AUSTRALASIA


ASX – 5099 ( - 257 or - 4.80% )


Another down leg by the ASX, this time very aggressive breaks reaching the Oct 2014 lows. The ASX is now 15.12% off from its highs.

CAUTION SHOULD BE OBSERVED AT THESE LEVELS.


For the upmove to restart we need to see a strong up bar break and close back above 5150 which will bring the ASX back inside the Standard Deviation Channel. Once this occurs we would like to see 5217 broken reaching 5270. If the upward momentum is strong then the area between 5312 - 18 needs to be broken with a long up bar before reaching 5367. Once this level is reached then we will discuss further levels on our website.


If the traders panic this week and the down move continues then a solid break past 5050 will see the ASX near 4976 and 4922 very quickly. If the downward momentum is strong then 4863 will be a spectator as the ASX fall to 5754. One thing to note is that if the ASX overextends this down move then 4599 might not be out of the question.


EUROPE


DAX – 10025 ( - 1023 or - 9.26% )


The DAX just collapsed, not much more to say.

The DAX is now 19.14% off from its highs.


If the DAX is to have any chance of reversing back up again we would then like to see a strong break and close above 10258 before reaching 10473. Once this occurs we could see 10684 reached before another strong push past 10793 and finally reaching 10868.


If the DAX is continues its aggressive down leg then a strong break through 10000 could see 9896 followed by 9829 finally reaching 9745 before taking its first breather. Once this level is reached and if the momentum continues strong then 9672 and 9589 might provide some resistance, if they don't then we could be in another FREE FALL scenario. If this occurs then we will discuss downside levels on our website.


US


S&P – 1972 ( - 122 or -5.83% )


Ping Pong over.

The S&P is now 7.68% off from its highs. The DOW is now 10.27% off from its highs.


For the upward move to restart we would like to see a strong long up bar break and close back above both 1981 and 2010. Once this occurs we could see a push back towards 2049.


If the S&P finds it hard to break back above 1981 and another downleg occurs we would see the area between 1957 - 47 broken early in the week followed by a strong push down towards 1927. If this level is also broken then we will discuss further downside levels on our website.


DISCLAIMER

The views represented on this website do not contain (and should not be construed as containing) financial advice, recommendations, opinions in relation to acquiring, holding or disposing of a financial product of any kind, or a record of our trading prices, or an offer of, or solicitation for, a transaction in any financial instrument. Trade View Investments accepts no responsibility for any use that may be made of these comments and for any consequences that result. No representation or warranty is given as to the accuracy or completeness of the above information. Consequently any person acting on it does so entirely at his or her own risk. The research does not have regard to the specific investment objectives, financial situation and needs of any specific person who may receive it. It has not been prepared in accordance with legal requirements designed to promote the independence of investment research and as such is considered to be a marketing communication.


TRADE VIEW MAY CHANGE THE VIEW PRESENTED AT ANY TIME AND WILL NOT PUBLISH ANY UPDATE TO THAT EFFECT.


This communication must not be reproduced or further distributed.
 
Trade View Investments is an Algorithmic Proprietary Trading Firm based in Melbourne, Australia.
www.tradeview.com.au

WEEKLY MARKET BRIEF - 31st August 2015


This market brief is an overview of the week ahead and some of the events we see as being important to the markets.

Please be aware that our views may change throughout the course of the week, and we do not publish updates of such changes.


We may take multiple trades throughout the week and discuss in our LIVE CHAT ROOM.

Trade View has entered the weekend Net Long.


AUSTRALASIA


ASX – 5274 ( + 175 or + 3.43% )


The ASX rebounded strongly last week after an initial very heavy downside move which would have shaken out a lot of longs. It looks like the markets are getting a little volatile for some.


For the upmove to continue after last weeks strong comeback we would like to see 5319 broken early in the week followed by a strong long up bar through 5366. Once this occurs then we could see the ASX back up near the area between 5441 - 62 which also completes the range set back in June 2015.


If the ASX cannot hold onto last weeks move and struggles to move higher we would like to see a strong downside break reaching 5150 before pushing down towards 5095. If we see further panic selling then the move towards 5050 will be quick and has the potential to reach 4976 and 4922 very quickly.


EUROPE


DAX – 10302 ( + 277 or + 2.76% )


The DAX was also not immune to the heavy downside moves last week followed by a strong rebound. It is obvious that the markets are getting a little edgy with all that is going on around the world.


If the DAX continues its strong run from last week then we need to see a strong break past 10473 early in the week reaching 10684. Then we need to see a strong momentum break and close through both 10793 and 10868. If this occurs then we will discuss further upside levels on our website.


If the DAX restarts lower then we will be looking for a break below 10258 before reaching 10146. Once this occurs we would like to see continued downside pressure breaking through both 10075 and 100035. This could then lead the DAX back down to 9896 followed by 9829 finally reaching 9745 before finding temporary support. If this level is broken with strong momentum then we will discuss downside levels on our website.


US


S&P – 1988 ( + 16 or + 0.81% )


Ping Pong over or is it? Heavy falls followed by sharp reversal. I’m sure this market has tested everyone.


For the upward move to continue on from last week we would like to see a strong long up bar break through 2010 before reaching 2024. Once this occurs we would like to see the all important area between 2040 - 46 broken with strong momentum.


If the S&P finds it hard to stay above 1981 and another downleg occurs we would see the area between 1957 - 47 broken early in the week followed by a strong push down towards 1927. If this level is also broken then we will discuss further downside levels on our website.


FOREX


AUD.USD – 7169 ( - 143 or - 1.96% )


“Always BE PREPARED.”

The ASX has showed us why we should be prepared for breaks either side.


If the AUD has any chance of a move higher then we would like to see a strong break back above 7262 early in the week before bouncing back towards 7407.


If we see a continued move lower then a strong break and close past 7116 could see the AUD reach 6957 quickly. If the downside momentum is strong then expect 6809 and 6761.


EUR.USD – 11180 ( - 208 or - 1.83% )


After a massive rally on Monday the EUR just collapsed moving over 550+ points for the week from high to low.


If the EUR regains its composure and tries to rally again then we need to 11166 hold as a strong level of support before an early break back above 11315 is achieved. Once this occurs we need to a strong long up bnar break and close past 11395 before reaching 11471. Dare I say it that we could see the EUR back near 11666 for a complete reversal?


If the EUR breaks down past 11166 early in the week we could see 11038 quickly. A break through 11038 could see our downside FICM level of 10925.


GBP.USD – 15390 ( - 294 or - 1.87% )


The GBP suffered a similar fate to the EUR as it moved higher early and then down she goes like a sack of potatoes. Not much more to say.


For the GBP to restart its run higher we would like to see 15458 broken early in the week with a long up bar. Once this occurs then we could see 15533. We would then like to see a long up bar break and close through 15533 before further up moves towards 15549, 15591 and 15644 are seen. If this occurs then we will discuss further upside levels on our website.


For the down move to continue we would like to see a strong break and close past 15366 before reaching 15280. If the downside momentum is strong then a break past 15250 could see 15140 which would complete the downside range set in March 2015.


USD.JPY – 12174 ( - 31 or - 0.25% )


With the USD falling over 400 points in one day we will say it again.

“It is an Interesting time for the FED as it is caught between a rock and a hard place”

Raise rates - risk of complete market meltdown

Keep rates on hold - high possibility of (dare I say it) QE4?

As the rebound was strong and the pair closed on 31 points lower our comments from last week remain the same.


For the USD to restart its move higher we would like to see our FICM level of 12151 hold as a strong level of support before push back above 12225. Once this occurs then 12275 could be seen on its way up before 12332 is reached. We would then need to see a long up bar break and close past 12332 if the USD has any chance of a continued move higher.


For this pair to continue lower we would like to see a strong break and close past 12151 before reaching 12064 and possibly the July 2015 low of 12041. If this occurs and the momentum is still strong then we will discuss further downside levels on our website.


COMMODITIES


GOLD – 1133 ( - 27 or - 2.33% )


I think last week confused the GOLD bugs. It looks like we need a market meltdown for GOLD to rally. (Safe haven Play)


For GOLD to move higher again we would like to see a strong break early past 1134 before reaching 1149 again. Once this occurs then the area between 1161 - 67 will play a major role is allowing a push high towards 1178.


For GOLD to continue back down, 1134 needs to hold as strong resistance before a strong move down towards 1103 occurs. This could then lead to 1091 and possibly 1069.


DISCLAIMER

The views represented on this website do not contain (and should not be construed as containing) financial advice, recommendations, opinions in relation to acquiring, holding or disposing of a financial product of any kind, or a record of our trading prices, or an offer of, or solicitation for, a transaction in any financial instrument. Trade View Investments accepts no responsibility for any use that may be made of these comments and for any consequences that result. No representation or warranty is given as to the accuracy or completeness of the above information. Consequently any person acting on it does so entirely at his or her own risk. The research does not have regard to the specific investment objectives, financial situation and needs of any specific person who may receive it. It has not been prepared in accordance with legal requirements designed to promote the independence of investment research and as such is considered to be a marketing communication.


TRADE VIEW MAY CHANGE THE VIEW PRESENTED AT ANY TIME AND WILL NOT PUBLISH ANY UPDATE TO THAT EFFECT.


This communication must not be reproduced or further distributed.
 
Trade View Investments is an Algorithmic Proprietary Trading Firm based in Melbourne, Australia.
www.tradeview.com.au


China, The New World Order

Trade View
CHINAvUSA_small-e1441164437491.jpg

The past fortnight shows us that markets are interconnected now more than ever. The extreme volatility we saw across most asset classes culminated in a huge sell-off on Monday 24thAugust, which undoubtedly tested many traders. To understand why this ‘Black Monday’ event occurred, we will provide a sneak peak into China and demonstrate the real impact China has on the rest of the world.

What is happening?

Since June, the Chinese stock market has fallen more than 40%. We’ve seen the Chinese government step in and try and stabilise the stock market, to what success remains to be seen. With this extreme government intervention in both the Chinese stock market and the currency (Yuan), global markets have shown that they are watching developments coming from the world’s second largest economy and have some concerns.


Chart 1: Daily chart of Shanghai Composite (SSE)


Is China a free-market economy for everyone?

When we look at the actions of China’s Central Bank (PBOC) over the past 12 months, the PBOC has been slowly cutting rates of the Yuan and in recent months this has accelerated. We have seen this type of policy initiative from other central banks and is a tell-tale sign that perhaps the economy is slowing down. By cutting rates, the central bank is trying to stimulate the economy through increased lending and activity creating growth.

Adding to this the Chinese government has heavily promoted investment in the stock markets for a sustained period of time. With this recent crisis, they have also provided additional finance measures to state companies, helping them purchase shares in an attempt to contain their spiralling out-of-control market.

What does this all mean? They don’t want the market to go down.

But as in the past, unless a market is allowed to operate free from major government intervention (manipulation), it may not revert to levels that reflect true values.

As such we may continue to see wild volatility and/or similar events in the future.

Does the Chinese government inspire confidence?

Historically governments have been late to the party in trying to prevent a meltdown or crash. However the real questions traders must think about are:

  • Do participants trust that the government can get a grip on what is really happening?
  • Is the government ready for a new era of capitalism (state capitalism)?
  • Are they prepared for the mass migration from rural to urban areas and changes to the middle class?
And finally, does this government and the central bank have processes in place to deal with extreme stock market volatility?

Again as traders, preservation of capital is of most importance. We should always ensure our risk and exposure (which should account for unforeseen events or government intervention) is appropriately managed.

Which leads us to the topic of transparency.

What about Economic Data and Trade?

From a data standpoint, the biggest issue with China has always been one of transparency, governance and potential corruption. Many traders are ill-informed on the data that comes out of China and whether it is trustworthy or not. It’s widely believed corporate governance is improving, but transparency still has a long way to go to reach standards of other major economies.

It’s also widely known that whilst China owns a lot of US debt, it’s national private and state debt currently totals > 200% of the country’s GDP (debt-GDP ratio, source: Bloomberg). By comparison, the US is half of this, Germany at ~75% and Australia less than 30%. These high levels of debt-GDP ratio are concerning as historically they show signs of a highly leveraged market, where further debts may be incurred.

Another consideration worth mentioning is much of this debt is served internally. The Chinese government has not fully opened it’s doors to foreign investment, preventing international investors and institutions from access to their local markets. It has been reported that foreign investors make up less than 2% of the local Chinese markets.

What does this mean for the rest of the world?

China accounts for ~20% of the world’s population. Comparatively speaking, this is almost twice that of the European Union and the United States combined. Historically China has always been known for it’s cheap (both value and quality) exports; but today it is a major importer as the country fuels its expanding economy and massive population. A prolonged recession in China may result in more uncertainty in global markets particularly for companies/countries that rely heavily on Chinese exports and those importing their goods into China.

For the time being the media is proposing the Chinese are doing everything they can to stay on top of these markets. But what if they are not? What if China is indeed in a serious Credit bubble and we begin to see mass currency outflows, a more aggressive FED, and deflated Yuan? What then?

The Chinese Yuan

It’s no secret countries around the world are trying to use their currencies to gain an economic and/or strategic advantage. The recent devaluation of the Yuan by China’s central bank is a perfect example. These announcements create fundamental shifts in trends that all traders should be aware of, as their impact tends to follow through in the longer term.

The second point worth mentioning is when (if) the Yuan becomes fully convertible. This is a process known as currency internationalisation, where the currency becomes floated as a reserve currency. It may then compete with the US Dollar in pricing and trading of products traded around the world (such as the commodities).

Do you really think the Chinese will pay Russia in USD for OIL in the future? Something tells me, I don’t think so.

Conclusion:

As you can now see, China has a huge influence on world markets. Any turbulence in their markets will send shockwaves throughout the world.

We know that China is forging a new space in capital markets. At present Chinese authorities are imposing strict policies to ‘hold the market up’. If they fail the consequences could be much bigger than anticipated and the chances of a larger scale crisis, particularly in Asia increase dramatically.

If however they can regulate their markets, inspire confidence in the system, and stabilize volatile environments they will become a leading market for the rest of the world to follow. This in turn creates a bullish tone.

In 2009 it was ‘Don’t fight the FED’.

In 2015 and beyond we might be saying “Don’t fight the PBOC”.

And as traders we may also find ourselves waking up every morning and asking what is China doing today?

If this article has you thinking, come and see what our professional prop traders think as they call the market as the action unfolds on our website.

If you enjoyed this article or have any questions, please leave us a comment below and don’t forget to follow us on social media for up-to-date posts.
 
Trade View Investments is an Algorithmic Proprietary Trading Firm based in Melbourne, Australia.
www.tradeview.com.au

WEEKLY MARKET BRIEF - 07th September 2015


This market brief is an overview of the week ahead and some of the events we see as being important to the markets.

Please be aware that our views may change throughout the course of the week, and we do not publish updates of such changes.


For a more detailed day-to-day overview of the markets and trade opportunities you need to go to our LIVE CHAT ROOM.


We may take multiple trades throughout the week and discuss in our LIVE CHAT ROOM.

Trade View has entered the weekend Net Long.


FOREX


AUD.USD – 6908 ( - 261 or - 3.64% )


Continued downside break for the AUD, this could get really ugly if the downside continues.


If the AUD has any chance of a move higher then we would like to see a strong break back above 6953 early in the week before bouncing back towards 7116. If the upward momentum is strong then 7263 won't be far away.


If the AUD continues lower we would like to see 6953 become a solid level of resistance before an attempt is made at breaking through both 6809 and 6761. Once this break occurs then 6572 could be seen with a possible extension towards 6460.


EUR.USD – 11145 ( - 35 or - 0.31% )


Some sideways movement for the EUR at the moment. As mentioned in the DAX post let’s see if Mario Draghi can say/do something to make the pair move.

As the EURO has not moved much, our comments from last week remain the same.


If the EUR regains its composure and tries to rally again then we need to 11166 hold as a strong level of support before an early break back above 11315 is achieved. Once this occurs we need to a strong long up bar break and close past 11395 before reaching 11471. Dare I say it that we could see the EUR back near 11666 for a complete reversal?


If the EUR breaks down past 11166 early in the week we could see 11038 quickly. A break through 11038 could see our downside FICM level of 10925.


GBP.USD – 15167 ( - 223 or - 1.45% )


While the EUR moved sideways, the GBP continued lower and did not look like it was going to recover at all. The one thing to note is that we are at the lows of MAY 2015 which completes the downside range


For the GBP to restart its run higher we would like to see 15248 broken early in the week with a long up bar. Once this occurs then we could see 15364 followed by 15456.


For the down move to take another leg down then we would like to see a long down bar break and close past 15139. If this occurs then we see 14950 as being the next level reached before settling near 14832.


USD.JPY – 11903 ( - 271 or - 2.23% )


“It is an Interesting time for the FED as it is caught between a rock and a hard place”

Raise rates - risk of complete market meltdown

Keep rates on hold - high possibility of (dare I say it) QE4?

Listen to and Watch the Markets, not the media.


For the USD to restart its move higher we would like to see strong support at 11867 before moving past 11924. Once this occurs then a push back up towards 12011 could be seen. If the upward momentum continues strong then 12064 could provide a nice level for the USD to rally towards 12151.


For this pair to continue lower we would like to see a strong break and close past 11867. This could then lead to another FREEFALL down towards 11679. Once this occurs we could then test the lows of 11612. If these are broken then we will discuss further downside levels on our website.


COMMODITIES


GOLD – 1121 ( - 12 or - 1.06% )


“It looks like we need a market meltdown for GOLD to rally. (Safe haven Play)”

As GOLD has not moved much, our comments from last week remain the same.


For GOLD to move higher again we would like to see a strong break early past 1134 before reaching 1149 again. Once this occurs then the area between 1161 - 67 will play a major role is allowing a push high towards 1178.


For GOLD to continue back down, 1134 needs to hold as strong resistance before a strong move down towards 1103 occurs. This could then lead to 1091 and possibly 1069.


AUSTRALASIA


ASX – 5008 ( - 266 or - 5.04% )


The ASX struggled to move higher last week as continued pressure came from around the world on many fronts including weak Chinese data.


For the upmove to restart then we would like to see an early break back above 505 and 5095 before a long up bar break and close past 5150 occurs. If the momentum continues strong then we could see 5217 reached. If the markets have overextended themselves to the downside then 5270 and 5319 are not out of the question.


If the ASX breaks down through 5000 early in the week then the downward process could reach 4922 very quickly. Once this level is broken the 4863 could be seen just as fast. If the downward momentum is strong then the lows of AUG and 4754 will play a pivotal role in deciding the next direction of the ASX. If this level is broken with strong momentum then we will discuss downside levels on our website.


EUROPE


DAX – 10026 ( - 276 or - 2.68% )


Even though the DAX was down by 200+ points for the week, it is more of a sideways move than anything else. Even Mario Draghi cannot help these markets at the moment with his increased readiness to stimulate Europe's sluggish economy further.

http://www.bloombergview.com/articles/2015-09-04/europe-s-economy-needs-action-not-words


For the upmove to restart the DAX needs to see a strong break and close above 10258 before reaching 10473. Once this occurs we could see 10684 reached before another strong push past 10793 and finally reaching 10868.


If the DAX is continues down through 10000 then we could see 9896 followed by 9829 finally reaching 9745 before taking its first breather. Once this level is reached and if the momentum continues strong then 9672 and 9589 might provide some resistance, if they don't then we could be in another FREE FALL scenario. If this occurs then we will discuss downside levels on our website.


US


S&P – 1923 ( - 65 or - 3.27% )


The S&P is not happy, Bad Job Number, Bad Data, possible Interest rate hike. Bad News.

If you think you can’t sleep, image how poor Janet Yellen Feels.


For the upward move to restart we would like to see 1901 hold as a strong level of support before pushing back past 1927 and towards the 1947 - 57 area. Once this occurs we would need to see a long up bar break through towards the area between 1981 - 90. If the momentum is strong then 2010 here we come.


If the S&P fails to break above 1927 then a break down past 1901 could see 1882 quickly followed by 1869, 1857 and finally a test of the AUG 2015 low of 1834. If 1834 is also broken then we will discuss further downside levels on our website.


DISCLAIMER

The views represented on this website do not contain (and should not be construed as containing) financial advice, recommendations, opinions in relation to acquiring, holding or disposing of a financial product of any kind, or a record of our trading prices, or an offer of, or solicitation for, a transaction in any financial instrument. Trade View Investments accepts no responsibility for any use that may be made of these comments and for any consequences that result. No representation or warranty is given as to the accuracy or completeness of the above information. Consequently any person acting on it does so entirely at his or her own risk. The research does not have regard to the specific investment objectives, financial situation and needs of any specific person who may receive it. It has not been prepared in accordance with legal requirements designed to promote the independence of investment research and as such is considered to be a marketing communication.


TRADE VIEW MAY CHANGE THE VIEW PRESENTED AT ANY TIME AND WILL NOT PUBLISH ANY UPDATE TO THAT EFFECT.


This communication must not be reproduced or further distributed.
 
Trade View Investments is an Algorithmic Proprietary Trading Firm based in Melbourne, Australia.

www.tradeview.com.au

WEEKLY MARKET BRIEF - 14th September 2015


This market brief is an overview of the week ahead and some of the events we see as being important to the markets.

Please be aware that our views may change throughout the course of the week, and we do not publish updates of such changes.

We may take multiple trades throughout the week and discuss in our LIVE CHAT ROOM.

Trade View has entered the weekend Net Long.


FOREX


Great Article for all to read re FED decision this week.

http://www.bloomberg.com/news/artic...fed-won-t-raise-rates-next-week-deutsche-bank


AUD.USD – 7090 ( + 182 or + 2.63% )


No downside last week. The AUD just powered ahead as the possibility of no FED hike rumours start.


If the AUD is to continue its move higher then we would like to see 7116 broken early in the week. If the upward momentum is strong then 7263 won't be far away. And could we see 7407?


If the AUD continues lower we would like to see 6953 become a solid level of resistance before an attempt is made at breaking through both 6809 and 6761. Once this break occurs then 6572 could be seen with a possible extension towards 6460.


EUR.USD – 11335 ( + 190 or + 1.70% )


psst - To Mario Draghi, If you want the Euro to go down you need to act.


If the EUR continues its strength this week then we would like to see a strong long up bar break and close past 11395 before reaching 11427 and 11471. If the upward momentum is strong then 11666 and 11732 are not out of the question.


For the downward move to really kick into play then we would like to see a strong break and close past 11166 early in the week before reaching 11038 quickly. A break through 11038 could see our downside FICM level of 10925.


GBP.USD – 15427 ( + 260 or + 1.71% )


The GBP followed the rest of the majors moving higher against the USD. As the FED is making a decision this week you will need to be prepared either way.


For the GBP to continue it move higher we would like to see another strong long upbar break past 15456 again reaching 15533. Once this occurs we would like to see continued strong moves past 15549, 15591 and 15644 before reaching the area between 15719 - 45.


For the down move to restart and take another leg down then we would like to see 15446 hold as a strong level of resistance before another attempt at breaking past 15366 is made on its way down towards 15280. If the momentum is strong then we would like to see a long down bar break and close past 15250. If 15250 is also broken then we will discuss further downside levels on our website.


USD.JPY – 12058 ( + 155 or + 1.30% )


“It is an Interesting time for the FED as it is caught between a rock and a hard place”

Raise rates - risk of complete market meltdown

Keep rates on hold - high possibility of (dare I say it) QE4?

Listen to and Watch the Markets, not the media.


We have 2 key levels to the upside and they are 12064 (3 days in a row this pair closed near it) and 12151.


For the USD to restart its move higher we would like to see strong support at 11867 before moving past 11924. Once this occurs then a push back up towards 12011 could be seen. If the upward momentum continues strong then 12064 could provide a nice level for the USD to rally towards 12151.


For this pair to continue lower we would like to see 12064 continue to be a strong level of resistance before a leg lower occurs past 12011. This could then lead to 11977 and back down to 11926 before reaching 11867 and then making its final decision.


Either way we will be discussing possible moves around the FED decision throughout the week on our website.


AUSTRALASIA


ASX – 5093 ( + 85 or + 1.70% )


The ASX moved higher early in the week but then struggled as soon as it touched above 5200. It is a challenging time for the ASX at the moment with pressure coming in the form of its biggest trading partner, China.


For the upmove to restart we would like to see 5050 hold as a strong level of support before another attempt at breaking and closing past 5150 occurs. If the momentum continues strong then we could see 5217 reached. Once this occurs and we see a strong move then 5270 and 5319 are not out of the question.


If the ASX breaks down through 5050 again early in the week then the downward process could reach 4976 and 4922 very quickly. Once this level is broken the 4863 could be seen just as fast. If the downward momentum is strong then the lows of AUG and 4754 will play a pivotal role in deciding the next direction of the ASX. If this level is broken with strong momentum then we will discuss downside levels on our website.


EUROPE


DAX – 10189 ( + 163 or + 1.63% )


The DAX also tried to move higher early the week but came back down to close up for the week by over 150 points. This is a sideways move for the DAX so our comments remain the same.


For the upmove to restart the DAX needs to see a strong break and close above 10258 before reaching 10473. Once this occurs we could see 10684 reached before another strong push past 10793 and finally reaching 10868.


If the DAX is continues down through 10000 then we could see 9896 followed by 9829 finally reaching 9745 before taking its first breather. Once this level is reached and if the momentum continues strong then 9672 and 9589 might provide some resistance, if they don't then we could be in another FREE FALL scenario. If this occurs then we will discuss downside levels on our website.


US


S&P – 1962 ( + 39 or + 2.03% )


The S&P is trying really hard to move higher but there are many pressures coming from all over. If the S&P is to move higher it needs to do it soon, otherwise we could see further uncertainty which could lead to further downside pressure.


For the upward move to restart we would like to see the area between 1947 - 57 hold as a strong level of support before pushing back past the area between 1981 - 90. If the momentum is strong then 2010 here we come. If the S&P overextends then 2046 will be the next pivotal level to be watched.


If the S&P fails to stay above the area between 1957 - 47 and we see an early break down reaching 1927 then we could see a bit of a strong push back down towards 1901. Breaks past this level could see 1882 quickly followed by 1869, 1857 and finally a test of the AUG 2015 low of 1834. If 1834 is also broken then we will discuss further downside levels on our website.


COMMODITIES


GOLD – 1107 ( - 14 or - 1.25% )


“It looks like we need a market meltdown for GOLD to rally. (Safe haven Play)”

As GOLD has not moved much, our comments from last week remain the same.


For GOLD to move higher again we would like to see a strong break early past 1134 before reaching 1149 again. Once this occurs then the area between 1161 - 67 will play a major role is allowing a push high towards 1178.


For GOLD to continue back down, 1134 needs to hold as strong resistance before a strong move down towards 1103 occurs. This could then lead to 1091 and possibly 1069.


DISCLAIMER

The views represented on this website do not contain (and should not be construed as containing) financial advice, recommendations, opinions in relation to acquiring, holding or disposing of a financial product of any kind, or a record of our trading prices, or an offer of, or solicitation for, a transaction in any financial instrument. Trade View Investments accepts no responsibility for any use that may be made of these comments and for any consequences that result. No representation or warranty is given as to the accuracy or completeness of the above information. Consequently any person acting on it does so entirely at his or her own risk. The research does not have regard to the specific investment objectives, financial situation and needs of any specific person who may receive it. It has not been prepared in accordance with legal requirements designed to promote the independence of investment research and as such is considered to be a marketing communication.


TRADE VIEW MAY CHANGE THE VIEW PRESENTED AT ANY TIME AND WILL NOT PUBLISH ANY UPDATE TO THAT EFFECT.


This communication must not be reproduced or further distributed.
 
Trade View Investments is an Algorithmic Proprietary Trading Firm based in Melbourne, Australia.

www.tradeview.com.au


WEEKLY MARKET BRIEF - 28th September 2015


This market brief is an overview of the week ahead and some of the events we see as being important to the markets.

Please be aware that our views may change throughout the course of the week, and we do not publish updates of such changes.


We may take multiple trades throughout the week and discuss in our LIVE CHAT ROOM.

Trade View has entered the weekend Net Long.


FOREX


AUD.USD – 7026 ( - 163 or - 2.27% )


The AUD really likes that 70 cent level.


If the AUD is to continue its move higher then we would like to see a strong break and close past 7116. Once this occurs it will need to become a solid level of support before another attempt at closing above 7263 can occur. Once this occurs then 7330 would complete the upside range.


If the AUD cannot break back above 7116 then we would see it retrace back down to 6957. If this level does not hold then we would look for a move down towards 6893 followed by 6809 and 6761.


EUR.USD – 11196 ( - 102 or - 0.90% )


As silly as it might have sounded Mario Draghi's tactics may just work and pay off.

With all that is going on in the Eurozone, he probably needs to keep easing for longer which should make the EURO go down.


If the EUR regains its composure and tries to rally again then we need to 11166 hold as a strong level of support before an early break back above 11315 is achieved. Once this occurs we need to a strong long up bnar break and close past 11395 before reaching 11471.


If the EUR breaks down past 11166 early in the week we could see 11038 quickly. A break through 11038 could see our downside FICM level of 10925.


GBP.USD – 15178 ( - 343 or - 2.21% )


Chop, Chop goes the GBP.


For the GBP to restart its run higher we would like to see 15248 broken early in the week with a long up bar. Once this occurs then we could see 15364 followed by 15456.


For the down move to take another leg down then we would like to see a long down bar break and close past 15139. If this occurs then we see 14950 as being the next level reached before settling near 14832.


USD.JPY – 12058 ( + 60 or + 0.50% )


Last week we were down 60 this week up 60.

Watch for the break. The two levels we are watching are: 12151 Upside, 11867 Downside.

ONCE AGAIN - Listen to and Watch the Markets, not the media.


For the USD to restart its move higher we would like to see a strong break and close past

12064 before moving towards 12151. Once this occurs then the levels we will be watching are: 12184, 12225, 12275 and 12332


For this pair to continue lower we would like to see 12064 continue to be a strong level of resistance. This could then lead to 11977 and back down to 11926 before reaching 11867 and then making its final decision. A strong break past 11867 will be discussed on our website.


COMMODITIES


GOLD – 1146 ( + 7 or + 0.61% )


“It looks like we need a market meltdown for GOLD to rally. (Safe haven Play)”

I will keep this comment here until it is not valid anymore.


For GOLD to move higher again we would like to see 1141 hold as strong support before another push past 1149 is made. Once this occurs then the area between 1161 - 67 will play a major role is allowing a push high towards 1178.


For GOLD to reverse and come back down we would like to see a strong break and close past 1141 and 1134 before pushing past 1123 and 1111 reaching 1103. Continued strong downward momentum past 1103 could then lead to 1091 and possibly 1069.


AUSTRALASIA


ASX – 5042 ( - 43 or - 0.85% )


The ASX moved sideways once again, wait for the major breaks.

As the ASX closed only a few points lower our comments remain the same.


For the upmove to restart we would like to see 5050 area hold as a strong level of support before another attempt at breaking and closing past 5150 occurs. If the momentum continues strong then we could see 5217 reached. Once this occurs and we see a strong move then 5270 and 5319 are not out of the question.


If the ASX continues down through the 5050 area early in the week then the downward process could reach 4976 and 4922 very quickly. Once this level is broken the 4863 could be seen just as fast. If the downward momentum is strong then the lows of AUG and 4754 will play a pivotal role in deciding the next direction of the ASX. If this level is broken with strong momentum then we will discuss downside levels on our website.


EUROPE


DAX – 9608 ( - 345 or - 3.47% )


It just does not stop for the European markets and the DAX is no exception:

First - Flood of refugees - Money is needed to look after them

Second - No rate cut by the Fed - indicating weaker economies

Third - VW scandal


They say back luck comes in three’s and this is no exception. So is the worst over? or is there more to come?


For the upmove to restart the DAX we need to see the Aug 2015 lows hold followed by a strong break and close past 9747.Once this occurs then we need to see another strong up bar through 9829 and 9896 reaching 10035. If the upward momentum is strong past this level then we will discuss further upside levels on our website.


If the down move is to take another leg down then a strong break past 9470 could lead the DAX down testing the AUG 2015 lows of 9321. If 9321 is broken with a long down bar then 9160 could be seen. If the downward momentum is strong then 8917 will be the last level of potential support before the DAX moves into a FREE FALL scenario. If this occurs then we will discuss downside levels on our website.


US


S&P – 1926 ( - 32 or - 1.63% )


The S&P is really struggling at the moment.

For the upward move to restart we would like to see 1901 hold as a strong level of support before pushing back past 1927 and towards the 1947 - 57 area. Once this occurs we would need to see a long up bar break through towards the area between 1981 - 90. If the momentum is strong then 2010 here we come.


If the S&P fails to stay above 1927 then a break down past 1901 could see 1882 quickly followed by 1869, 1857 and finally a test of the AUG 2015 low of 1834. If 1834 is also broken then we will discuss further downside levels on our website.


DISCLAIMER

The views represented on this website do not contain (and should not be construed as containing) financial advice, recommendations, opinions in relation to acquiring, holding or disposing of a financial product of any kind, or a record of our trading prices, or an offer of, or solicitation for, a transaction in any financial instrument. Trade View Investments accepts no responsibility for any use that may be made of these comments and for any consequences that result. No representation or warranty is given as to the accuracy or completeness of the above information. Consequently any person acting on it does so entirely at his or her own risk. The research does not have regard to the specific investment objectives, financial situation and needs of any specific person who may receive it. It has not been prepared in accordance with legal requirements designed to promote the independence of investment research and as such is considered to be a marketing communication.


TRADE VIEW MAY CHANGE THE VIEW PRESENTED AT ANY TIME AND WILL NOT PUBLISH ANY UPDATE TO THAT EFFECT.


This communication must not be reproduced or further distributed.
 
Trade View Investments is an Algorithmic Proprietary Trading Firm based in Melbourne, Australia.

www.tradeview.com.au

WEEKLY MARKET BRIEF - 05th October 2015


This market brief is an overview of the week ahead and some of the events we see as being important to the markets.

Please be aware that our views may change throughout the course of the week, and we do not publish updates of such changes.


We may take multiple trades throughout the week and discuss in our LIVE CHAT ROOM.


Trade View has entered the weekend Net Long.


FOREX


AUD.USD – 7049 ( + 23 or + 0.33% )


“The AUD really likes that 70 cent level”


If the AUD is to continue its move higher then we would like to see a strong break and close past 7116. Once this occurs it will need to become a solid level of support before another attempt at closing above 7263 can occur. Once this occurs then 7330 would complete the upside range.


If the AUD cannot break back above 7116 then we would see it retrace back down to 6957. If this level does not hold then we would look for a move down towards 6893 followed by 6809 and 6761.


EUR.USD – 11209 ( + 13 or + 0.12% )


Now that the FED might not raise what we said last week is more important than ever.

“As silly as it might have sounded Mario Draghi's tactics may just work and pay off.

With all that is going on in the Eurozone, he probably needs to keep easing for longer which should make the EURO go down.”


If the EUR regains its composure and tries to rally again then we need to 11166 hold as a strong level of support before an early break back above 11315 is achieved. Once this occurs we need to a strong long up bnar break and close past 11395 before reaching 11471.


If the EUR breaks down past 11166 early in the week we could see 11038 quickly. A break through 11038 could see our downside FICM level of 10925.


GBP.USD – 15176 ( - 2 or - 0.01% )


The GBP went sideways last week, not much more to say.


For the GBP to restart its run higher we would like to see 15248 broken early in the week with a long up bar. Once this occurs then we could see 15364 followed by 15456.


For the down move to take another leg down then we would like to see a long down bar break and close past 15139. If this occurs then we see 14950 as being the next level reached before settling near 14832.


USD.JPY – 11988 ( - 70 or - 0.58% )


The past 3 weeks have been 60 down, 60 up, 70 down.

Watch for the break. The two levels we are watching are: 12151 Upside, 11867 Downside.

ONCE AGAIN - Listen to and Watch the Markets, not the media.


For the USD to restart its move higher we would like to see a strong break and close past

12064 before moving towards 12151. Once this occurs then the levels we will be watching are: 12184, 12225, 12275 and 12332


For this pair to continue lower we would like to see 12064 continue to be a strong level of resistance. This could then lead to 11977 and back down to 11926 before reaching 11867 and then making its final decision. A strong break past 11867 will be discussed on our website.

AUSTRALASIA


ASX – 5111 ( + 69 or + 1.37% )


The ASX struggled early in the week but then regained some composure to close slightly higher.


For the upmove to really take hold then we would like to see another attempt at breaking and closing past 5150. If the momentum continues strong then we could see 5217 reached. Once this occurs and we see a strong move then 5270 and 5319 are not out of the question.


If the ASX continues down through the 5050 area early in the week again then the downward process could reach 4976 and 4922 very quickly. Once this level is broken the 4863 could be seen just as fast. If the downward momentum is strong then the lows of AUG and 4754 will play a pivotal role in deciding the next direction of the ASX. If this level is broken with strong momentum then we will discuss downside levels on our website.


EUROPE


DAX – 9688 ( + 80 or + 0.83% )


The DAX is really trying hard to move forward but as we said last week.

They say back luck comes in three’s and this is no exception. So is the worst over? or is there more to come?

First - Flood of refugees - Money is needed to look after them

Second - No rate cut by the Fed - indicating weaker economies

Third - VW scandal


For the upmove to restart the DAX we need to see the Aug 2015 lows hold followed by a strong break and close past 9747.Once this occurs then we need to see another strong up bar through 9829 and 9896 reaching 10035. If the upward momentum is strong past this level then we will discuss further upside levels on our website.


If the down move is to take another leg down then a strong break past 9470 could lead the DAX down testing the AUG 2015 lows of 9321. If 9321 is broken with a long down bar then 9160 could be seen. If the downward momentum is strong then 8917 will be the last level of potential support before the DAX moves into a FREE FALL scenario. If this occurs then we will discuss downside levels on our website.


US


S&P – 1952 ( + 26 or + 1.35% )


Its’ SHAKE ‘N’ BAKE Time


Something tells me that Ricky Bobby might be Janet Yellen in disguise?


SHAKE: give the shorts a little bite before they go all in

BAKE: cook them till their done

then slingshot the markets back up past their hurt levels.


Also one more note: with only 142K jobs added, maybe QE4 is not a bad idea.

Before you roll your eyes, who is going to fix this economy? YOU?

For the upward move to restart we would like to see the area between 1947 - 57 hold as a strong level of support before pushing back past the area between 1981 - 90. If the momentum is strong then 2010 here we come. If the S&P overextends then 2046 will be the next pivotal level to be watched.


If the S&P fails to stay above the area between 1957 - 47 and we see an early break down reaching 1927 then we could see a bit of a strong push back down towards 1901. Breaks past this level could see 1882 quickly followed by 1869, 1857 and finally a test of the AUG 2015 low of 1834. If 1834 is also broken then we will discuss further downside levels on our website.


COMMODITIES


GOLD – 1138 ( - 8 or - 0.70% )


“It looks like we need a market meltdown for GOLD to rally. (Safe haven Play)”

I will keep this comment here until it is not valid anymore.

The question now is what does a Market Meltdown look like?

Does it mean that the FED will go into QE infinity which will eventually mean they lose control?


For GOLD to move higher again we would like to see a strong break past 1141 before another push past 1149 is made. Once this occurs then the area between 1161 - 67 will play a major role is allowing a push high towards 1178.


For GOLD to reverse and come back down we would like to see a strong break and close past 1134 before pushing past 1123 and 1111 reaching 1103. Continued strong downward momentum past 1103 could then lead to 1091 and possibly 1069.


DISCLAIMER

The views represented on this website do not contain (and should not be construed as containing) financial advice, recommendations, opinions in relation to acquiring, holding or disposing of a financial product of any kind, or a record of our trading prices, or an offer of, or solicitation for, a transaction in any financial instrument. Trade View Investments accepts no responsibility for any use that may be made of these comments and for any consequences that result. No representation or warranty is given as to the accuracy or completeness of the above information. Consequently any person acting on it does so entirely at his or her own risk. The research does not have regard to the specific investment objectives, financial situation and needs of any specific person who may receive it. It has not been prepared in accordance with legal requirements designed to promote the independence of investment research and as such is considered to be a marketing communication.


TRADE VIEW MAY CHANGE THE VIEW PRESENTED AT ANY TIME AND WILL NOT PUBLISH ANY UPDATE TO THAT EFFECT.


This communication must not be reproduced or further distributed.
 
Trade View Investments is an Algorithmic Proprietary Trading Firm based in Melbourne, Australia.
www.tradeview.com.au

WEEKLY MARKET BRIEF - 12th October 2015


This market brief is an overview of the week ahead and some of the events we see as being important to the markets.

Please be aware that our views may change throughout the course of the week, and we do not publish updates of such changes.


We may take multiple trades throughout the week and discuss in our LIVE CHAT ROOM.

Trade View has entered the weekend Net Long.


FOREX


AUD.USD – 7331 ( + 282 or + 4.00% )


The AUD just went POP.


If the AUD is to continue its strong move higher then we would like to see an early move towards 7407. Once this level is broken then 7494 will come into play, as if it too is broken then 7635 is the next level.


If the fact that the AUD has completed its range and we see a move lower then an early break back down to 7263 could be the start. If 7263 is broken the 7230 could be a bystander as the AUD moves towards 7177 and 7116 quickly. A strong break past 7116 will be discussed on our website.


EUR.USD – 11358 ( + 149 or + 1.33% )


The EURO rises ever so cautiously.


If the EUR continues higher we would like to see an early long up bar break and close past 11395 before pushing towards 11427 and 11471. Once this occurs then we could see a strong rally into 11666.


If the EUR cannot break past 11395 then a down move could be seen if 11315 is broken. Once this occurs then we could see 11166 and finally 11038.


GBP.USD – 15317 ( + 141 or + 0.93% )


The GBP moved higher with the rest of the majors against the USD.


For the GBP to continue its run higher we would like to see an early break through 15366. Once this level is broken we could see the GBP near 15456 quickly. We then need to see a long up bar break through this level before reaching 15533. If the momentum stays strong then we could see the GBP reach 15590 which would complete the range.


For the down move to restart then 15366 needs to become a solid level of resistance followed by a leg down through 15280. This could then see 15248 which could lead the pair back down to 15140.


USD.JPY – 12020 ( + 32 or + 0.27% )


Something tells me we have seen this pattern before?

As the USD.JPY has not moved much, our comments remain the same:


Watch for the break. The two levels we are watching are: 12151 Upside, 11867 Downside.

ONCE AGAIN - Listen to and Watch the Markets, not the media.


For the USD to restart its move higher we would like to see a strong break and close past

12064 before moving towards 12151. Once this occurs then the levels we will be watching are: 12184, 12225, 12275 and 12332


For this pair to continue lower we would like to see 12064 continue to be a strong level of resistance. This could then lead to 11977 and back down to 11926 before reaching 11867 and then making its final decision. A strong break past 11867 will be discussed on our website.


AUSTRALASIA


ASX – 5265 ( + 154 or + 3.01% )


The ASX continued its move higher pushing past 5150 early in the week, this level then became support before another strong move higher.


For the upmove to continue this week we would like to see a strong break and close past 5319 early in the week. Once this occurs we could see 5366. Once this level is broken then we could see the ASX push up towards 5418 and finally settling near the area between 5441 - 62.


If the ASX cannot get past 5319 and a down move starts then a break through 5217 could see 5150 very quickly. If 5150 cannot hold up then we would like to see a strong long down bar break reaching 5095 and finally 5050. If the downward momentum is strong then we could see the ASX near 4976 again.


EUROPE


DAX – 10113 ( + 425 or + 4.39% )


Last week the DAX is a perfect example of how the markets work.

1 - Bad News - Markets go down

2 - More Bad News - Markets go down

3 - Even More Bad News - Markets are not sure what to do, so they go sideways


Markets are designed for growth, if all the Bad News is on the table then there is only one place for it to go. UP


For the up move to continue into this week we would like to see 10145 broken early reaching 10258. Once this level is broken we could see 10319. If the momentum is strong then a possible extension towards 10389 could occur which would complete the range set back in July.


If the down move restarts then we would like to see a strong long down bar break past the area between 10075 - 33. Once this occurs the DAX could get down to 9896 quickly. If the downward momentum continues then look out for 9829 and finally 9742.


US


S&P – 2014 ( + 62 or + 3.18% )


What a great response from our clients last week in relation to our analogy.

Therefore here it is again, but just be careful that it doesn't happen the other way now??


Its’ SHAKE ‘N’ BAKE Time

https://www.youtube.com/watch?v=9qEwBi1NyBI

Something tells me that Ricky Bobby might be Janet Yellen in disguise?


SHAKE: give the shorts (LONGS)a little bite before they go all in

BAKE: cook them till their done

then slingshot the markets back up (DOWN) past their hurt levels.

For the upward move to restart we would like to see an early break past 2024 and 2033 before pushing towards the area between 2046 - 50. This level will then need to be broken with a long up bar before reaching 2076.


If the S&P fails to stay above 2010 and we see a long down bar break and close past it early in the week then 1990 and 1981 could be quickly seen. Once these levels are broken then we are back down near the area between 1957 - 47.


COMMODITIES


GOLD – 1156 ( + 18 or + 1.58% )


“It looks like we need a market meltdown for GOLD to rally. (Safe haven Play)”

I will keep this comment here until it is not valid anymore.

The question now is “What does a Market Meltdown look like?

Does it mean that the FED will go into QE infinity which will eventually mean they lose control?


For GOLD to move higher again we would like to see an early strong break and close past the area between 1161 - 67. Once this occurs then GOLD could reach 1178 very quickly. If the upward momentum is strong we could see GOLD near 1187 and 1197 with the possibility of seeing a 1200 print once again.


For GOLD to reverse and come back down we would like to see the area between 1161 - 67 become difficult to break. If this is the case then a leg back down past 1149 could see 1141 and 1134 quickly before pushing past 1123 and 1111 reaching 1103.


DISCLAIMER

The views represented on this website do not contain (and should not be construed as containing) financial advice, recommendations, opinions in relation to acquiring, holding or disposing of a financial product of any kind, or a record of our trading prices, or an offer of, or solicitation for, a transaction in any financial instrument. Trade View Investments accepts no responsibility for any use that may be made of these comments and for any consequences that result. No representation or warranty is given as to the accuracy or completeness of the above information. Consequently any person acting on it does so entirely at his or her own risk. The research does not have regard to the specific investment objectives, financial situation and needs of any specific person who may receive it. It has not been prepared in accordance with legal requirements designed to promote the independence of investment research and as such is considered to be a marketing communication.


TRADE VIEW MAY CHANGE THE VIEW PRESENTED AT ANY TIME AND WILL NOT PUBLISH ANY UPDATE TO THAT EFFECT.


This communication must not be reproduced or further distributed.
 
Trade View Investments is an Algorithmic Proprietary Trading Firm based in Melbourne, Australia.
www.tradeview.com.au

WEEKLY MARKET BRIEF - 19th October 2015


SOME OF OUR LEVELS REACHED IN LAST WEEK'S MARKET BRIEF


ASX closed at 5265, only 5 points below our level of 5270.

SPX closed at 2014, only 4 points above our level of 2010.

AUDUSD closed at 7331, only 1 point above our level of 7330.

GBPUSD reached a high of 15383, only 21 points higher than our level of 15364


This market brief is an overview of the week ahead and some of the events we see as being important to the markets.

Please be aware that our views may change throughout the course of the week, and we do not publish updates of such changes.


We may take multiple trades throughout the week and discuss in our LIVE CHAT ROOM.

Trade View has entered the weekend Net Long.


FOREX


AUD.USD – 7264 ( - 67 or - 0.91% )


The AUD took a breather closing lower for the week near the highs 19 Sept 2015.


If the AUD is to restart its move higher we would like to see another strong break and close past 7330 before making an attempt at breaking 7407. Once this level is broken then 7494 will come into play, as if it too is broken then 7635 is the next level.


Now that the range has been completed an early break past 7230 could trigger falls past 7177 and 7116 quickly. A strong break past 7116 will be discussed on our website.


EUR.USD – 11347 ( - 11 or - 0.10% )


The EURO really struggling to get past 115 again closing only a few points lower. Therefore our comments remain the same.

If the EUR continues higher we would like to see an early long up bar break and close past 11395 before pushing towards 11427 and 11471. Once this occurs then we could see a strong rally into 11666.


If the EUR cannot break past 11395 then a down move could be seen if 11315 is broken. Once this occurs then we could see 11166 and finally 11038.


GBP.USD – 15436 ( + 119 or + 0.78% )


After an early move lower the GBP catapulted higher on Wednesday with rumours that the BOE might raise rates sooner. This was then confirmed early Friday by MS Forbes saying that the BOW would look to raise rates sooner rather than later.


For the GBP to continue its run higher we would like to see an early break and close past our FICM level of 15458 before reaching 15533. If the upward momentum continues strong then we will be looking for the pair to reach 15591 before settling near 15644.


For the down move to restart then 15458 needs to become a solid level of resistance followed y a leg down through 15366. Once this level is broken we could see 15280 stand aside as the GBP reaches 15250.


USD.JPY – 11944 ( - 76 or - 0.63% )


“Something tells me we have seen this pattern before?

As the USD.JPY has not moved much, our comments remain the same:


Watch for the break. The two levels we are watching are: 12151 Upside, 11867 Downside.

ONCE AGAIN - Listen to and Watch the Markets, not the media.”


For the USD to restart its move higher we would like to see a strong break and close past

12064 before moving towards 12151. Once this occurs then the levels we will be watching are: 12184, 12225, 12275 and 12332


For this pair to continue lower we would like to see 12064 continue to be a strong level of resistance. This could then lead to 11977 and back down to 11926 before reaching 11867 and then making its final decision. A strong break past 11867 will be discussed on our website.


COMMODITIES


GOLD – 1176 ( + 20 or + 1.73% )


Another strong rally by GOLD last week may indicate a weaker USD. The Big question still remains - will the FED raise rates this year? If they don’t then maybe we are in deeper than expected.


For GOLD to move higher again we would like to see an early strong break and close past our FICM level of 1178. If the upward momentum is strong we could see GOLD near 1187 and 1197 with the possibility of seeing a 1200 print with the possible extension towards 1216


For GOLD to reverse and come back down we would like to see 1178 become a strong level of resistance before another break down past the area between 1161 - 67. Once this occurs then a leg back down past 1149 could see 1141 and 1134 quickly before pushing past 1123 and 1111 reaching 1103.


DISCLAIMER

The views represented on this website do not contain (and should not be construed as containing) financial advice, recommendations, opinions in relation to acquiring, holding or disposing of a financial product of any kind, or a record of our trading prices, or an offer of, or solicitation for, a transaction in any financial instrument. Trade View Investments accepts no responsibility for any use that may be made of these comments and for any consequences that result. No representation or warranty is given as to the accuracy or completeness of the above information. Consequently any person acting on it does so entirely at his or her own risk. The research does not have regard to the specific investment objectives, financial situation and needs of any specific person who may receive it. It has not been prepared in accordance with legal requirements designed to promote the independence of investment research and as such is considered to be a marketing communication.


TRADE VIEW MAY CHANGE THE VIEW PRESENTED AT ANY TIME AND WILL NOT PUBLISH ANY UPDATE TO THAT EFFECT.


This communication must not be reproduced or further distributed.


AUSTRALASIA


ASX – 5290 ( + 25 or + 0.47% )


After an early move lower the ASX bounced off our FICM Level of 5150 to close slightly higher for the week. Therefore our comments remain the same:


For the upmove to continue this week we would like to see a strong break and close past 5319 early in the week. Once this occurs we could see 5366. Once this level is broken then we could see the ASX push up towards 5418 and finally settling near the area between 5441 - 62.


If the ASX cannot get past 5319 and a down move starts then a break through 5217 could see 5150 very quickly. If 5150 cannot hold up then we would like to see a strong long down bar break reaching 5095 and finally 5050. If the downward momentum is strong then we could see the ASX near 4976 again.


EUROPE


DAX – 10121 ( + 8 or + 0.08% )


After an early drop reaching 9888 which was only 8 points lower than our level of 9896 the DAX recovered to close only slightly higher. Therefore our comments remain the same:


For the upmove to continue into this week we would like to see 10145 broken early reaching 10258. Once this level is broken we could see 10319. If the momentum is strong then a possible extension towards 10389 could occur which would complete the range set back in July.


If the down move restarts then we would like to see a strong long down bar break past the area between 10075 - 33. Once this occurs the DAX could get down to 9896 quickly. If the downward momentum continues then look out for 9829 and finally 9742.


US


S&P – 2034 ( + 20 or + 0.99% )


And there we have it, a nice early reversal down before another move higher. This week will be an Interesting week to see if the S&P can rally past the 2046 - 50 area which was the premise for the collapse in AUG this year


For the upward move to continue we would like to see 2010 become a strong support level before pushing towards the area between 2046 - 50. This level will then need to be broken with a long up bar reaching 2076. If the momentum is strong then 2101 and possibly 2112 could be seen.


If the S&P fails to stay above 2010 and we see a long down bar break and close past it early in the week then 1990 and 1981 could be quickly seen. Once these levels are broken then we are back down near the area between 1957 - 47.
 
Trade View Investments is an Algorithmic Proprietary Trading Firm based in Melbourne, Australia.

www.tradeview.com.au


WEEKLY MARKET BRIEF - 26th October 2015


This market brief is an overview of the week ahead and some of the events we see as being important to the markets.

Please be aware that our views may change throughout the course of the week, and we do not publish updates of such changes.


We may take multiple trades throughout the week and discuss in our LIVE CHAT ROOM.

Trade View has entered the weekend Net Long.


FOREX


AUD.USD – 7216 ( - 48 or - 0.66% )


A slow moving week for the AUD. Therefore our comments remain the same.


If the AUD is to restart its move higher we would like to see another strong break and close past 7330 before making an attempt at breaking 7407. Once this level is broken then 7494 will come into play, as if it too is broken then 7635 is the next level.


Now that the range has been completed an early break past 7230 could trigger falls past 7177 and 7116 quickly. A strong break past 7116 will be discussed on our website.


EUR.USD – 11017 ( - 330 or - 2.91% )


Mario Draghi to the rescue?


For the EUR to restart higher we would like to see an early break back above 11038 before reaching 11166. Dare I say it that if the upward momentum gets traction then we see a complete FADE back to 11315?


If the EUR continues lower then we would like to see a strong break and close past 10925 before we see 10780.


GBP.USD – 15311 ( - 125 or - 0.81% )


The GBP followed the EUR lower after Mario Draghi’s comments.


For the GBP to restart its move higher we need to see a strong break back up above 15366 followed by a strong push past 15458.


For the down move to restart then a strong break past 15280 could see 15250 tested. This level will then need to be broken with a long down bar before testing the lows of 10 Oct 2015.


USD.JPY – 12145 ( + 201 or + 1.68% )


Now that the USD has broken the channel, let's see if it can repeat the big moves we saw back in Oct 2012 and Aug 2014?


Watch for the break. The two levels we are watching are: 12151 Upside, 11867 Downside.

ONCE AGAIN - Listen to and Watch the Markets, not the media.”


For the USD to restart its move higher we would like to see a strong break and close past

12151. Once this occurs then the levels we will be watching are: 12184, 12225, 12275 and 12332


For this pair to continue lower we would like to see 12064 continue to be a strong level of resistance. This could then lead to 11977 and back down to 11926 before reaching 11867 and then making its final decision. A strong break past 11867 will be discussed on our website.


COMMODITIES


GOLD – 1164 ( - 12 or - 1.02% )


The GOLD rally is losing steam.


For GOLD to move higher again we would like to see an early strong break and close past our FICM level of 1178. If the upward momentum is strong we could see GOLD near 1187 and 1197 with the possibility of seeing a 1200 print with the possible extension towards 1216


For GOLD to reverse and come back down we would like to see 1178 become a strong level of resistance before another break down past the area between 1161 - 67. Once this occurs then a leg back down past 1149 could see 1141 and 1134 quickly before pushing past 1123 and 1111 reaching 1103.


DISCLAIMER

The views represented on this website do not contain (and should not be construed as containing) financial advice, recommendations, opinions in relation to acquiring, holding or disposing of a financial product of any kind, or a record of our trading prices, or an offer of, or solicitation for, a transaction in any financial instrument. Trade View Investments accepts no responsibility for any use that may be made of these comments and for any consequences that result. No representation or warranty is given as to the accuracy or completeness of the above information. Consequently any person acting on it does so entirely at his or her own risk. The research does not have regard to the specific investment objectives, financial situation and needs of any specific person who may receive it. It has not been prepared in accordance with legal requirements designed to promote the independence of investment research and as such is considered to be a marketing communication.


TRADE VIEW MAY CHANGE THE VIEW PRESENTED AT ANY TIME AND WILL NOT PUBLISH ANY UPDATE TO THAT EFFECT.


This communication must not be reproduced or further distributed.


AUSTRALASIA


ASX – 5397 ( + 107 or + 2.02% )


Another early move lower the ASX before a bounce and strong rally towards 5400.


For the upmove to continue this week we would like to see 5366 become a strong level of support before a move back up past 5418 reaching the area between 5441 - 62. Once this area is broken we could see 5541 reached. If the momentum is strong then 5595 will come back into play.


If the ASX cannot get past the area between 5441 - 62 and we see a breakdown past 5366 the ASX could see itself near 5270 very quickly followed by 5217. If the downside momentum continues then we could see 5150 again.


EUROPE


DAX – 10820 ( + 699 or + 6.91% )


Once the DAX started it just kept going. Oh the fact that Mario Draghi indicated possible continued QE might have helped.


For the upmove to continue this week we would like to see a strong break and close past our FICM level of 10868. Once this occurs then we could see 10941 followed by 11080. Continued strong momentum could see the DAX push towards 11163 then 11257 and 11292 before it takes a breather.


For the down move to restart then 10868 needs to become a solid level of resistance before a push past 10793 and 10684. A break past 10684 could see the DAX near 10497 very quickly. If the momentum is strong then 10389 could bee seen before it settles near 10318.


US


S&P – 2071 ( + 37 or + 1.82% )


The S&P does it again, up towards the area between 2046 - 50 area, then down it goes towards 2014 giving the shorts a little bite, then …………………………...POP before you know it 2071.

SHAKE and BAKE.


For the upward move to continue we would like to see and early break past 2085 before we see 2101 again. If the upward momentum is strong then we could see 2112 again.


If the S&P fails to break above 2085 we could see a strong move back down towards the key area between 2050 - 46 again. This are will then need to be broken with a long down bar before reaching 2033, 2044 and finally 2010.


FOREX


AUD.USD – 7216 ( - 48 or - 0.66% )


A slow moving week for the AUD. Therefore our comments remain the same.


If the AUD is to restart its move higher we would like to see another strong break and close past 7330 before making an attempt at breaking 7407. Once this level is broken then 7494 will come into play, as if it too is broken then 7635 is the next level.


Now that the range has been completed an early break past 7230 could trigger falls past 7177 and 7116 quickly. A strong break past 7116 will be discussed on our website.


EUR.USD – 11017 ( - 330 or - 2.91% )


Mario Draghi to the rescue?


For the EUR to restart higher we would like to see an early break back above 11038 before reaching 11166. Dare I say it that if the upward momentum gets traction then we see a complete FADE back to 11315?


If the EUR continues lower then we would like to see a strong break and close past 10925 before we see 10780.


GBP.USD – 15311 ( - 125 or - 0.81% )


The GBP followed the EUR lower after Mario Draghi’s comments.


For the GBP to restart its move higher we need to see a strong break back up above 15366 followed by a strong push past 15458.


For the down move to restart then a strong break past 15280 could see 15250 tested. This level will then need to be broken with a long down bar before testing the lows of 10 Oct 2015.


USD.JPY – 12145 ( + 201 or + 1.68% )


Now that the USD has broken the channel, let's see if it can repeat the big moves we saw back in Oct 2012 and Aug 2014?


Watch for the break. The two levels we are watching are: 12151 Upside, 11867 Downside.

ONCE AGAIN - Listen to and Watch the Markets, not the media.”


For the USD to restart its move higher we would like to see a strong break and close past

12151. Once this occurs then the levels we will be watching are: 12184, 12225, 12275 and 12332


For this pair to continue lower we would like to see 12064 continue to be a strong level of resistance. This could then lead to 11977 and back down to 11926 before reaching 11867 and then making its final decision. A strong break past 11867 will be discussed on our website.


COMMODITIES


GOLD – 1164 ( - 12 or - 1.02% )


The GOLD rally is losing steam.


For GOLD to move higher again we would like to see an early strong break and close past our FICM level of 1178. If the upward momentum is strong we could see GOLD near 1187 and 1197 with the possibility of seeing a 1200 print with the possible extension towards 1216


For GOLD to reverse and come back down we would like to see 1178 become a strong level of resistance before another break down past the area between 1161 - 67. Once this occurs then a leg back down past 1149 could see 1141 and 1134 quickly before pushing past 1123 and 1111 reaching 1103.


DISCLAIMER

The views represented on this website do not contain (and should not be construed as containing) financial advice, recommendations, opinions in relation to acquiring, holding or disposing of a financial product of any kind, or a record of our trading prices, or an offer of, or solicitation for, a transaction in any financial instrument. Trade View Investments accepts no responsibility for any use that may be made of these comments and for any consequences that result. No representation or warranty is given as to the accuracy or completeness of the above information. Consequently any person acting on it does so entirely at his or her own risk. The research does not have regard to the specific investment objectives, financial situation and needs of any specific person who may receive it. It has not been prepared in accordance with legal requirements designed to promote the independence of investment research and as such is considered to be a marketing communication.


TRADE VIEW MAY CHANGE THE VIEW PRESENTED AT ANY TIME AND WILL NOT PUBLISH ANY UPDATE TO THAT EFFECT.


This communication must not be reproduced or further distributed.
 
Back
Top