XTIUSD price analysis

Hello everyone, have a nice day, hope everything is doing well today.

Looking at changes in oil prices today US Crude oil is trading at 85.18. Yesterday the price fell to a low of 83.51 and touched the middle band line then rose and created a pin bar candle.

Iran's attack on Israel is still a hot debate in the global geopolitical situation. According to the Oilprice report, Israel vowed to respond to Iran's attack when oil prices fell. The action will be coordinated with the US, which is Israel's main ally.

XTIUSD technical analysis today

The price of US crude oil rose again after falling to a low of 83.51 and is now perched at 85.18.

f7kjpXry.png


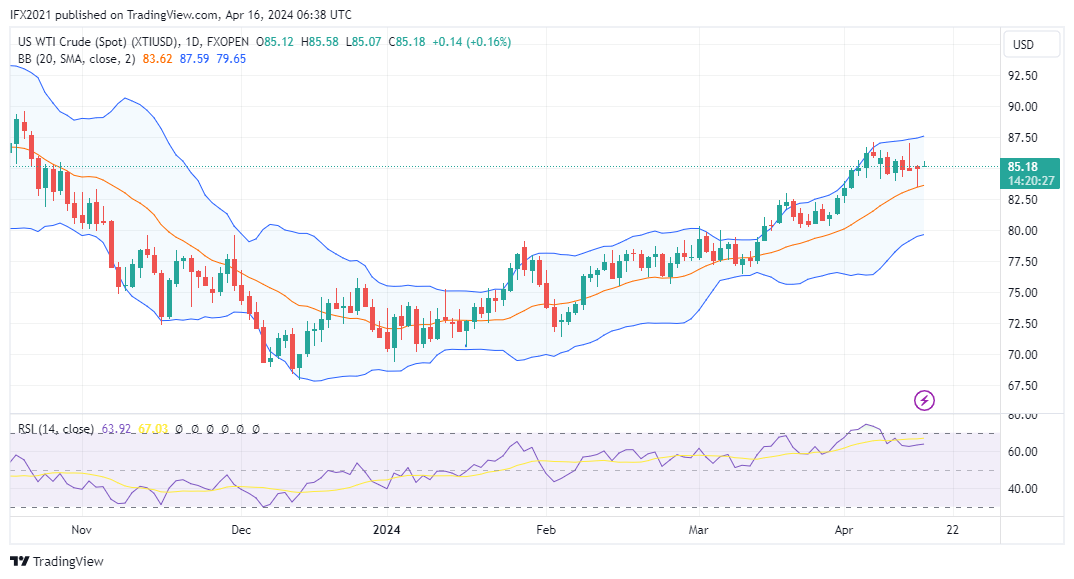
On the daily timeframe oil prices move between the upper and middle band lines. Here the Bollinger bands form an upward channel with wide bands indicating an uptrend with high volatility.
The 50 MA formed an ascending channel near the lower band line reflecting a long-term bullish market.
Meanwhile, the RSI indicator is at level 67, meaning the price is moving above the uptrend level.

On the H1 timeframe, oil prices move near the middle band line, the price appears to be falling from near the upper band line trying to touch the lower band line.
Here the Bollinger bands form an upward channel with expanding bands indicating high market volatility.
MA 50 forms a flat channel near the price between the upper and middle band lines indicating a sideways market.
Meanwhile, the RSI indicator shows level 51 drawing a descending line indicating that prices are moving above the uptrend level with the possibility of a reversal.

Support and resistance

The closest support is based on the lower band at 84.00 and the support is based on the upper band at roughly 86.00.

In the daily period the support zone is near the middle band at roughly 83.50 and the resistance is above 87.00
 
Hello everyone, have a nice day, I hope everyone is healthy and happy today

Paying attention to today's oil prices, US crude oil is trading at 84.40 with today's performance being a high of 84.93 and a low of 84.16.

The debate about Israel taking revenge on Iran is still an important issue regarding oil in addition to the US election which is also important news on the financial markets.

Some analysts fear rising tensions in the Middle East could take oil to $100 due to an immediate threat to oil supplies.

XTIUSD technical analysis today

XTIUSD FXOpen.png


Today's US crude oil price is trading at 84.40, the price is slightly down 0.30% but still has not changed the bullish market structure.
On the daily timeframe, the price is now moving above the middle band line which is currently dynamic support.
The Bollinger band indicator pattern forms an upward channel with wide bands indicating high volatility.
Meanwhile, the RSI shows level 58, meaning the price is moving above the uptrend level.

On the H1 timeframe the price moves near the lower band line below the middle band line. Here the Bollinger bands draw a downward channel with a narrow band distance indicating less market volatility.
Meanwhile, the RSI shows level 43, meaning the price is below the downtrend.

Support and resistance

The nearest support is based on the lower band at roughly 83.50 and resistance is near the upper band at roughly 87.80.
 
Hello everyone, have a nice day, I hope all FPA members are always healthy and happy. Health is a very valuable treasure in life.

Back to monitor oil price today, US crude oil is trading at 82.32. Yesterday the price fell and formed a bearish candlestick with a long body reflecting the price falling sharply across the middle band line.

This condition seems to rule out the Iran vs Israel conflict which has added to the escalation of war in the Middle East. The fall in oil prices was caused by the buildup of oil stocks of more than 3% according to the Oilprice report.

On Wednesday, the Energy Information Administration (EIA) released its weekly inventory report showing an increase of 2.7 million barrels to 460 million barrels in the week ending April 12. The estimate based on a Reuters poll was only 1.4 million barrels. -building, causing oil prices to plummet. Write the report.

XTIUSD technical analysis today

XTIUSD FXOpen.png

Gold prices plunged from a high of 84.93 to a low of 81.98 in just one trading day. This missed expectations from analysts who predicted oil could reach $100 due to the escalation of war in the Middle East.

On the daily timeframe, the oil price successfully broke the middle band line from the upside and brought the oil price below the middle band line.

Here the Bollinger bands form a slight upward channel with wide bands reflecting high market volatility.
Meanwhile, the RSI shows level 47, which means the price is moving below the downtrend level.

On the H1 timeframe, the price is consolidating after yesterday's sharp decline. It appears that small body candlesticks are lined up on this timeframe, reflecting low volatility.

Here the Bollinger band draws a descending line with a wide distance indicating high volatility. However, it appears that the band line is starting to draw narrower.

On the other hand, the RSI indicator shows level 30, meaning the price has entered the oversold zone.

Support and resistance

In the short term, the support zone is near the lower band at 81.00 and resistance is near the upper band at roughly 85.00.
More extreme, if the price continues to fall, it may look for support near the lower band at roughly 80.00. Meanwhile, long-term resistance is roughly 87.50.
 
Hello everyone, have a nice day, Friday of the trading weekend before it closes

Monitoring changes in oil prices today shows that US crude oil is rising and falling with high volatility. Price forms a small body bull candlestick with a long shadow on the top candle.
This candlestick pattern reflects the price trying to rise but experiencing selling pressure with balanced volume.

The soaring volatility in oil prices is inseparable from the uncertainty of the conflict in Central Timor, marking heated geopolitical tensions.

On the other hand, analysts and traders also largely expect Iran's retaliation for Israel's attack on Iran's diplomatic mission in Syria. They are also aware that OPEC+, which has once again firmly regained control of the oil market, has a reserve capacity of about 5 million barrels per day of oil production that can be restored gradually in the event of a severe tightening in the oil market. market and a spike in oil prices above $100 per barrel.

XTIUSD technical analysis today

XTIUSD FXOpen.png

The price of US crude oil was trading at 82.15, the price rose to a high of 85.48 but fell again to a low of 81.08.

On the daily timeframe, oil prices move between the middle and lower band lines. Here the bearish candlestick has a long shadow on the top candle.

The Bollinger band indicator formed a slight upward channel with the draw line changing to flat.
High market volatility is visible from wide band distances. Meanwhile, the 50 MA formed a slightly rising channel near the lower band line.

The RSI indicator shows level 47, meaning the price is moving below the downtrend level.

On H1 the price is now moving below the MA 50 and middle band line. It appears that the price is trying to pass the MA 50 from the bottom side.

Bollinger bands appear to be expanding, indicating high market volatility.

MA 50 forms a slight descending channel in this time frame, meaning it is a downtrend.

Meanwhile, the RSI indicator shows level 46, meaning the price is moving in a downtrend level.

Support and resistance

Support in the long term is based on the MA 50 line at roughly 180.420 while resistance is based on the upper band at roughly 87.50.
 
Hello everyone, Monday the forex market starts to be active, dope all traders doing well this week

Observing recent changes in oil prices, the price of US crude is still trading at around 81 level despite increasing tensions in the Middle East.
It seems that the situation in the Middle East has not succeeded in causing oil prices to soar as many analysts predicted.
Oil prices were volatile when Iran attacked Israel, but it was only a temporary fluctuation and oil entered the consolidation zone
On the other hand, OPEC+ returning a supply of 2 million bpd could affect oil prices.

XTIUSD technical analysis today

Oil prices are consolidating near the lower band line after previously forming a doji candle with a long wick on the top candle.

XTIUSD FXOpen.png


On the daily timeframe, the price of US crude oil at market opening no gap occurs. It can be seen here that the Bollinger bands form a slight upward channel with a wide band indicating high market volatility.

MA 50 measures the daily period of the past 50 days, drawing a slight upward channel indicating a market uptrend.
On the other hand, the RSI indicator is at level 46, meaning the price is moving below the downtrend level

On the H1 timeframe, the price of US crude oil moves below the middle band line and the MA 50 line, reflecting a downtrend movement.
Here the Bolinger bands draw a flat channel with wide bands indicating a sideways market.
Meanwhile, the RSI is at level 44, meaning the price is moving below the downtrend level

Support and resistance

The nearest support is based on the lower band line at roughly 81.00 and resistance is based on the upper band at roughly 85.00.
Prices may still move within the previous daily range with a swing high of 84 and a swing low of 81.
 
Hello everyone, have a nice day, hope all traders doing well and in full health and prosperity

Today's oil price is moving in consolidation between the middle and lower band lines. US crude oil price is at 82.08 at the time of writing.

Although tensions in the Middle East are still tense, there has not yet been a continuation of the Iran vs Israel war. Despite this, Israeli tensions in Palestine continue.

On the other hand, oil-related news citing Oilprice, Venezuela is starting to try to use crypto to sanction oil sales. State-run oil company PDVSA was ordered to close transactions in line with sanctions at the end of May and it tried to redirect its oil sales using Tether as digital currency pegged to USD
Venezuela's state-owned oil company began experimenting with Tether for oil sales in 2023.

XTIUSD technical analysis today

XTIUSD FXOpen.png

US crude oil prices have been consolidating since Monday after plunging on April 19.
The price is now moving slightly above the lower band line and MA 50 with low volatility.

On the daily timeframe, the Bollinger band draws a flat channel with a wide band distance indicating a sideways market. Prices move within the swing low range of 80 and swing high of 87.
MA 50 near the lower band line draws a slight upward channel indicating an uptrend market.
Meanwhile, the RSI indicator points to level 47, meaning the price is moving below the downtrend level.

On the H1 timeframe, the price moves near the upper band line. Here you can see the Bollinger band line expanding slightly, indicating that volatility has increased slightly.
The 50 MA draws a flat channel near the price reflecting a sideways market.
On the other hand, the RSI indicator points to level 52, meaning the price is moving above the uptrend level.

Support and resistance

The price of US crude oil shortly moves at the resistance level based on the upper band at roughly 82.30, a breakout of this price level could bring oil up to find new resistance.
Support zone-based lower band at roughly 80.50, a breakout of this level could bring oil prices down looking for new support.
In the long term, the price may move within the support range of 80.00 and 87.00
 
Hello everyone, have a nice day, hope all doing well today full health and prosperity

After dropping to a low of 80.73, the price of US crude oil rose again, now at 83.21, up 0.07%. It appears that yesterday's bullish candlestick formed a long wick at the botton candle.

High global geopolitical pressure can influence oil prices in addition to demand and supply in the market. Besides the migration of fossil fuels towards green energy, it can also affect the oil market.
Citing to Oilprice in the UK wind has overtaken fossil fuels to become the largest power generation source.
In the first quarter of 2024, wind-generated a total of 25.3 terawatt hours (TWh) of Britain's electricity, higher than the 23.6 TWh generated from fossil fuel sources, Ember data showed. As a result, wind power generated an average of 39.4% of the UK's electricity between January and March 2024, versus a 36.2% share of fossil fuel generation.

XTIUSD technical analysis today

XTIUSD FXOpen.png


The price of US crude oil is trading below the middle band line at 83.21 after falling to a low of 80.73. The potential for a bullish round could repeat itself again with resistance at the 87 price level.

On the daily timeframe, prices move between the middle and lower band lines. MA 50 near the lower band is drawing a slight rising channel indicating a market uptrend.

The Bollinger band structure forms a flat channel with wide bands indicating a sideways market with medium volatility.

The RSi indicator points to level 53, meaning the price is moving above the uptrend level.

On the H1 timeframe, the price moves near the upper band line, and there appears to be a weakening of the rising wave in this timeframe as indicated by the candlestick body getting smaller.

Bollinger bands draw a flat channel with expanding bands indicating high volatility markets.

Meanwhile, the MA 50 below the middle band draws a flat channel indicating a sideways market.

The RSi indicator points to level 60, meaning the price is moving above the uptrend level.

Support and resistance

The nearest support refers to the lower band line at around 81.00 while resistance is around 84.00 in the short term.

On the daily timeframe the support zone is around 80.00 and resistance is around 87.00.
 
Hello everyone, have a nice day, I hope all members of the FPA community are doing well, full of health and prosperity

Pay attention to the price of US crude oil today at the 82.43 price level. Oil prices fell yesterday forming a bearish candlestick on the daily timeframe.

Although oil reserves were built in the middle of this month, it was triggered by concerns about decreasing oil demand. However, Standard Chartered has predicted that global oil demand will pick up strongly in May and June, exceeding 103 mb/d for the first time in May.

Oil prices tend to be stable week on week despite a significant US oil inventory build offset by a decline in US crude oil stocks. It seems that traders are also less worried about supply disruptions due to tensions in the Middle East.

XTIUSD technical analysis today

XTIUSD FXOpen.png

The US crude price is trading at 82.43. Yesterday the price formed a high of 83.47 and fell to a low of 82.24. This week's low fell to 80.59 on April 22,

On the daily timeframe, the price of US crude oil is traded between the middle and lower band lines.
The 50 MA here is building a slight ascending channel near the lower band line. Meanwhile, the RSI indicator points to level 49, meaning the price is moving below the downtrend level.

In the H1 timeframe, lower volatility prices can be seen from the Bolinger band squeeze which reflects a flat market.

MA 50 also draws a flat channel near the price indicating a sideways market. And the RSi indicator points to level 45, meaning the price is moving below the downtrend level.

Support and resistance

Taking the pattern in the H4 timeframe, the support zone is based on the lower band at around 80.00 and resistance is based on the upper band at roughly 83.50.
 
Back
Top