XTIUSD price analysis

Hello all traders FPA forum, wish all traders will be profitable today.

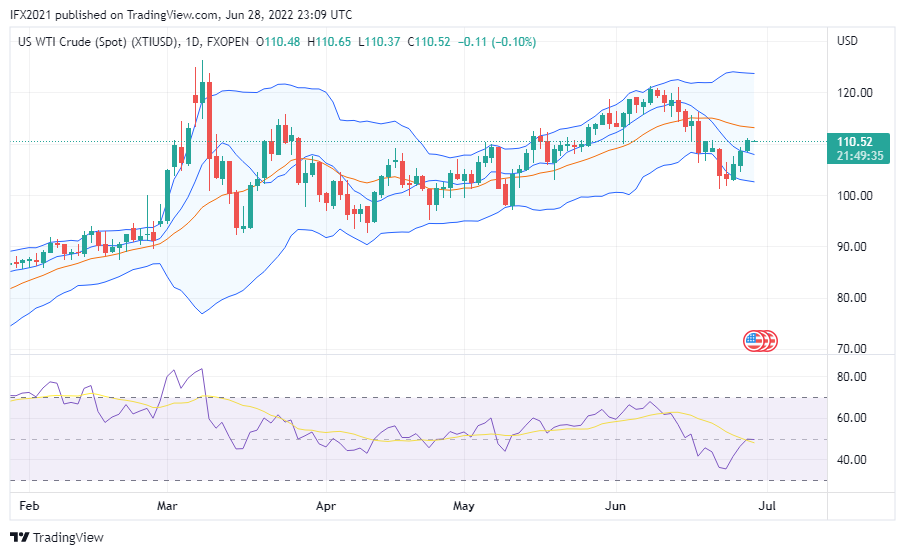
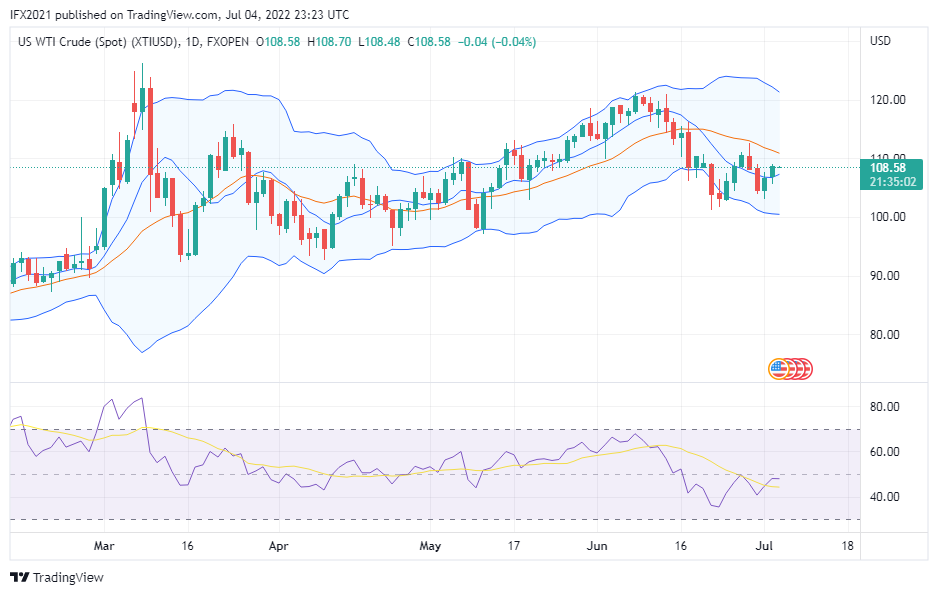
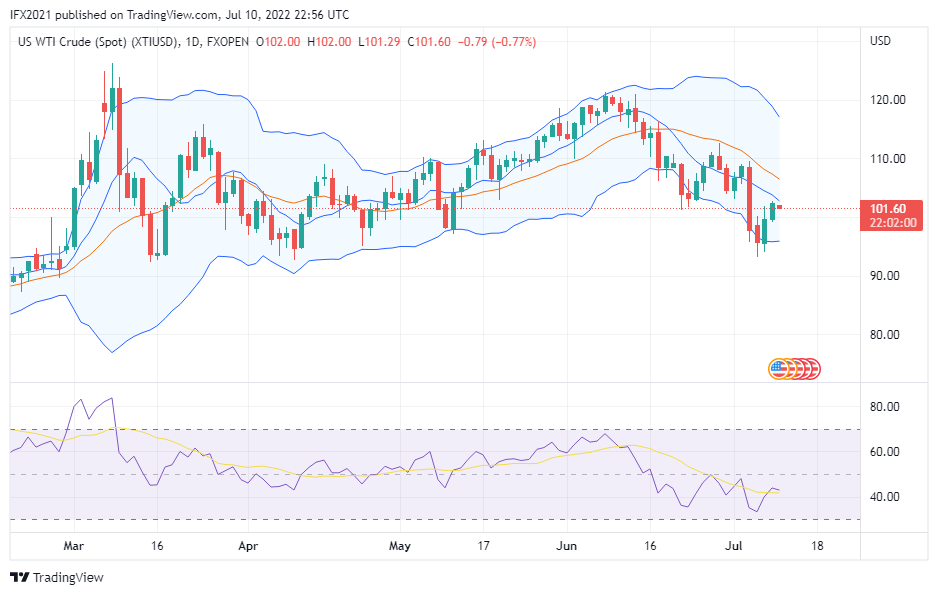
Back to the XTIUSD chart, the Oil price is now 108.75 small rise of +0.15% from the opening price of 105.93. Although oil and gas employment a rise, but still uncertain, the reason is the transition to green energy maybe impact employment in the gas and oil industry.

Daily timeframe oil price, crosses MA line as buying signal based indicator, while the price still below middle band line, and RSI level 46 trying to cross the moving average line.

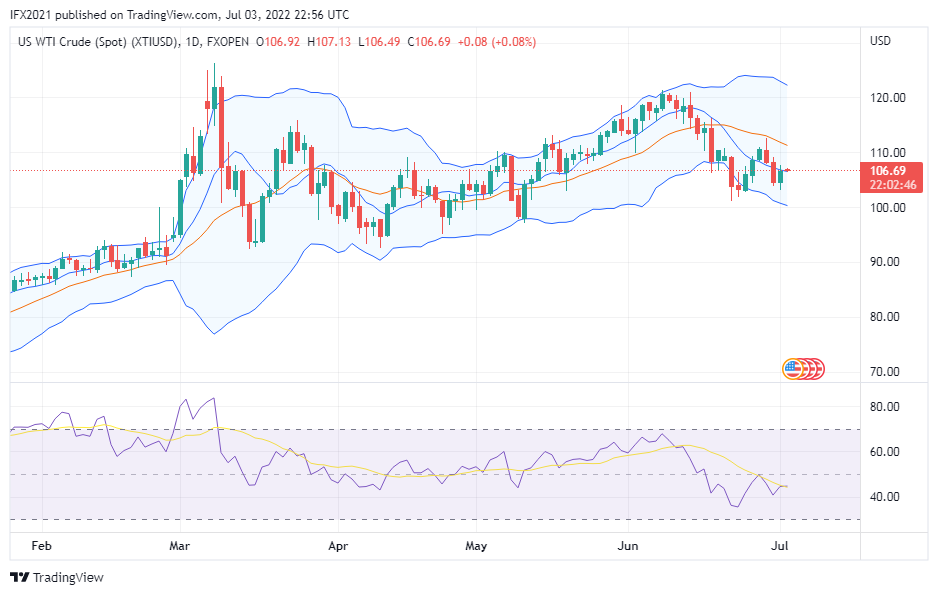
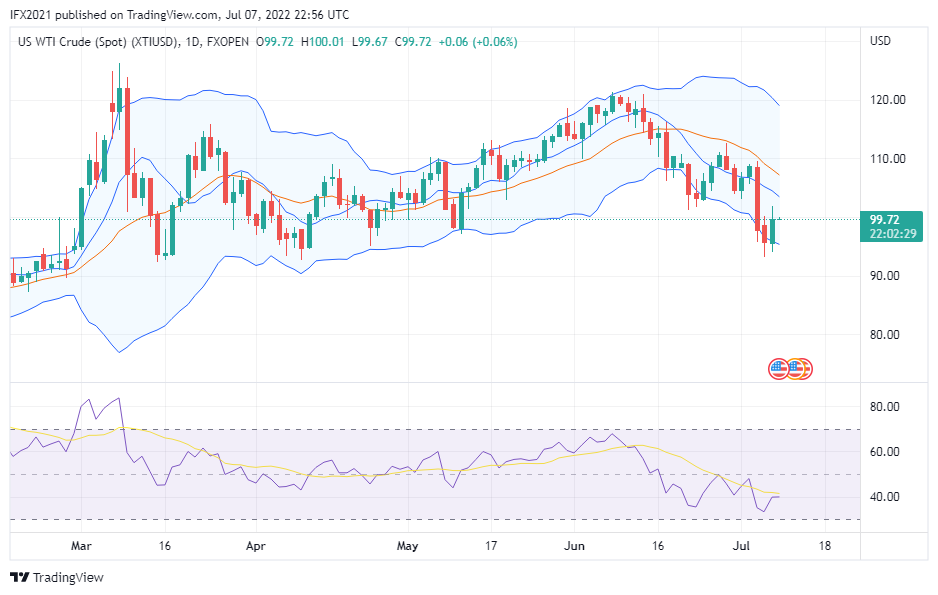
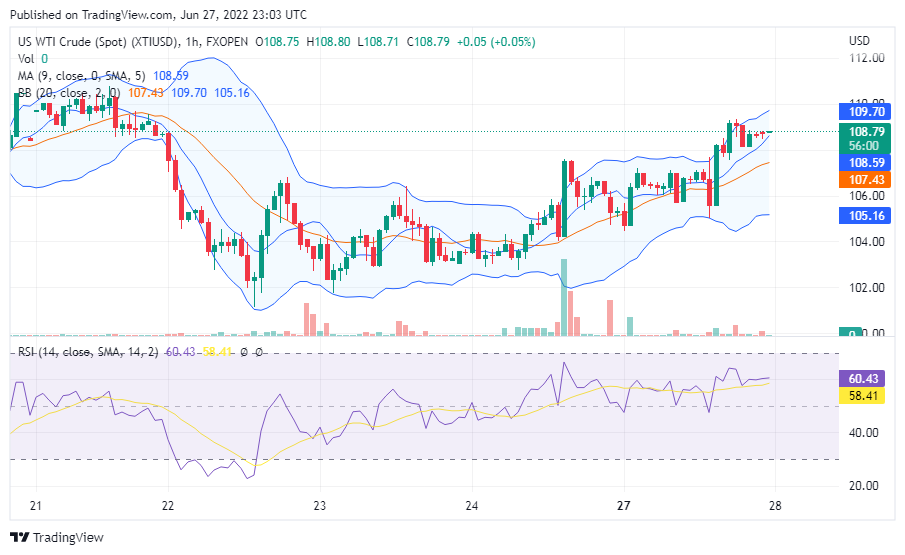
H1 timeframe oil price already above MA line and below upper band line, where the price move amid middle band and the upper band as uptrend pattern, RSI level 60 above moving average line signaling uptrend market.
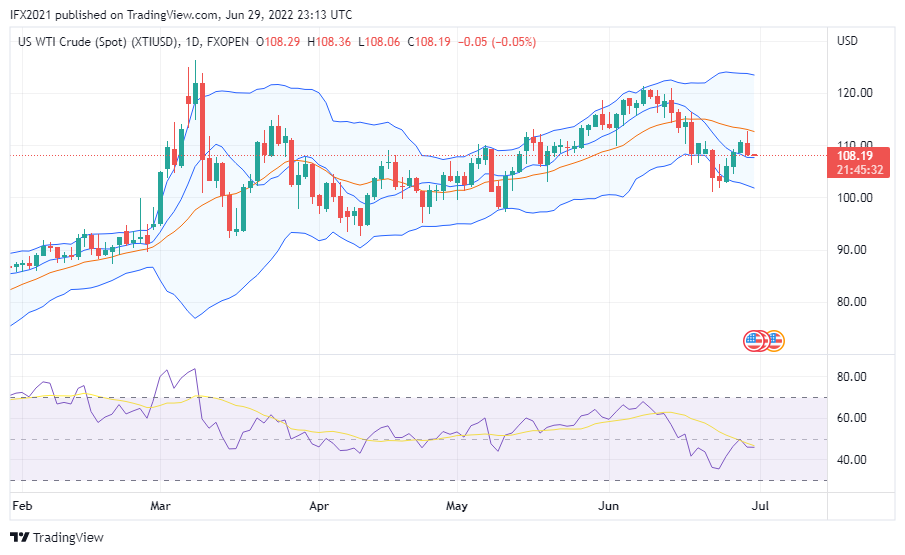
crRUI1OU.png
 
Hello everyone all fellow traders and members FPA forum community, wish all will be profitable today.

XTIUSD trying to hike the now price to 110.53. the price crossing the MA line indicates an uptrend as a key point-based indicator.

In the news related to oil, the President of Russia, Vladimir Putin threatens to strike the largest oil hub in Rotterdam Europe, as reported at oilprice.com.

Based on technical analysis, daily timeframe shows the price cross MA means reversal signal confirmed based indicator, while the price now still below middle band line, and RSI level 48 cross SMA line.

H1 timeframe, the price now in consolidation near upper band zone level, while the price above MA line indicates uptrend based indicator.RSI level 62 indicates the uptrend.

1eoWbKXP.png
 
Hello everyone, all traders and FPA members. Wish all will be profitable today.

XTIUSD price today I see 108.30, it is formed bears candle yesterday, the price success to reach 112 and touch middle band line, but then get a rejection on these zone level make the price drop to 108 level price.

Oil news now about the G7 has paved the way to increased oil and gas spending, Although green energy become a hot issue in coming years, but seems G7 still trying to pave the way to spending investment for fossil energy to balance supply and demand.

Oil price daily timeframe shows the price bounce and new MA line, here MA as first support zone level, while RSI level 45 indicates a downtrend.

H1 timeframe, price drops heavily and now in a consolidation phase, where small candle H1 indicates volume weaken. The price below the MA line indicates a downtrend, while RSI level 34 is near the oversold zone level.

dgnq9cR7.png
 
Hello all traders members FPA forum community, wish you all will be profitable today.

XTIUSD price dropped to 104.53 at time writing, the Oil price still fails to reach 120 and plummet to the current level. Seems worried about the recession is still gives an impact on oil prices.

Today's news related to Oil is, that about natural gas, G7 planned to change investment to the LNG sector industry, and its sustained LNG prices.

Daily timeframe, XTIUSD the price below MA line indicates downtrend, and price also moves between the middle band and lower band, means in downtrend pattern. while the RSI level shows 39 indicates a downtrend.

H1 timeframe, candle pattern consolidation, but the price below MA line means downtrend based indicator, and Bollinger band line expands as increase volatility, RSI level 31 below SMA line indicates a downtrend.

c9v5JonV.png
 
Hello everyone, have a nice day, with all traders will be profitable today.

XTIUSD's price is now 106.69. the price rise 0.08%, the price trying to cross the MA line after previous drops to a low 103.07.

An analyst from JP Morgan & Co analyst Natasha Kaneva predicts world oil prices could continue to skyrocket to a price level of US$ 380 per barrel.

This is inseparable from the latest condition which shows that Russia is able to produce daily crude oil of 5 million barrels without disrupting the economy. This was possible because of Moscow's strong fiscal position.

XTIUSD oil price now still moves on support zone level near the lower band, the price trying to cross MA line to reach middle line level 110. While RSI level 42 trying to cross the SMA line.

In the H1 timeframe, now the price is above the MA line and rises to try to reach the upper band line level of 108.36 based H1 timeframe, while RSI level above SMA line indicates a buy signal. Support zone level 102.00 based lower band.

ZwGTtIzE.png
 
Hello everyone, nice to meet with a new day, with all traders will become profitable and bright future.

XTIUSD now price 108.56%, a fall of -0.06% from the opening price. But the price now crosses the MA line indicating an uptrend on a daily timeframe.

News related oil, Russia announces discovery oil 82 million tons of oil in the Pechora Sea. But western states don't have the technology to grow oil. While other news, Germany maybe needs more than 15 billion to solve the gas crisis.

Daily timeframe XTIUSD the price already crosses the MA line from below to top, there are reversal pattern-based MA line starting to steep up, possible resistance based upper band zone level 120 and support level 100. RSI shows level 49 above the SMA line indicating an uptrend occurs during a downtrend market.

H1 timeframe, Oil price near upper band line, and above MA line indicates uptrend but near the high, there are several candles form small body indicates consolidation price, RSI level shows level 64 above SMA line indicates uptrend near overbought zone level.

t75Ls7WR.png
 
Hello everyone, have a nice day, maybe the day is not always good, but life must go on. When failing yesterday just move on and start a new journey.

XTIUSD or Oil WTI price drops to level price 98.92 at the moment, the price heavily drops and cross support zone 100. According to an analyst, oil drops because fear of recession grows amid supply chain risk and prospects of demand oil destruction.

On another side, China take advantage of the situation, they buy as much as possible oil to Russia although this country get Western sanctions China is not included, this country still has relation to Russia

Daily timeframe now below MA line and near lower band line, while RSI level 35 indicates downtrend near oversold zone level.

H1 timeframe, the price now above MA line indicates uptrend based indicator and timeframe, while RSI level 32 get out from oversold zone level, based RSI signal reversal to bullish on this timeframe.

X3oNPIKd.png
 
Hello everyone, have a nice day, we hope all traders' members' FPA forum will be profitable.

XTIUSD price is now 95.67 still drop -0.04% based FXOpen chart in Tradingview. Yesterday's high a level price of 100.03 and the low was 93.16.

Oil demand forecasting has been revised by Citigroup, they reduced demand forecast by a third, to between 2.4 million barrels per day and 2.5 million barrels per day. Citigroup expected the Oil price will trade in the range price $70 not $100.

Daily timeframe technical analysis, Oil price now moves at lower band and the line expands means there are increasing volatility. Oil prices is also still below the MA line indicates downtrend-based indicator. While the RSI level shows 33 below the SMA line indicates a downtrend near the oversold zone level.

H1 timeframe, the price still tends to downward and moves at the MA line means in consolidating, While the price moves between the lower band and middle band, and RSI level 36 above SMA line, means in downtrend trying to push the price to up.

zHXhPH3P.png
 
Hello everyone, have a nice day, we hope all traders members in FPA forum will remain profitable.

Analysts said if Oil prices are in a bearish market because of fears of economic recession. In life, energy is most important, manufacturing company if they want to produce needs energy to do so. Vehicle to carry up the goods to delivery needs energy. When human growth is higher than energy production maybe will become a problem in the future.

There are certain rumors if The Fed is possible to increase interest rate hikes to combat inflation, this may be impacts the financial market including Oil prices.

Oil price is now still below 100, at the time of writing oil price is 99.75 based XTIUSD chart FXOpen in Tradingview. Oil price trying to enter Bollinger band zone level after the previous break the line.Resistance line based MA on 103 and near support 95.55 based lower band.

22j97EPc.png
 
Hello everyone, the forex market opens again on Monday, hope all traders members FPA forum will be profitable.

XTIUSD price is now 101.60, the price has already crossed the crucial level of 100, and now the price is near Moving Average 9. The MA line still slopes down means based theory of the downtrend market. But RSI line above SMA indicates the current uptrend.

News about energy, UK will develop a variety of nuclear power to solidity energy in the future. While Putin predicts catastrophic consequences for the global energy market. While Kazakhstan looking to diversify oil export away from Russia.

XTIUSD daily chart, now shows the price trying to head up and now near the MA line. MA may act as dynamic resistance on a downtrend market. But when breakout possible reversal will be long term. While the price is away from the lower band the next target at the middle band line. And RSI level shows 42 indicates a downtrend but the line above the SMA line means the price trying to push up.

H1 timeframe the price below MA line and above the middle band line, Bollinger band narrow as low volatility on this timeframe, while RSI level shows 58 below SMA line means on an uptrend the price trying to push down.

pKmeVUW4.png
 
Back
Top