XTIUSD price analysis

fxoday

Recruit
Messages
884
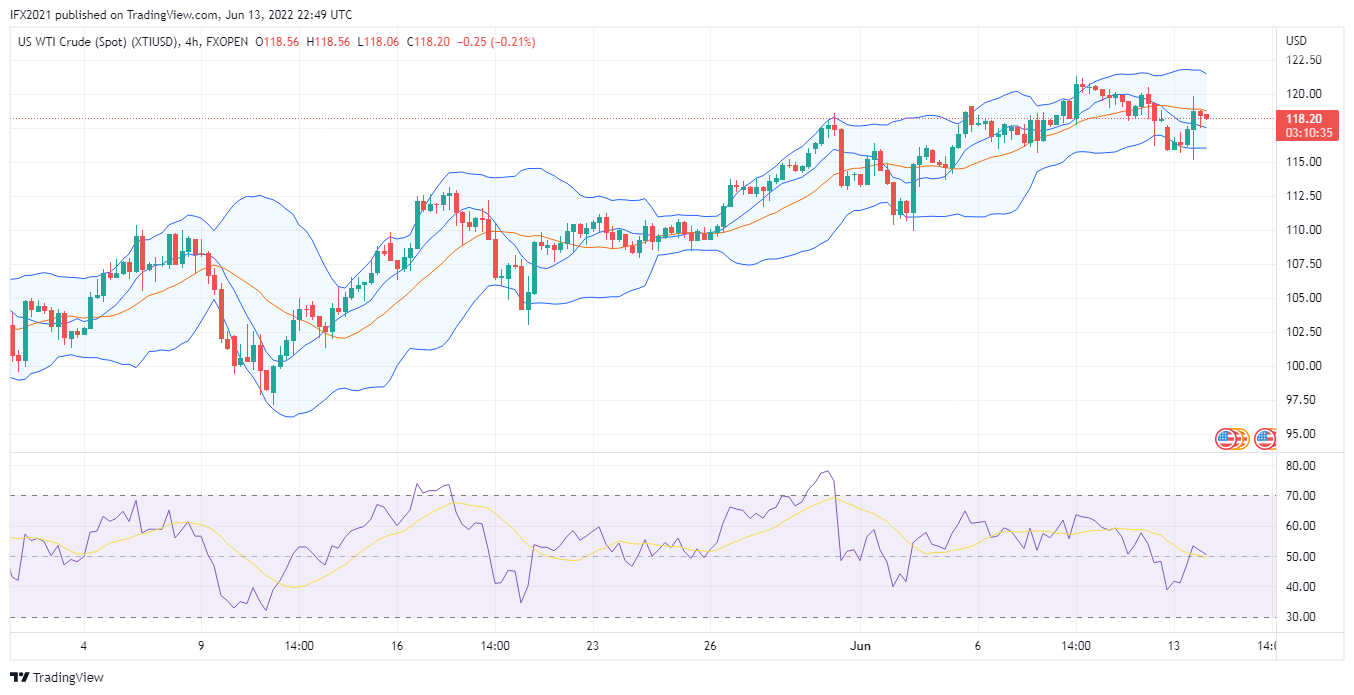
Hello everyone, this is my first thread here, in this thread, I will share my opinion and analysis tied to XTIUSD or Oil price, I am using the chart from FXOpen in Tradingview because I am now trading with this broker. I am sorry maybe this is not a pure analysis or prediction, maybe only a comment about the price of oil and its changes daily.

This thread also opens for everyone to share their thought about Oil prices, maybe we can learn together. thanks to the FPA admin.

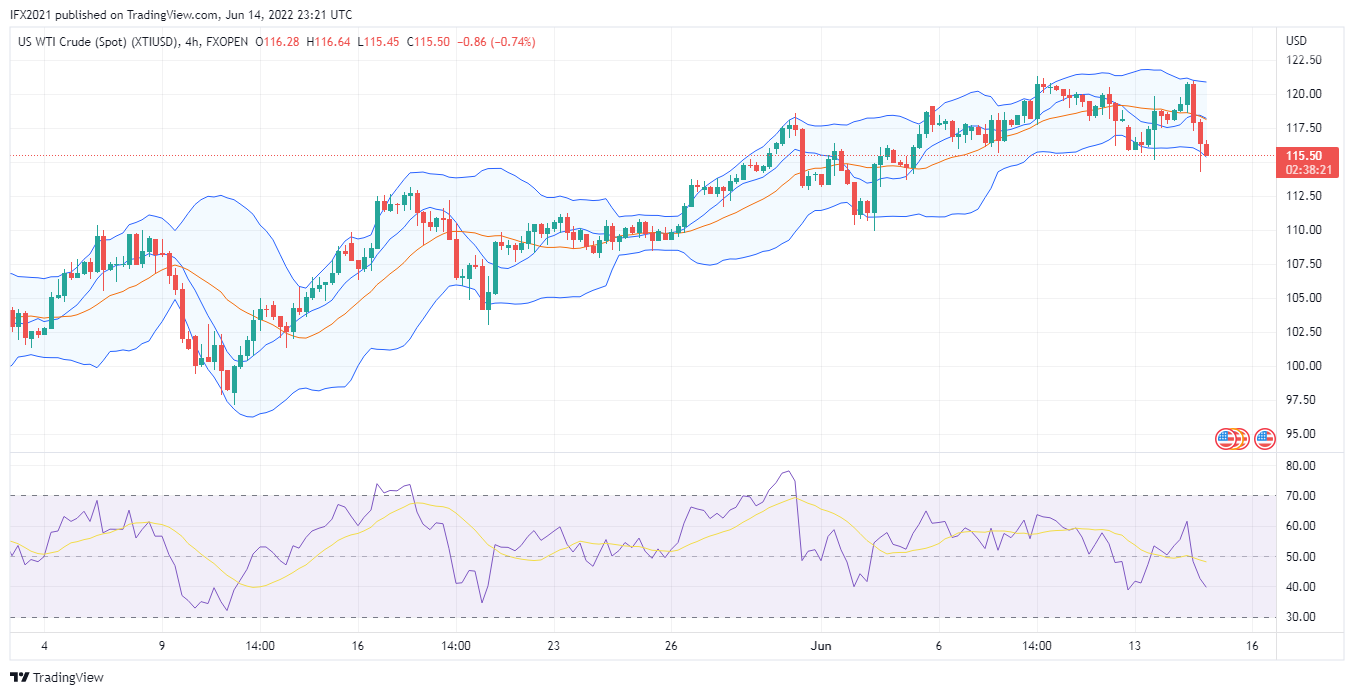
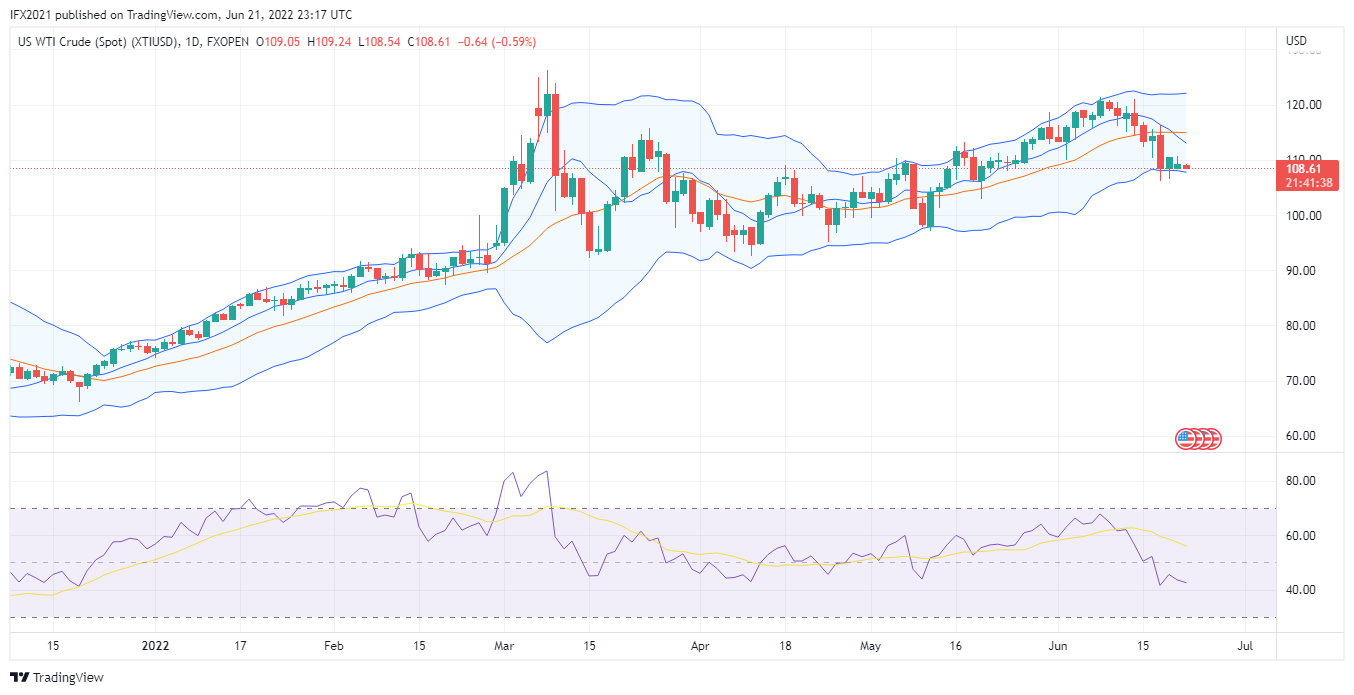
XTIUSD price is now 118.20, possible support 115.36, resistance 121.54

5WtgBqAp.png
 
Good morning traders, wish all get luck today.

Oil price drops to 115.51 now, the price in H4 timeframe shows break a lower band, my previous support breakout, BB line expanded, based Daily timeframe, price now near middle band line, but already crosses MA line, probably price will consolidate here.

m66AS4ui.png
 
Good morning traders wish all will make a profit today.

Oil prices continue to decline now price at 113.75, the price crosses 115 level and continues to drop. H4 shows the price break lower band and BB line expanded. Daily timeframe price below MA and crosses middle band, the possible price support may be at lower band line 108.

UfHqdDMJ.png
 
Great day all traders, wish all traders will become profitable.

Oil prices yesterday continue to decline and formed a low 110.30, but then the price bounced to 114.37 as the closing price, now the price is 114.21 -0.14%.

4H timeframe oil price below the middle band and above MA line, last two candle form bears candle indicates reversal pattern, while RSI level 45 shows down market.

dtlx5vsi.png
 
Good morning all traders, wish all will get lucky in today's market.

The oil price is now 108/74, it drop -by 0.25% today, in my view, the support zone level already touched based Bollinger band indicator daily timeframe, the last candle with a long body indicates the price drops heavily. It will be the next question, will oil price continue to drop and reach 97 as low as 11 May?

Everything is possible, just like simple words, the history repeats itself, however, to bring the price drop to its level, I think needs a bigger volume in the market for the selling price. While based RSI level now 39 still not yet reach the oversold zone level.

In the hourly timeframe we get a different view, after the price drops heavily, now the time consolidation phase on the price, it is formed retracement or reversal pattern still be questionable. Just in simple theory can be used, if price break low, probably continuation trend will be.

4pRW0Y0T.png
 
Good morning all traders, wish all will become profitable today.

Oil price now at 108.40 drops -1.86%, compare to yesterday price, now still move on the previous trading range,, yesterday low 106.48 still higher low compare the previous candle. means not yet breakout

XTIUSD is now in a consolidation phase, H4 formed a trading range between 110.83 and 106.48 as low, in the daily timeframe the price move at lower band zone level, its act like as resistance.

4kXRxUqw.png
 
Good morning traders, wish all will be profitable today.

XTIUSD price now 108.61 drops -0.59%, the price still move on the low trading range, yesterday form high 110.78 and low 108.40.

In the daily timeframe, oil price consolidates at the lower band zone level, this becomes a consideration where BB often acts as a belt of price, possible reversal after the consolidation phase has ended. However, we still, need to keep an on eye the market price. RSI level show 41 not yet indicating an oversold zone level.

zJNdlACJ.png
 
Good morning all traders, wish you all will be profitable today.

Now XTIUSD price shows 103.6, eventually the price break low and formed new low again.

We can see on a daily timeframe the price break lower band and the Bollinger band line start to expand. Yesterday's low was 101.13, while the RSI value was 35 near the oversold zone level. Possible support near 97 level price.

Hourly timeframe, the price below MA line but MA line slope up, means downtrend market price trying to head uprising, while BB line narrowed as decrease volatility, support. RSI level 36 indicates a downtrend.

1r70cgKA.png
 
Hello all traders, wish today all will be profitable in all trades.

XTIUSD price-based FXOpen chart now shows the price 103.53, the price rise 0.24%, Oil price still unable to break low 101.13, now the price still in a consolidation phase, there are lower volume occurs currently.

In the daily timeframe, we can see the price break lower band days ago, and lead the price outside the lower band line, the possible support target is still 97, if likely the price break low, however, RSI is now level 33 near the oversold zone level maybe need to become a consideration.

The timeframe hourly the price now below the MA line and Bollinger band narrow as decrease volatility, where the price movement between the middle band and lower band in narrow range price. RSI 44 indicates the downtrend.

JGSimOsG.png
 
Hello all trader members FPA beloved forum, wish all will be profitable today.

XTIUSD price now 105.20 drop -0.86% from opening price today, Oil price still move on lower band zone, but there are buying pressure-formed bulls candle, although possible on this zone possible reversal, however, news related Oil price still less good because economic condition maybe can impact to the Oil price. Growing economic uncertainty may lead to diesel consumption plummeting this year. recession issue maybe also impact to the Oil prices.

Daily timeframe XTIUSD shows the price still below MA line indicates downtrend and price move between the middle band and lower band, RSI level 37 shows the price downtrend not yet enter oversold zone level.

While looking out the Hourly timeframe the price is below the MA line and near the middle band line, the price trying to cross the middle band now, but still low trading volume, and a possible support-based BB line is 102. while RSI is now 50 levels indicating a neutral position.

ZyJOYnma.png
 
Back
Top