fxoday
Recruit
- Messages
- 884
Hello everyone, have a nice day, I wish all traders and members in the FPA community will become a successful traders.
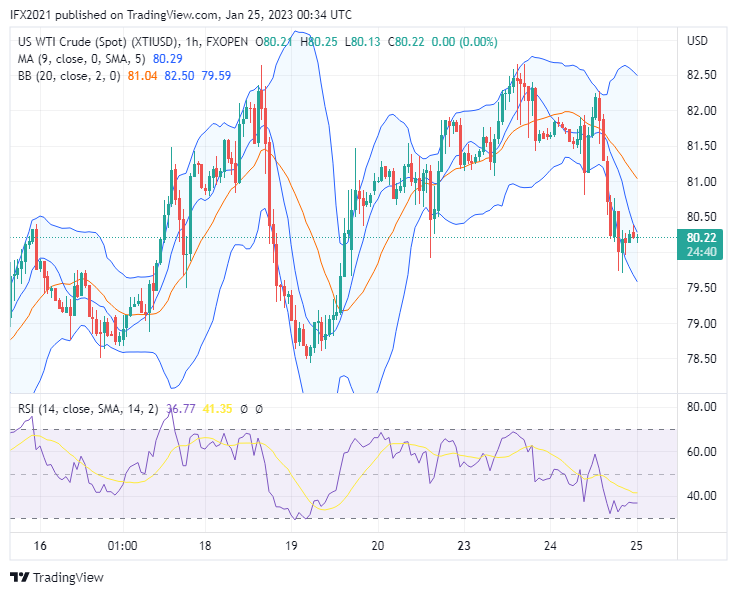
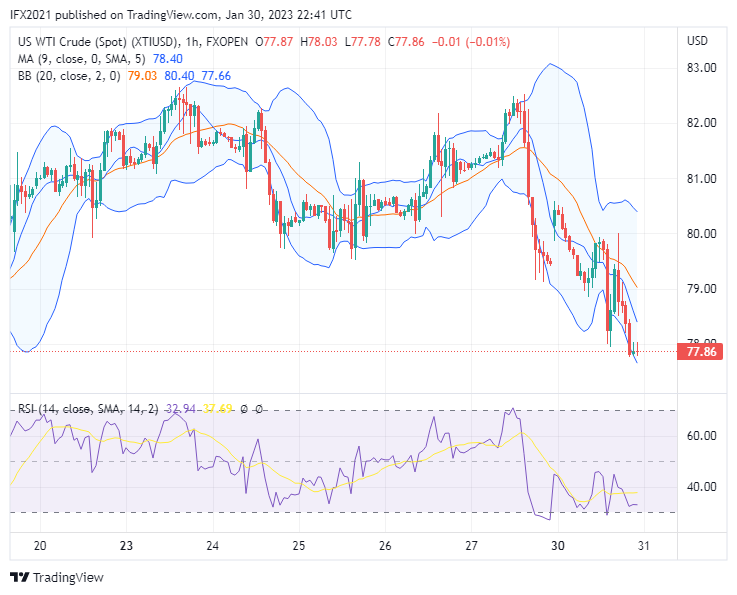
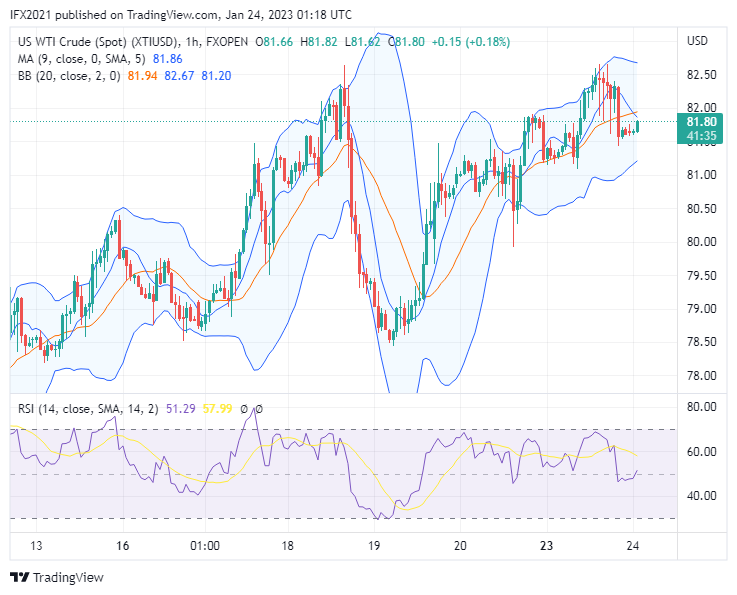
Oil price today still traded near 81 level price, at the time of writing the oil price is 81.80 based XTIUSD chart FXOpen in Tradingview.
News today citing to oilprice, US Gasoline prices continue to climb, Gasoline prices are up 11.8 cents over a week ago. Gasoline prices are rising along with the rise in WTI crude oil prices, which are up $3 per barrel from a week ago.
XTIUSD Technical analysis
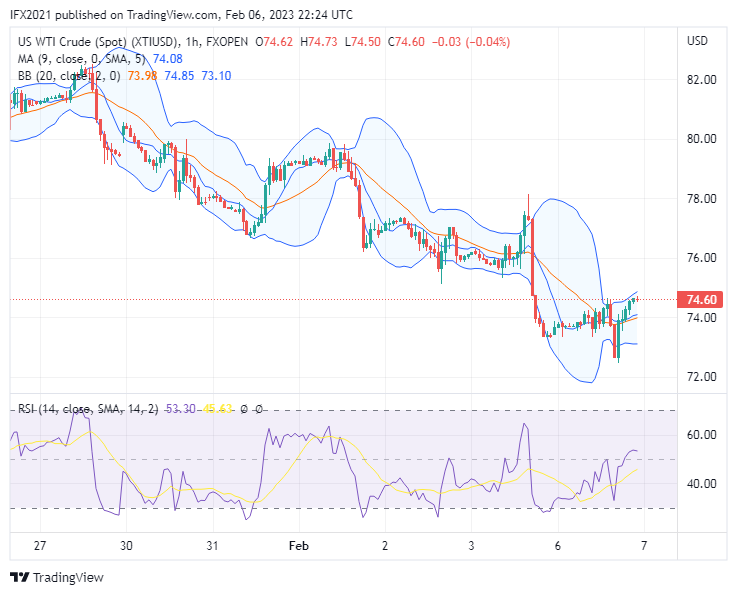
Oil price in yesterday's market formed a small bearish candle, the oil price still traded in the trading range between 82 and 80 level prices.
In the daily timeframe Oil price now still move below the upper band line above middle band line and the moving average. Here Bollinger band draws a small expanding line indicating a small increase in volatility. While RSI shows level 55 which means the price is above the uptrend zone level.
In the hourly timeframe, we can see the Oil price move below middle band line and the moving average above the lower band line. In this timeframe, the Bollinger band draws to narrow indicating lower volatility may occur. In the last candle, oil price tries to reach the middle band line indicating buying pressure trying to shift the price up. RSI indicator shows level 51 indicating the price is above the uptrend zone level.
FXO Markets Ltd Disclaimer: CFDs are complex instruments and come with a high risk of losing your money.
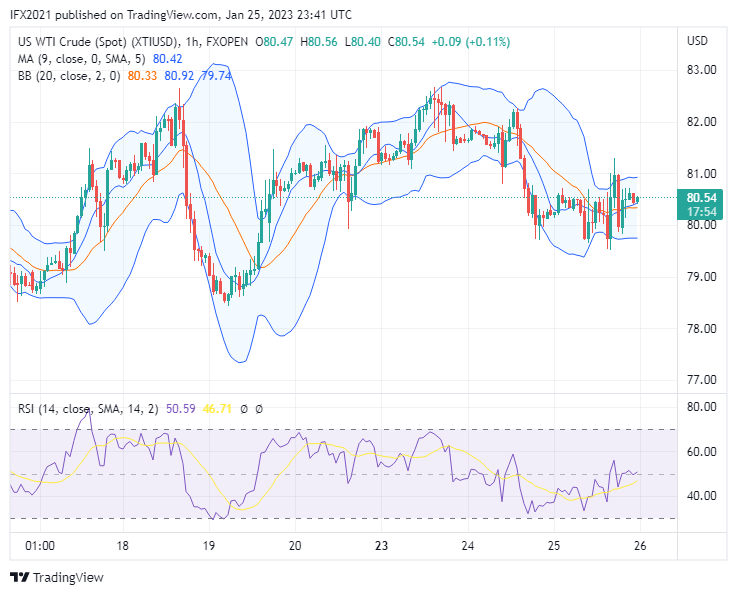
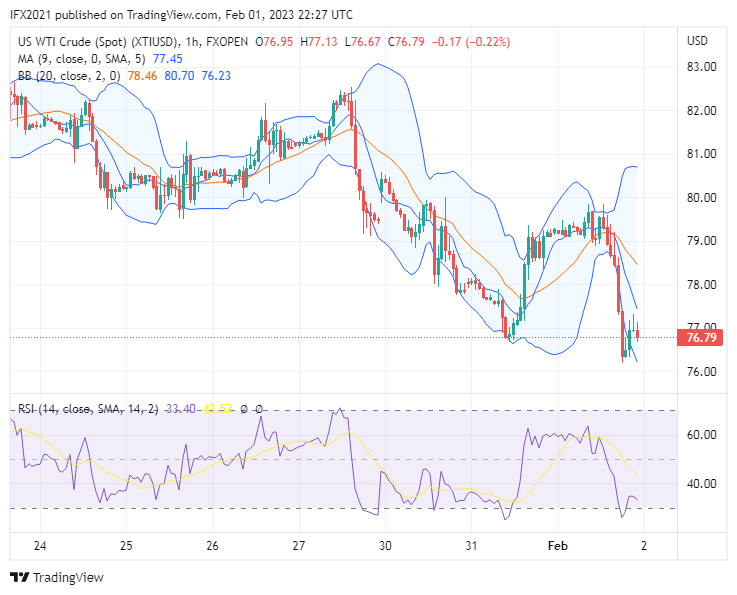
Oil price today still traded near 81 level price, at the time of writing the oil price is 81.80 based XTIUSD chart FXOpen in Tradingview.
News today citing to oilprice, US Gasoline prices continue to climb, Gasoline prices are up 11.8 cents over a week ago. Gasoline prices are rising along with the rise in WTI crude oil prices, which are up $3 per barrel from a week ago.
XTIUSD Technical analysis
Oil price in yesterday's market formed a small bearish candle, the oil price still traded in the trading range between 82 and 80 level prices.
In the daily timeframe Oil price now still move below the upper band line above middle band line and the moving average. Here Bollinger band draws a small expanding line indicating a small increase in volatility. While RSI shows level 55 which means the price is above the uptrend zone level.
In the hourly timeframe, we can see the Oil price move below middle band line and the moving average above the lower band line. In this timeframe, the Bollinger band draws to narrow indicating lower volatility may occur. In the last candle, oil price tries to reach the middle band line indicating buying pressure trying to shift the price up. RSI indicator shows level 51 indicating the price is above the uptrend zone level.
FXO Markets Ltd Disclaimer: CFDs are complex instruments and come with a high risk of losing your money.