Part II. Trend Lines

Commander in Pips: Today we will talk about trend lines.
Pipruit: This is something like trends in haute couture?
Commander in Pips: Almost, but not quite. A trend line is a very useful and simple tool, but due to misleading application this nice tool is underrated by traders. Trend lines could be quite accurate and provide great assistance in trading.
In fact trend lines are look similar to support and resistance lines, but usually used during directional move of the market – up or down. Other words speaking – trend lines have some slope, although there are horizontal trend lines that exist also. It is simpler to understand, when you will see it.
There are three major types of trend lines:
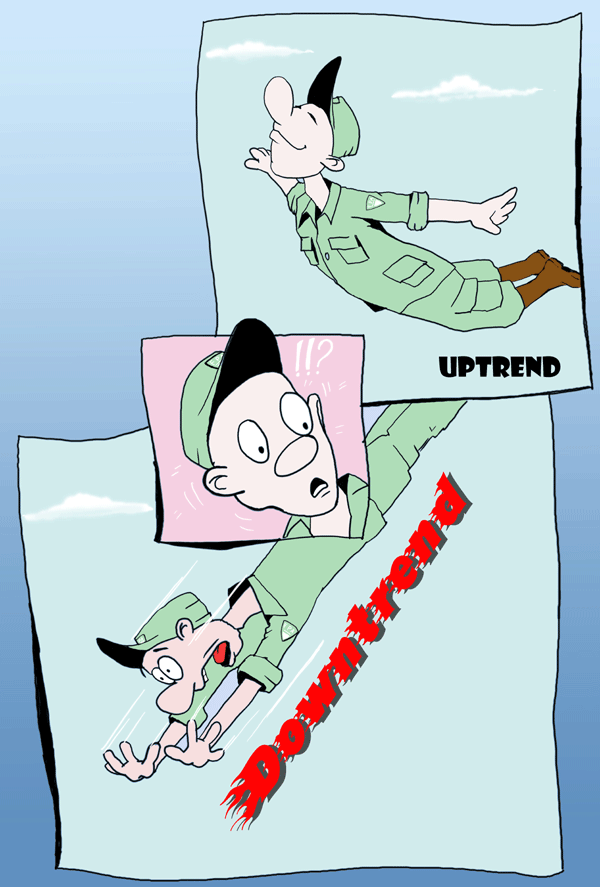
1. Upward trend line - uptrend;
2. Downward trend line - downtrend;
3. Horizontal trend line – Sideways trend.
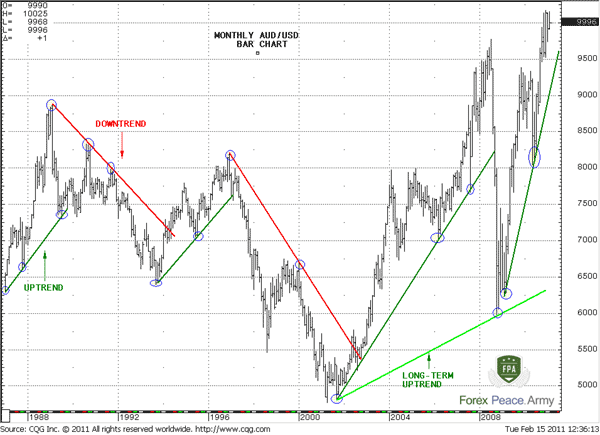
As an example, here is the monthly chart (1 bar stands for 1 month) of AUD/USD. Here you can see uptrend lines (green) and downtrend lines (red)
UPTREND
An uptrend line suggests appearing of higher lows from price movement – take a look at any upward trend line (green), the second low and others lows are always higher, than the previous one. It always draws and stands below the price action. This line is some kind of support line that we’ve talked about in previous chapter, but with an upward slope. To draw an uptrend line you need to link well-recognizable lows or support areas. Just find two major bottoms and connect them with line. So, you’ve got your upward trend line!
DOWNTREND
A downtrend line suggests the appearing of lower highs from price movement – take a look at any downward trend line, the second high always lower, than the first one. It always draws and stands above the price action. This line is some kind of resistance line that we’ve talked about in previous chapter, but with downward slope. To draw a downtrend line you need to link well-recognizable highs or resistance areas. Just find two major tops and connect them with line. So, you’ve got your downward trend line!
SIDEWAYS TREND
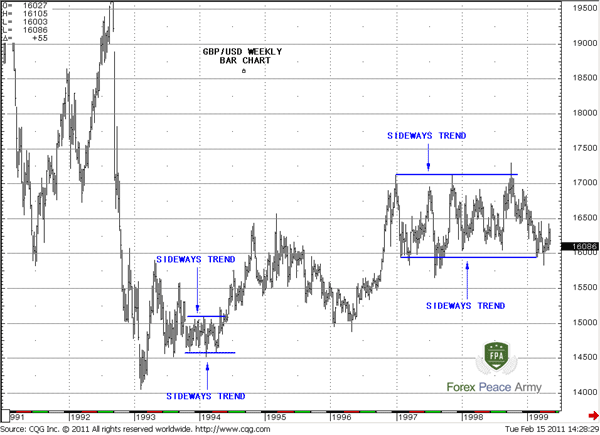
This is a bit specific price action and word “Trend” itself is not very suitable for this purpose, because trend suggests some acceleration to upside or downside – as we said either higher lows (upside acceleration) or lower highs (downside acceleration), but particularly this feature absents in sideways move. Usually this kind of price action named as “Consolidation” or “Ranging”. There is a well known proverb exists about it – “The market is in consolidation until it’s not”. As you can see from following picture, building trend line with the rules that we’ve just shown above, gives us the lines that look very similar to support and resistance, because the difference between as highs as lows is very shallow. But they are not the same – to build support or resistance area you need just one point. For any trend line you need two points – look at the picture:
Properties of trend lines
1. You need at least two points to draw any trend line;
2. The steeper trend line the less reliable it is, and the more probable that it will break sooner rather than later;
3. You should never adapt a trend line to market behavior. If the trend line does not fit, then it is just not reliable and inappropriate – do not force it.
Other rules are almost the same as with support/resistance lines, so let’s just briefly name them:
1. Trend lines is also not a particular number, but some area around the line;
2. Close price and 3-period rule also could be applied for determination of breakout of trend line. For instance, if market has closed below/above uptrend/downtrend and holds there at least for 3 periods, then, possibly this line is broken.
3. Stop-licking or breakout failure pattern also could happen with trend lines as with support/resistance.
4. The market could lightly penetrate trend lines, and if it has not closed below it, then possibly the trend line is still valid.
5. After a breakout, the market can retest the broken trend line from the other side. Sometimes this price action is called a “Kiss goodbye”
6. The longer a trend line is forming, the stronger the move could be after breakout from this trend line.
7. Trend lines and support/resistance lines are not the same. To estimate support/resistance level will be sufficient even one point. To draw trend line, even sideways, you need at least two points for determination of slope angle.
8. Longer term trend lines overrule shorter term ones. It means that if in some point meet trend lines with opposite direction, there is a higher probability that longer term line will break the shorter-term.
9. There is no rule, concerning the strength of trend line, as it is for support/resistance lines, because trend line has a slope and its level changes as trading period passes. There is an opinion still, that trend line becomes stronger with time, but I can’t confirm it. Because from the one side – the more obvious the trend line (i.e. the longer it holds in time), the more traders open position in direction of this trend when market touches it, and hence, add support to this line. But from the other side, more and more trailing stops are accumulated below this trend line. As it becomes more and more obvious, then the stronger the temptation for market makers to press the trend line a bit and trigger these stop orders.
ADVANCED TALKS ABOUT TREND LINES
Pipruit: Thanks Commander, that’s very useful information, but I still find some confusing moments. First, take a look at the chart below – this is the same chart that you used for explanation of sideways trend lines:
Pipruit: Well, I don’t know, I do not trade yet. But I suspect that I would like to get profit quicker.
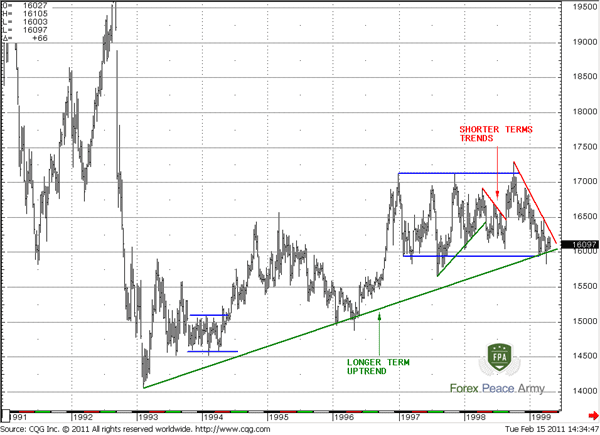
Commander in Pips: I understand. Now take a look at small red trend line. You can see that as to left as to the right from the tops, that are used for drawing this line, there are higher tops exist. So this line is not so long-term…
Pipruit: Wait a minute, I see. It all depends on my trading time-frame. If I short term trader – I will use current short-term trades and will not deal with huge trend lines that are far above or below current market. Because when I close my position that is based on short-term trend line – it will happen well in advance of market reaching of this long-term trend line. In fact, this long-term trend line will not affect me anyway.
Commander in Pips: That’s right – you should use trend lines in a row with your time-frame, other words those trend lines that affect or could affect your position in nearest perspective. But you should not ignore long-term trends either. Just look at the last bear trend line on the picture – see – it bears against the long-term bull line. Now imagine that you have bear position due this short-term downtrend line and know nothing about strong support due to long-term uptrend that is on the way of your trade. This will be a great upset for you, when market will bounce against you, when it will touch this uptrend.
Commander in Pips: Yes, you should estimate the approximate time of holding your position. Then you easily will see what trend lines could potentially affect on your trade. But you must pay attention to the longer picture also.
Commander in Pips: Hmm, all of them are valid at the time when they were created. But currently all of them have been broken by market.
Commander in Pips: Hmm, all of them are valid at the time when they were created. But currently all of them have been broken by market.
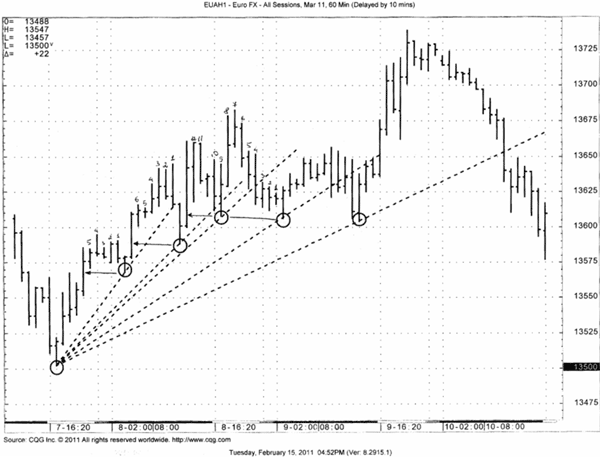
Commander in Pips: I think that using extremes is more correct – lows for uptrend and highs for downtrend. Also there is an opinion that the more recent points have more importance, than the previous ones. Other words, you should build trend from the tail, rather then from the head.
Also, if you don’t mind, I have added some markings on your chart. This numbers numerate bars that have higher lows to the left side from the bar that you have chosen as a point for trend line building. As you can see, some bars have only 5-10 bars, but if you will take the first circle and the last one – they have much more bars. Hence the trend line that is formed by these points is stronger and more long-term than the others.
Tom DeMark has made an excellent work with building a trend lines. He said that you may choose the time level of trend line by yourself. He draws trends by extreme points - uses low prices for uptrend and highs for downtrend. Then he determines how much bars with higher lows to the left and right sides from current local bar low that we have chosen as a point for trend line. The shortest lines have only 1-3 bars to the right and to the left with higher lows. If, for example, current particular low is absolute low for 50-100 bars to the left as to the right – this is long-term trend line, because points that are used for its building are long-term absolute extremes. Look at last color chart again. See – points that are chosen for long-term uptrend building are absolute extreme lows for a long time. Each point is absolute low at least for 3 years (about 200 bars from each side on weekly chart!) to the right and to the left. The short red line that you have chosen has just about 10-20 bars from each point that is used for drawing the line, so it’s much shorter-term.
Commander in Pips: No, you don’t have to. This is just one method. You must do only one thing - try and experiment with different approaches. You should use the way that will give you acceptable results. I just give you different possibilities that are used on the market by different traders. Also I give you some tools, that should help to make this process as mechanical as possible – The Tomas DeMark way of building trend lines is just one of them. But who knows which approach will work better? You should investigate this by yourself. This is a part of trader’s routine.
Commander in Pips: That’s right – you should use trend lines in a row with your time-frame, other words those trend lines that affect or could affect your position in nearest perspective. But you should not ignore long-term trends either. Just look at the last bear trend line on the picture – see – it bears against the long-term bull line. Now imagine that you have bear position due this short-term downtrend line and know nothing about strong support due to long-term uptrend that is on the way of your trade. This will be a great upset for you, when market will bounce against you, when it will touch this uptrend.
Pipruit: Wow, I understand. Although we should use trend lines that are in a row with our trades – we also have to know where we are in a big picture and to note significant support/resistance levels that could appear in the way of our position in nearest perspective from larger time frames.
Commander in Pips: Yes, you should estimate the approximate time of holding your position. Then you easily will see what trend lines could potentially affect on your trade. But you must pay attention to the longer picture also.
Pipruit: Now, I have another question, look at the picture - which trend is valid?
Pipruit: But which one I should to use for trading and how to build them, what price use – close or lows for uptrend, close or highs for downtrend?
Commander in Pips: I think that using extremes is more correct – lows for uptrend and highs for downtrend. Also there is an opinion that the more recent points have more importance, than the previous ones. Other words, you should build trend from the tail, rather then from the head.
Also, if you don’t mind, I have added some markings on your chart. This numbers numerate bars that have higher lows to the left side from the bar that you have chosen as a point for trend line building. As you can see, some bars have only 5-10 bars, but if you will take the first circle and the last one – they have much more bars. Hence the trend line that is formed by these points is stronger and more long-term than the others.
Tom DeMark has made an excellent work with building a trend lines. He said that you may choose the time level of trend line by yourself. He draws trends by extreme points - uses low prices for uptrend and highs for downtrend. Then he determines how much bars with higher lows to the left and right sides from current local bar low that we have chosen as a point for trend line. The shortest lines have only 1-3 bars to the right and to the left with higher lows. If, for example, current particular low is absolute low for 50-100 bars to the left as to the right – this is long-term trend line, because points that are used for its building are long-term absolute extremes. Look at last color chart again. See – points that are chosen for long-term uptrend building are absolute extreme lows for a long time. Each point is absolute low at least for 3 years (about 200 bars from each side on weekly chart!) to the right and to the left. The short red line that you have chosen has just about 10-20 bars from each point that is used for drawing the line, so it’s much shorter-term.
Pipruit: Ok, I understand, so I have to draw trend lines from the tails and strictly use extreme points, not close price for their drawing?
Commander in Pips: No, you don’t have to. This is just one method. You must do only one thing - try and experiment with different approaches. You should use the way that will give you acceptable results. I just give you different possibilities that are used on the market by different traders. Also I give you some tools, that should help to make this process as mechanical as possible – The Tomas DeMark way of building trend lines is just one of them. But who knows which approach will work better? You should investigate this by yourself. This is a part of trader’s routine.
Pipruit: I see. Something else, Commander?
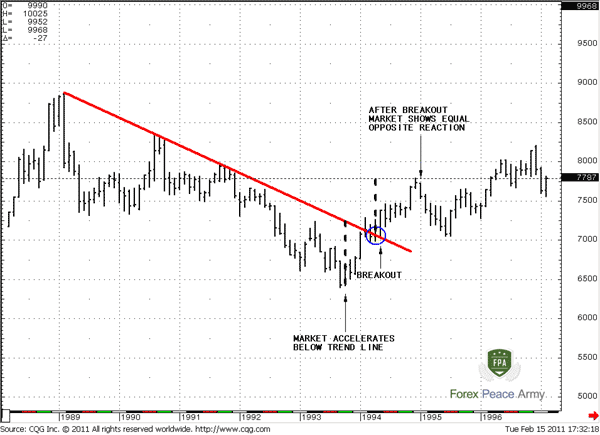
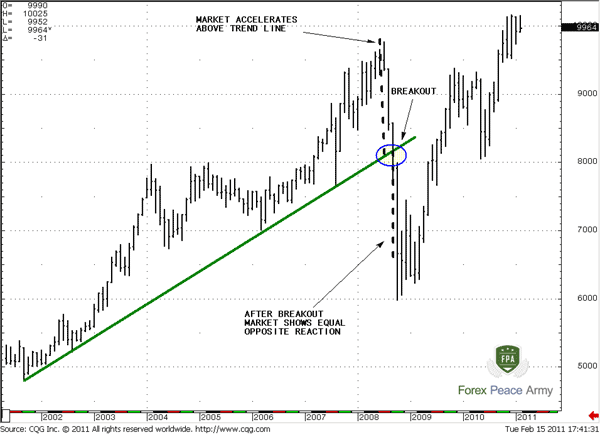
Commander in Pips: The last thing for today. Application of the rule – “The opposite reaction is equal to initial reaction”. what does it mean in a way of trend lines?
As you can see from many charts, a market very often accelerates faster than the trend line, but then returns to it. The rule is – the distance it deviates from the trend line is the same amount it will move in the opposite direction if there is breakout. Look at the next picture:
And here is another example:
And here is another example:
Commander in Pips: The last thing for today. Application of the rule – “The opposite reaction is equal to initial reaction”. what does it mean in a way of trend lines?
As you can see from many charts, a market very often accelerates faster than the trend line, but then returns to it. The rule is – the distance it deviates from the trend line is the same amount it will move in the opposite direction if there is breakout. Look at the next picture:
Pipruit: Cool! That is really important. I definitely should remember that…
Comments
T
TraderBob
12 years ago,
Registered user
Hey commander in pips, who has the best charting package. I use netdania and they seem ok. What do you use?

Sive Morten
12 years ago,
Registered user
> Hey commander in pips, who has the best charting package. I use netdania and they seem ok. What do you use?
Hi TraderBob.
I use CQG.
Your question what software is best, probably better to split on two:
1. How accurate data is;
2. Does software have all neccesary tools, that you need for trading.
I use DiNapoli approach to technical analysis. So, I need his total tools trading pack.
Don't pay much attention to what I use, because my employee pays for it.
Although CQG has most accurate data (DiNapoli itself uses it), along with Reuters and Bloomberg, its rather expensive.
But there are few software programs, that provide access to DiNapoli proprietary indicators pack. CQG is the best in this term.
CQG in fact, was born for technical analysis. Just for information, I can tell, that it has DeMark pack and Elliot wave or, say, point and figure charts. Its automatically marks waves on the chart. I do not see such tools nowhere else.
Still, MT4 is not bad also - although it has not all that I need - it has MQL language for programming.
Conclusion - I use mostly CQG and MT 4 sometimes.
P
PatrykM
10 years ago,
Registered user
Hi Sive,
What is a extreme points where it is ?
What is a extreme points where it is ?
Sive Morten
10 years ago,
Registered user
> Hi Sive,
What is a extreme points where it is ?
Extreme points are lows or highs that were formed by price. These points you link when you draw a trend line. Higher lows if trend goes up and lower highs if trend goes down - donward trend line always has to be drawn by tops, while upward trend - by lows.
If you would like to know more you can read Demark book Technical analysis - new science. He has done excellent work with trend lines.
4
4xkishore
10 years ago,
Registered user
Hello Sive!
I am Jnanendra Kishore from India. You can call me Kishor, my surname. I want a permanent trainee job in forex. I want to "learn and earn" together hand in hand under you. I don't have any financial resources to open a live account. At the same time I need a real master who can train me and allow me to hone my forex trading skills. Will you allow me to "Learn and Earn" under your mastership? If yes, please write back to me asap.
I am Jnanendra Kishore from India. You can call me Kishor, my surname. I want a permanent trainee job in forex. I want to "learn and earn" together hand in hand under you. I don't have any financial resources to open a live account. At the same time I need a real master who can train me and allow me to hone my forex trading skills. Will you allow me to "Learn and Earn" under your mastership? If yes, please write back to me asap.
O
Olaoye
8 years ago,
Registered user
Gud sir, i trying to renew my forex with your forex military school and i raed someone asking you about trading pack.pls sir what is CQG tools trading pack.
pls i want to know more about it and knowledge about it.
thanks sir.
pls i want to know more about it and knowledge about it.
thanks sir.

Hamza Samiullah
7 years ago,
Registered user
Excellent Article ... Very informative...
A
anhkool
6 years ago,
Registered user
Hi, I wanted to ask a quick question. In up-trend if you have two prices level height A at £10 and height B at £10 which price level at this point you would validate as higher high for or higher low for height B.
K
kureja
5 years ago,
Registered user
Hi Sive,
there is a problem here in viewing trend line snapshots, i mean the example snapshots are not showing on the page only text can be read. is there any problem in the website or snapshots are removed?
thanks a lot
there is a problem here in viewing trend line snapshots, i mean the example snapshots are not showing on the page only text can be read. is there any problem in the website or snapshots are removed?
thanks a lot
K
kureja
5 years ago,
Registered user
> Hi Sive,
there is a problem here in viewing trend line snapshots, i mean the example snapshots are not showing on the page only text can be read. is there any problem in the website or snapshots are r..
Hi Sive,
Now its fine thanks a lot , all pics are shown
there is a problem here in viewing trend line snapshots, i mean the example snapshots are not showing on the page only text can be read. is there any problem in the website or snapshots are r..
Hi Sive,
Now its fine thanks a lot , all pics are shown
Table of Contents
- Introduction
- FOREX - What is it ?
- Why FOREX?
- The structure of the FOREX market
- Trading sessions
- Where does the money come from in FOREX?
- Different types of market analysis
- Chart types
- Support and Resistance
- Candlesticks – what are they?
- Mysterious Fibonacci
- Introduction to Moving Averages
- Bollinger Bands
- Leading and Lagging Indicators
- Basic chart patterns
- Pivot points – description and calculation
- Elliot Wave Theory
- Intro to Harmonic Patterns
- Divergence Intro
- Harmonic Approach to Recognizing a Trend Day
- Intro to Breakouts and Fakeouts
- Again about Fundamental Analysis
- Cross Pair – What the Beast is That?
- Multiple Time Frame Intro
- Market Sentiment and COT report
- Dealing with the News
- Let's Start with Carry
- Let’s Meet with Dollar Index
- Intermarket Analysis - Commodities
- Trading Plan Framework – Common Thoughts
- A Bit More About Personality
- Mechanical Trading System Intro
- Tracking Your Performance
- Risk Management Framework
- A Bit More About Leverage
- Why Do We Need Stop-Loss Orders?
- Scaling of Position
- Intramarket Correlations
- Some Talk About Brokers
- Forex Scam - Money Managers
- Graduation!