Triangle patterns and how to trade them

Triangles are common patterns that come up on the charts when the price is moving in a contracting range. Within those patterns, the price moves in shorter and shorter waves. Triangles are a sign that volatility in the market is declining. They are also considered as a corrective phase in the market and usually come after a phase of steep decline or strong upward move. In triangles, the market is resting, usually after a strong move.
Identifying triangle patterns
One way to identify triangle patterns is to draw trend lines by using the previous tops and bottoms of previous price swings and then identify patterns where the upper and lower trend lines seem to be converging (or pointing towards one another). The price moves up and down within those two lines.
Types of triangles
There are mainly three types of triangles: the ascending triangle, the descending triangle, and the symmetrical triangle. Additionally, wedge patterns can also be considered triangular patterns but with a slight variation. In wedges, both trend lines are pointing either downwards or upwards and seem to be converging.
First: the ascending triangle:
The ascending triangle is characterized by a horizontal resistance line (upper line), and a support line (lower trend line) that has a positive slope. In this triangle, every time the price reaches a certain level, the sellers reappear and push the price back down. However, despite this, the price also seems to be making higher lows as buyers push the price higher every time it declines. This triangle is called a descending triangle because of those higher lows. In this pattern, the buyers are managing to take control of the market but gradually rather than decisively. In this kind of market, the wise choice would be to prioritize a long position, although a confirmation signal would be needed.
Second: the descending triangle
The descending triangle is a triangular pattern that often appears after a downtrend. In this pattern, the price reacts to a certain support level every time it approaches it going downwards. This forms a horizontal support line (lower trend line) which indicates that buyers are coming back every time the price reaches a certain level. Yet, sellers also react when the price moves higher, and they push the price lower. The reactions by the sellers form a negative-sloping trend line or a series of lower highs. The descending triangle pattern shows that there is slightly more selling interest than buying interest in the instrument. In this market, a short position should be favored, although this pattern is not enough on its own to open a trade.
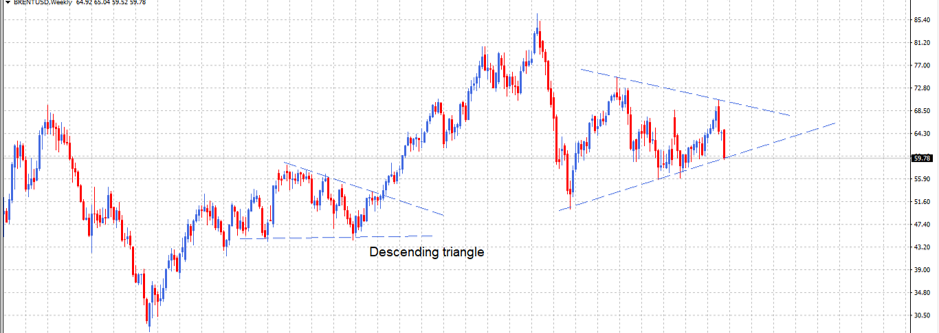
The above chart shows a descending triangle. This is the Brent oil chart, and it is clear that the price tried to breach the lower line many times but failed to do so. Also, sellers managed to keep the price at bay without giving it a chance to move up strongly, until the price eventually broke out. After the breakout, the price continued its previous trend, which was an uptrend. The price then moved and reached high price levels at 85 USD per barrel. The same chart also shows another triangle pattern which is the symmetrical triangle.
Third: the symmetrical triangle
In the symmetrical triangle, the battle between the bears and the bulls seems to be even. No side is able to pull a victory just yet. The buyers push back every time the price declines, and the sellers react every time the price moves up. As a result, the price seems to be getting squeezed between two converging lines. This price movement pattern can follow an uptrend or a downtrend. Traders often consider the triangle as a continuation pattern. That is, they expect the direction of the trend that preceded the pattern to continue after the triangle is complete.

In the above chart, which is for the GBPNZD currency pair, the price moved within a triangle in the 4h timeframe. The price kept making higher lows and lower highs until it broke out of the pattern. The two lines eventually meet at one point, and they both have a slope (one negative, and the other positive). This is a good example of a symmetrical triangle.
The above mentioned three types of triangles are all variations of the same thing. And typically, in a triangle, the price should touch the support line and the resistance line two times at least, each. This is an important step to ensure that the lines are meaningful.
Wedges as a variation of triangles
In addition to the above types, there are other forms of triangles. As mentioned earlier, wedges can be considered as triangles or similar to them. Wedges can be ascending or descending. Wedges form when the upper trend line and the lower trend line are both pointing upwards and the price movement range is contracting. In such a case, the pattern is called an ascending wedge. When the upper trend line and the lower trend line are both pointing downwards and the price movement range is contracting, the pattern is called a descending wedge.
Strategies to trade triangular patterns
Given that triangles are considered areas of market consolidation, traders usually wait for the price to break out of the triangular pattern to enter (or exit) a trade. The breakout indicates that either buyers or sellers have managed to take over the market.
Regardless of whether the shape is a triangle or a wedge, trading it is pretty much the same. The first step before entering a trade would be confirming the pattern and that the trend lines drawn on the top and bottom of the triangular pattern are meaningful. This is done by confirming that each of those lines touches at least 3 tops or bottoms. The second step would be placing a stop or a limit entry order above or below one or both of the trend lines. This risk here is that you may be caught in a false breakout.
Triangles as continuation and reversal patterns
Traders often expect the market to continue the trend after corrective patterns. However, this does not happen all the time. Triangle formations can also be reversal patterns in certain cases. To identify whether the pattern is a continuation or a reversal one, we need to shed some light on Elliot wave theory.
Considering the most basic form of Elliot wave theory, where the price moves in a sequence of waves, triangles often appear in the second or the fourth wave. In Elliot wave theory, both the second and fourth waves are corrective patterns. The first, third, and fifth waves are impulsive waves, in which the price moves strongly in one direction. In the impulse waves, the market is very much one-sided, whereas in the corrective waves, the market is often two-sided.
Simply put, if the triangle shows in the second or fourth waves of the sequence, then it’s likely a continuation pattern. If it shows in the fifth wave, it’s likely a reversal pattern. The fifth wave is usually an impulsive wave, but sometimes a corrective pattern appears in it. This confirms that this is a reversal pattern, and the price will likely retrace earlier moves or at least a percentage of those moves.
In such a case when a triangle is a reversal pattern, it typically comes at the end of a downtrend or an uptrend. In an uptrend, it often appears as an ascending wedge. In a downtrend, it often appears as a descending wedge. Traders would be wise to see how the price action develops before placing a trade. Otherwise, traders can place a limit or a stop order under one (or both) of the trend lines to enter a trade. This can be a good strategy.
Using the triangle as a stop loss guide
Experienced traders usually wait for the price to break out from either side of the triangle as a confirmation signal. They can use the bottom of the triangle as a stop loss level if they are entering a long position, and they can use the top of the triangle as a stop loss level if they are entering a short position.
Not all price movements out of the triangle are breakouts
Although it may be a good strategy to wait for the price to break out of a triangle to enter a trade, this may not always produce favorable results. The triangle is mainly made of the support and resistance lines, which eventually meet at some point. As a result, the price will eventually exit the triangle at some point, and it may not be a decisive breakout. This happens simply because the price went out of range to move in. This can pose a risk to those who trade the breakout strategy on triangles. They need to be aware and distinguish between a decisive breakout and a false one. Traders can make sure that the breakout is decisive by checking indicators such as the volume (in stocks), as it should be a high volume driving the breakout candle to show that one side has prevailed in the market.
Trading within the triangle
Traders can choose to trade within the triangle instead of waiting for a breakout. However, this strategy may be riskier than the breakout strategy. In this strategy, the trader waits for the price to bounce off one of the trendlines and enter the trade. A bullish trade can be entered upon bouncing off the lower trend line, and a bearish trade can be entered upon bouncing off the upper trend line. The stop loss order should be typically placed above the trend line, in a bearish trade, or under the trendline in a bullish trade. The risk in this kind of strategy is the breakout risk. If the trader assumes that the price will continue moving within the triangle, and then the price breaks out, the trader’s stop loss order will be triggered.
In this kind of strategy, traders would do well to focus on higher time frames. That is, they can detect a triangular pattern on the daily chart for example and wait for the price to bounce off one of the trendlines in the same timeframe. Then, the trader can use the lower time frame such as the 4 hour or 1-hour time frame to find another confirmation signal and a good entry point. This can mitigate the risks to a certain extent, as the higher timeframes can offer better signals.
Conclusion
Triangle patterns appear often in the market and there are many variations of them. In essence, they represent a period during which the market is undecisive and resting. In triangles, both buyers and sellers are trying to move the price level in their favor, but none is able to overtake the market entirely.
Trading triangles is not hard, but it is important to draw the trend lines correctly and ensure that they are meaningful. This is done by ensuring that the price level is reacting to them in a consistent manner. Ensuring lines are drawn correctly is an important step as drawing them incorrectly could lead to costly mistakes.
Once the lines are drawn accurately, the traders can rely on them in forming a strategy. There are mainly two types of strategy: the first entails waiting for the price to break out, while the other entails trading within the triangle by riding one of the waves within it.
Both strategies are associated with their own risks. To mitigate the risks, do not prematurely assume which side of the market the price will break out of. Moreover, ensure that there is another confirmation signal besides the price movement in relation to the triangle. And last, beware of false breakouts and maintain an eye on the big picture (higher timeframes).
In addition to the above, and to protect your capital, do not forget about proper money management, and ensuring that the sizes you choose for your positions are compatible with your ability to tolerate risks. Otherwise, your hard-earned money will be wiped out quickly.
Author Profile

Fat Finger
My name is Phat Fin Ge, but most people just call me Fat Finger or Mr. Finger.
Many years ago, I was a trader on the Hong Kong Stock Exchange. I became so successful that my company moved me to their offices on Wall Street. The bull market was strong, but my trading gains always outperformed market averages, until that fateful day.
On October 28th, 1929, I tried to take some profits after Charles Whitney had propped up the prices of US Steel. I was trying to sell 10,000 shares, but my fat finger pressed an extra key twice. My sell order ended up being for 1,290,000 shares. Before I could tell anyone it was an error, everyone panicked and the whole market starting heading down. The next day was the biggest stock market crash ever. In early 1930, I was banned from trading for 85 years.
I went back to Hong Kong to work at my family's goldfish store. Please come and visit us at Phat Goldfish in Kowloon, only a 3 minute walk from the C2 MTR entrance.
I thought everyone would forget about me and planned to quietly return to trading in 2015. To my horror, any error in quantity or price which cause a problem kept getting blamed on Fat Finger, even when it was a mix up and not an extra key being pressed. For example, an error by a seller on the Tokyo Stock Exchange was to sell 610,000 shares at ¥6 instead of 6 shares at ¥610,000. That had nothing to do with me or with how fat the trader's finger was, but everyone kept yelling, "Fat Finger! Fat Finger!" In 2016, people blamed a fat finger for a 6% drop in the GBP. It really was a combination of many things, none to do with me or anyone else who had a wider than average finger.
Now that I can trade again, I'm finding forex more interesting than stocks. I've been doing some research on trading forex and other instruments and I'll be sharing it here.
If you see any typing errors, you can blame those on my fat finmgert. If you see any strange changes in price, it's not my fault.
Info
279 Views 0 CommentsComments
Table of Contents
Recent
-
Bitcoin Fundamental Briefing, March 2024 Demystifying Cryptocurrency Nodes: Deep Dive into Polygon Node Ecosystem Strategies for Trading Forex on a Budget Bitcoin Fundamental Briefing, February 2024 Bitcoin Fundamental Briefing, January 2024 Strategic Asset Allocation Techniques for Currency Traders Bitcoin Fundamental Briefing, December 2023 Bitcoin Fundamental Briefing, November 2023