The Top 4 Simple Forex Trading Strategies That Work

Did you know that your trading strategy doesn’t have to be complicated in order to make money? Try these simple forex trading strategies, that actually work.
Are you searching through simple forex trading strategies, trying to find the one that suits you?
If this sounds like a familiar process, then we’ve got you covered.
Top 4 Simple Forex Trading Strategies:
- Moving Average Crossover Strategy
- RSI Overbought and Oversold Strategy
- Support/Resistance Breakout Strategy
- Pin Bar Reversal Strategy
When implemented correctly, any of these simple forex trading strategies can help set you on a path to consistent profitability.
Trading an advanced trading strategy does not necessarily mean you’ll make more money.
Don’t get sucked in!
Let’s dive straight into our top 4 simple forex trading strategies that work.
1. Moving Average Crossover Strategy
The first hugely popular trading strategy that we’re going to highlight, is the moving average crossover strategy.
What is a Moving Average?
A moving average, sometimes shortened to an MA, is a technical indicator used to smooth out price action.
By smoothing price, it helps to filter the noise of short term price spikes that distract you from the overriding trend.
In their most basic form, a rising moving average indicates a bullish trend, while a falling moving average indicates a bearish trend.
A simple moving average (SMA) is calculated by adding up all of the closing prices of the last X candles, and then dividing the total by X.
What is a Crossover?
A crossover occurs when two moving averages intersect – A crossover!
While moving averages alone help to identify trends, when you apply multiple MAs, plotting different time periods, they become even more powerful.
This is because you can now see short and long term trends, and make trading decisions that ensure you’re not getting tunnel vision.
Bullish momentum is confirmed when a short term MA crosses above a long term MA. On the other hand, bearish momentum is confirmed when a short term MA crosses below a long term MA.
How to Trade the Simple Moving Average Crossover Strategy
EUR/USD hourly chart:
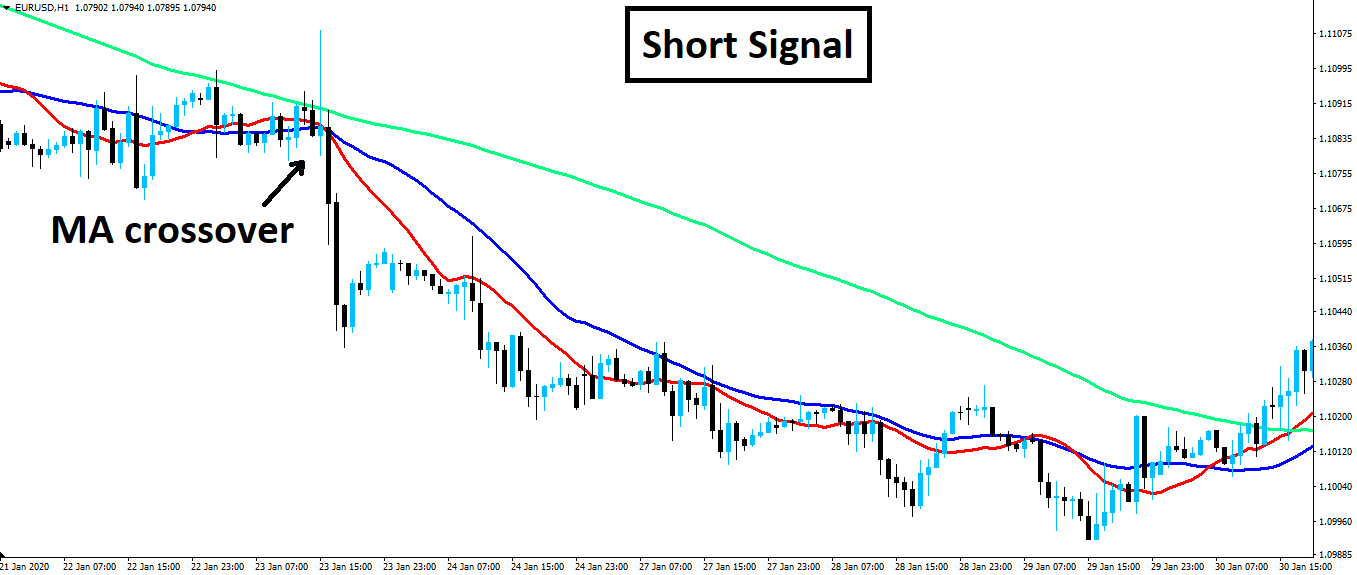
The strategy:
- Insert 3 moving average onto your chart – A 15-period SMA, a 30-period SMA and a 100-period SMA.
- Take a long position when the 15-period SMA crosses above the 30-period SMA and both are above the 100-period SMA.
- Take a short position when the 15-period SMA crosses below the 30-period SMA and both are below the 100-period SMA.
- Place your stop loss below the 30-period SMA and leave your target open ended until you get a cross back.
2. RSI Overbought and Oversold Strategy
The second simple forex trading strategy we’re going to go over, is called the RSI overbought and oversold strategy.
What Does RSI Stand For?
RSI stands for relative strength index. Like the moving average, it’s a technical indicator that’s used to indicate overbought or oversold conditions in forex markets.
The RSI indicator gives a reading between 0 and 100 and typically you would say that a reading above 80 would indicate overbought conditions, while a reading below 20 would indicate oversold conditions.
It shows an overextended move in either direction, giving traders the opportunity to take advantage of a possible retracement.
What is Overbought and Oversold?
If a market is stretched in either direction, then the theory is that at some point the market is going to see a reversion to the mean.
Whether that’s actually the case in reality however, is a whole other argument.
Is there really such a thing as overbought and oversold?
When used in isolation, the RSI indicator is prone to giving false signals for this reason.
But say the market is in a higher time frame bullish trend and the RSI indicates oversold conditions on all lower time frames, then you could buy to continue following the trend.
Overbought and oversold is more of an art, than a science.
How to Trade the Simple RSI Overbought and Oversold Strategy
EUR/USD 1 minute chart:
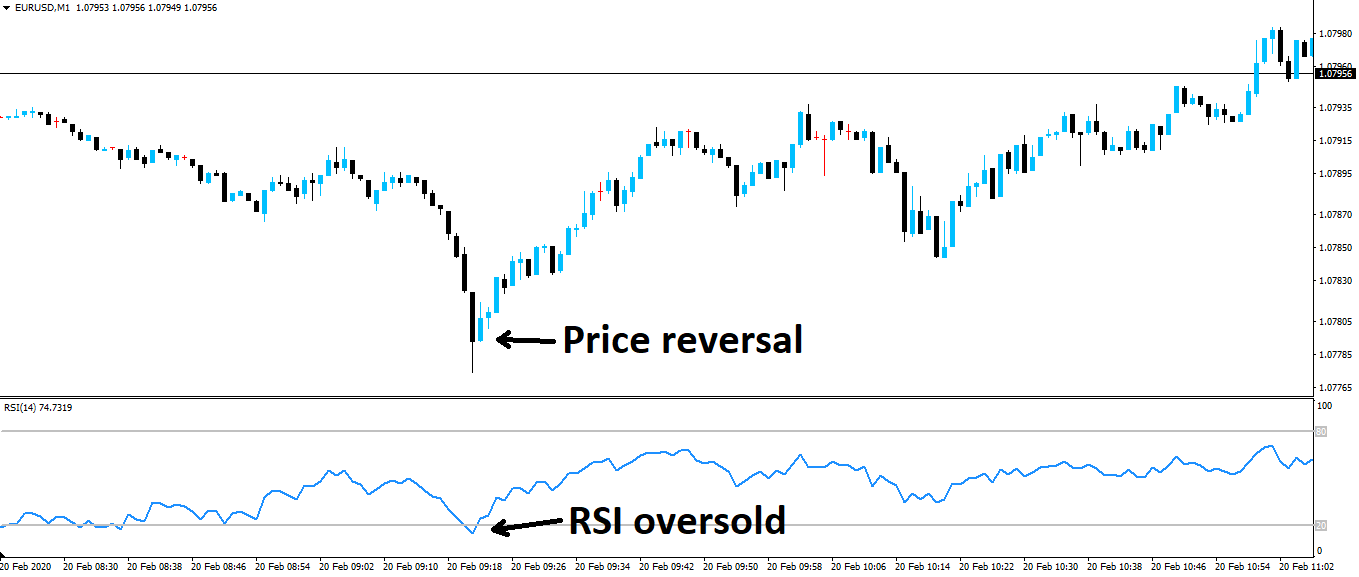
The strategy:
- Insert the RSI oscillator onto your chart.
- Take a long position when the RSI on all intraday charts is below 20 and the market is in a higher time frame bullish trend.
- Take a short position when the RSI on all intraday charts is above 80 and the market is in a higher time frame bearish trend.
- Place your stop loss on the other side of the most recent swing high/low.
3. Support and Resistance Breakout Strategy
The third simple forex trading strategy we’ve sourced, is a price action based, support and resistance breakout strategy.
What is Support and Resistance?
In technical analysis, support and resistance is used to identify price points on a chart, where price has reacted in the past.
Support – A level formed by buyers creating demand at a low point on a chart.
Resistance – A level formed by sellers creating supply at a high point on a chart.
Support and resistance levels are often self-fulfilling prophecies, meaning that they are significant levels, simply because everyone thinks they’re significant levels!
If you don’t already think human being are strange creatures, then the concept of support and resistance should seal the deal.
What is a Breakout?
A breakout occurs when price moves through support or resistance, in either direction.
They can be sustained moves, or they can fail and instantly retrace – Known as a fakeout.
This is because while support and resistance levels are strong, they aren’t impenetrable barriers.
Support and resistance doesn’t hold forever.
Think about this – If they never broke, then there’d be no such thing as a trend!
Breakouts through resistance, signal that they buyers are in control of the market, while breakouts down through support, show control is with the sellers.
This change in market sentiment, usually presents a trading opportunity.
How to Trade the Simple Support and Resistance Strategy
EUR/USD hourly chart:
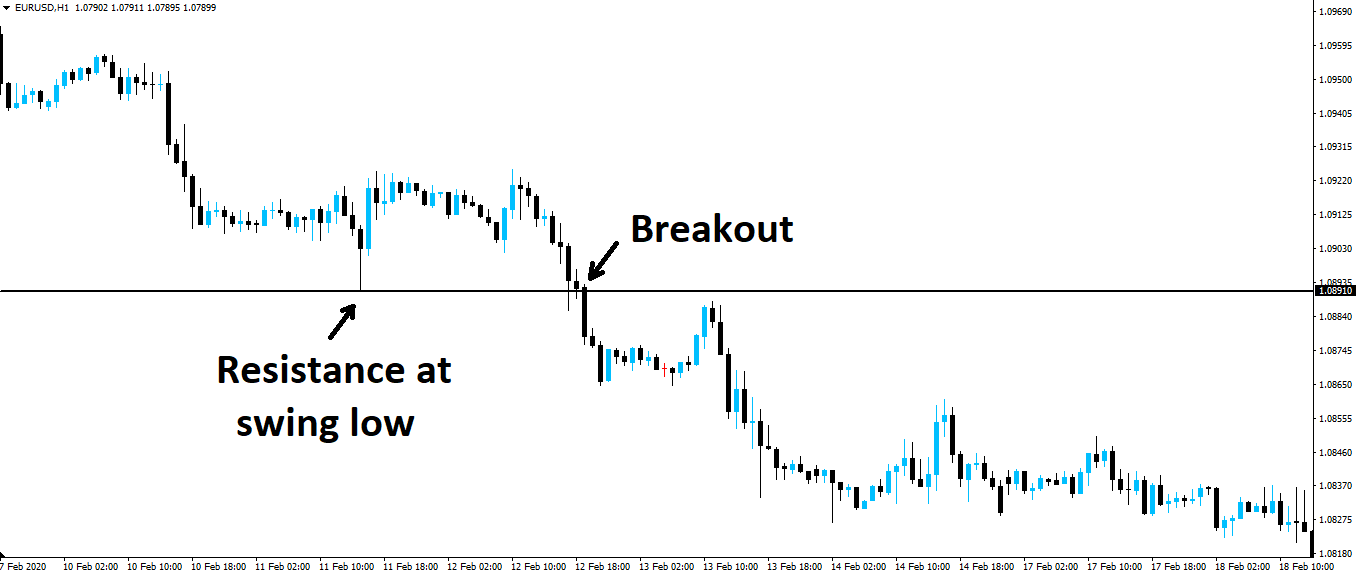
The strategy:
- Draw support and resistance lines onto your chart, at swing high and lows.
- Take a long position when price breaks out of resistance, pushing higher with momentum.
- Take a short position when price breaks out of support, pushing lower with momentum.
- Place your stop loss 50 pips from your entry and target 1:1 on the initial momentum move.
4. Pin Bar Reversal Strategy
Our fourth and final simple forex trading strategy, is another price action based strategy. The pin bar reversal strategy.
What is a Pin Bar?
A pin bar is a single candle formation featuring a small body and a long wick.
The long wick shows price having been rejected from its low, closing back where the candle opened and signaling a possible change in market control between bulls and bears.
While many traders believe that the name “pin bar” comes from its long, pointy shape resembling a needle. It in fact comes from a book by Martin Pring called Technical Analysis Explained, where he first described the “Pinocchio bar”.
Wild huh!
What is a Reversal?
A reversal simply shows a change in direction on the chart.
If price was going up, then a reversal would see price now going down. Likewise, if price was going down and reversed, then it would now be going up.
Fairly straight forward, right?
In the context of a pin bar reversal – What if you saw a strong bullish trend, with a pin bar printed at resistance?
Well, a reversal could be on the cards.
How to Trade the Simple Pin Bar Reversal Strategy
EUR/USD daily chart:
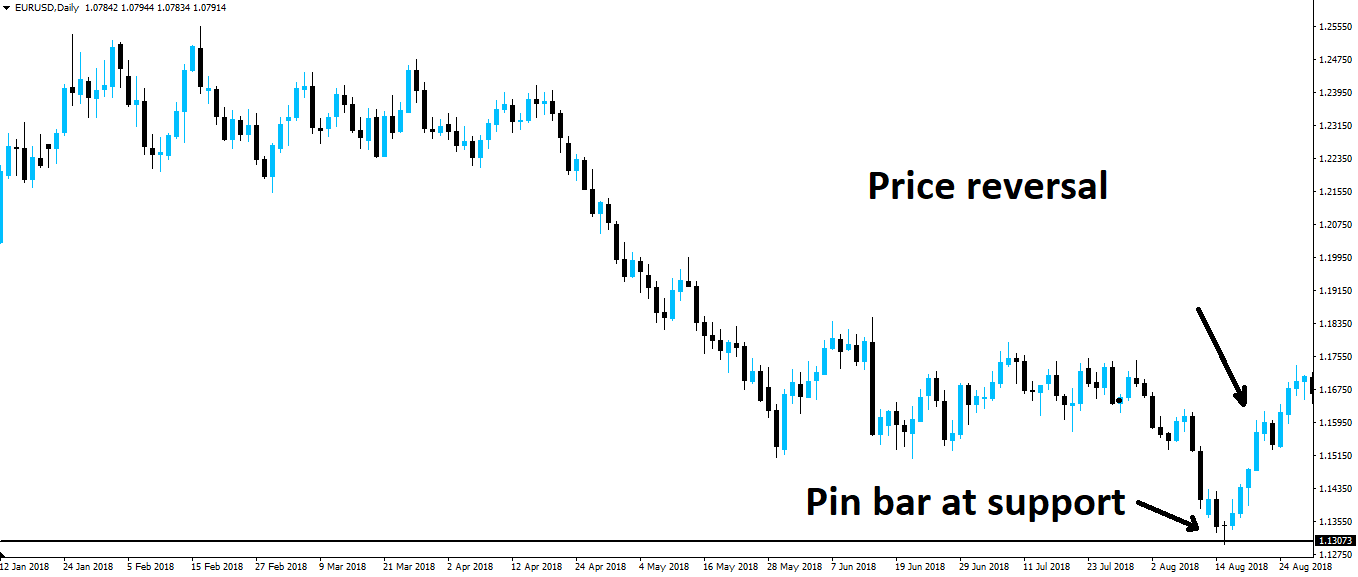
The strategy:
- Draw support and resistance lines onto your chart.
- Take a long position when a pin bar forms on support, signaling a possible reversal incoming to the upside.
- Take a short position when a pin bar forms on resistance, signaling a possible reversal incoming to the downside.
- Place your stop loss at the other end of the pin bar and target a generous risk:reward ratio of 1:3 or higher.
Types of Trading Strategies – Price Action vs Indicators
Now that we’ve gone over 4 simple forex trading strategies that work, lets dive a little deeper.
Not all trading strategies are created equal.
The strategies above can be divided into two categories:
Indicator based – A trading strategy that uses an indicator to analyse past price and applies a mathematical formula to it.
Price action based – A trading strategy that uses current price action to predict future price movements.
Strategy 1 and strategy 2 are both indicator based trading strategies, using moving averages and the RSI indicators respectively.
Strategy 3 and strategy 4 on the other hand, both use price action to determine entries and exits. They’re traded on naked, indicator free charts.
Which Type of Trading Strategy is Better?
So now comes the $54 million question.
Is one type of trading strategy better than the other?
Well just like most things in forex trading, there is no definitive answer and it entirely depends on you.
If you find yourself making mistakes when reading the market, then a mechanical indicator based trading strategy might be best for you.
While on the other hand, if you feel in tune with the market, then there’s no better signal to use than price action itself.
If you understand yourself, then you’ll understand which type of trading strategy is more likely to work for you.
Risk Management – The Great Leveler Across Strategies
No matter which forex trading strategy you choose to trade, risk management is still key.
Whether you’re trading a simple or complicated strategy, there’s no hiding from the fact that applying poor risk management principles will be the downfall of both.
Risk management considerations:
Risk:reward ratio – Often depicted in terms of units, this is how much you risk, compared to how much you intend to target.
Winning percentage – The percentage of winning trades compared to losers.
When you’re creating a forex trading strategy, you’ll find that there’s often a trade-off between the two.
It’s rare for a strategy to have both a high risk:reward ratio, while running at a high winning percentage.
If your trading strategy has a high risk:reward ratio, then it will most likely experience a lower winning percentage.
But if that same strategy has a low risk:reward ratio, then you’ll probably be able to run it at higher winning percentage.
There will always have to be some sort of compromise granted.
Know Yourself, Know Your Trading Strategy
In the end, both can be profitable if applied correctly and what really matters here is which you’re most comfortable trading.
Can you handle the psychological strain that having a string of losing trades brings?
Even though you know that one winner will wipe them all out, and then some?
If you can’t, then it’s certainly nothing to be ashamed of.
We see so many traders try to force risk management strategies designed for other people on themselves and inevitably fail because it will never gel with their mindset.
Make an emotionally intelligent choice, not a choice that will make you look good to someone on the outside.
Know yourself and you’ll know which risk management profile is most likely to succeed alongside your trading strategy.
Final Thoughts on Choosing Simple Forex Trading Strategies That Work
We hope you’ve found value in some of our top 4 simple forex trading strategies that work.
Keep in mind that you don’t have to trade each strategy to the tee.
You can take elements of one strategy that work well for you and merge them with elements from another.
There really are no rules here, do whatever works best for you.
One way to do this successfully is to use the support/resistance breakout strategy, alongside the pin bar reversal strategy.
When the market has a lot of momentum behind it, trade the breakout strategy.
When the market has no momentum and prints a pin bar, trade the reversal strategy.
Once you know who you are as a trader and apply the correct risk management principles that suit you, then you’ll be well on your way to consistently profitable trading.
Author Profile

Fat Finger
My name is Phat Fin Ge, but most people just call me Fat Finger or Mr. Finger.
Many years ago, I was a trader on the Hong Kong Stock Exchange. I became so successful that my company moved me to their offices on Wall Street. The bull market was strong, but my trading gains always outperformed market averages, until that fateful day.
On October 28th, 1929, I tried to take some profits after Charles Whitney had propped up the prices of US Steel. I was trying to sell 10,000 shares, but my fat finger pressed an extra key twice. My sell order ended up being for 1,290,000 shares. Before I could tell anyone it was an error, everyone panicked and the whole market starting heading down. The next day was the biggest stock market crash ever. In early 1930, I was banned from trading for 85 years.
I went back to Hong Kong to work at my family's goldfish store. Please come and visit us at Phat Goldfish in Kowloon, only a 3 minute walk from the C2 MTR entrance.
I thought everyone would forget about me and planned to quietly return to trading in 2015. To my horror, any error in quantity or price which cause a problem kept getting blamed on Fat Finger, even when it was a mix up and not an extra key being pressed. For example, an error by a seller on the Tokyo Stock Exchange was to sell 610,000 shares at ¥6 instead of 6 shares at ¥610,000. That had nothing to do with me or with how fat the trader's finger was, but everyone kept yelling, "Fat Finger! Fat Finger!" In 2016, people blamed a fat finger for a 6% drop in the GBP. It really was a combination of many things, none to do with me or anyone else who had a wider than average finger.
Now that I can trade again, I'm finding forex more interesting than stocks. I've been doing some research on trading forex and other instruments and I'll be sharing it here.
If you see any typing errors, you can blame those on my fat finmgert. If you see any strange changes in price, it's not my fault.
Info
2596 Views 0 CommentsComments
Table of Contents
Recent
-
Bitcoin Fundamental Briefing, March 2024 Demystifying Cryptocurrency Nodes: Deep Dive into Polygon Node Ecosystem Strategies for Trading Forex on a Budget Bitcoin Fundamental Briefing, February 2024 Bitcoin Fundamental Briefing, January 2024 Strategic Asset Allocation Techniques for Currency Traders Bitcoin Fundamental Briefing, December 2023 Bitcoin Fundamental Briefing, November 2023