Simple Forex Day Trading Strategies for Beginners

Back then, there were times when only big players like the large financial institutions, brokerages, and trading houses, could actively participate in the markets. However, with the rise of the internet, brokers made trading available to the average investors as well.
Trading and investing are two different terms. Investing is holding securities for a long time, while trading is typically equated with the short-term. In trading, we have Day trading, which is defined as the buying and selling of a security within a single trading day. And a Day trader is the one who day trades. So, they basically predict the present day’s price action of the market. They open a position and often close all of them on the same trading day.
Day trading is usually associated with technical analysis. To succeed in day trading, it is vital to have strategies that work consistently. Some of the broadly classified strategies are mentioned below.
Scalping: Attempting to make small profits for small price movements throughout the day.
New based trading: As the name suggests, it is the trading of securities during news events. People prefer this style of trading as it offers heightened volatility.
Range trading: Looking for trading opportunities at the support and resistance level.
High-frequency trading: Strategies involving sophisticated algorithms to exploit short-term inefficiencies.
The Prerequisites
As mentioned, day trading is mostly associated with technical analysis. And there is a conception among the people that this type of analysis is complex. However, it is not true. Sticking to the basics is the key to mastering technical analysis. Especially for day trading, it is necessary to have a simple, straightforward, and effective strategy. The following are some of the fundamentals that must be incorporated by every day trader.
Education
By education, we do not mean the strategy you are supposed to use. Apart from the strategy, it is also necessary to stay updated on the market news and on any event that could affect your security.
Three is the Limit
Though there are several pairs in the market out there, your concentration must not be in more than three pairs. Overtrading causes confusion and hence leads to a loss. So, as a beginner, it is highly recommended to start small.
Money Management
Money management is as important as the strategy used for trading. Because in day trading, one can manage to not lose money though the market does not turn in their direction. As a beginner, have a plan on how much you are willing to lose on each trade. Typically, successful traders don’t risk more than 2% of their capital on a single trade. One must prepare themselves to take hits on some trades as well.
Components Required for Every Strategy
Be it price action trading, or algorithmic trading, or any other type of trading, there are few components in the strategies that are common in all and must be inculcated in every strategy.
Liquidity – You can swiftly open and close positions with stable pricing in highly liquid markets.
Volatility – This simply tells you the potential profit or loss that can be made on a trade.
Trading Strategies
Below, we have discussed some of the amazing day trading strategies which every trader must be aware of. These strategies are pretty basic, but without knowing them, one can never be a successful day trader. We have also included live trade examples so that you can understand the strategies better. Let’s get into them right away.
High-low Trading Strategy
This day trading strategy can be considered as the easiest of all the strategies that will be discussed. This is more math-based than a technical strategy. And the beauty of this is its elegant symmetry.
Firstly, take a period of your choice, such as ten days, and calculate the high price and the low price of the currency pair in these ten days. For instance, let’s say the highest and lowest price is 1.0000 and 1.2000. Now, find the average by adding the two and dividing by two. This yields a value of 1.1000, which will further be used for this strategy.
When the current market price of the pair touches or surpasses the 1.2000, one can go for the buys. A stop loss for this would be the average price of 1.1000. Similarly, if the price touches or drops below the 1.0000 mark, it is time to go short. A stop loss for this would be the same average price1.1000.
This is, no doubt, the most straightforward strategy for beginners. Traders must keep track of the number of successful trades and loss trades this strategy generated. One may continue to use it only if the number of successful trades is more than the number of unsuccessful trades.
Pin Bar Trading Strategy
The pin bar pattern is a popular trading pattern in price action trading. And there are several ways to trade this pattern. Here, we shall be discussing one simple, effective strategy mainly for the beginners.
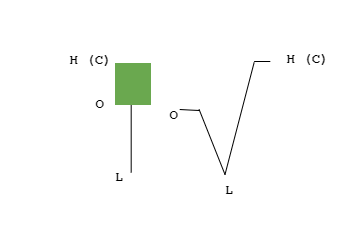
Before getting into this day trading strategy, let us comprehend the pin bar candlestick pattern. From the below figure, we can see that the market opened at point ‘o,’ went down to point ‘L’ and closed at ‘H.’ Here, though the market went down, it shot right back up and closed above the open price, indicating the strength of the buyers.
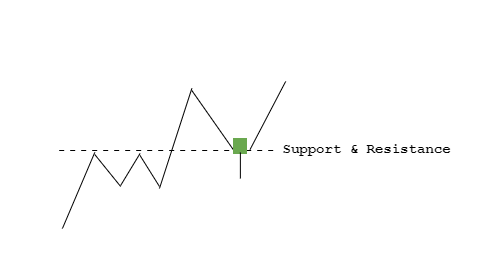
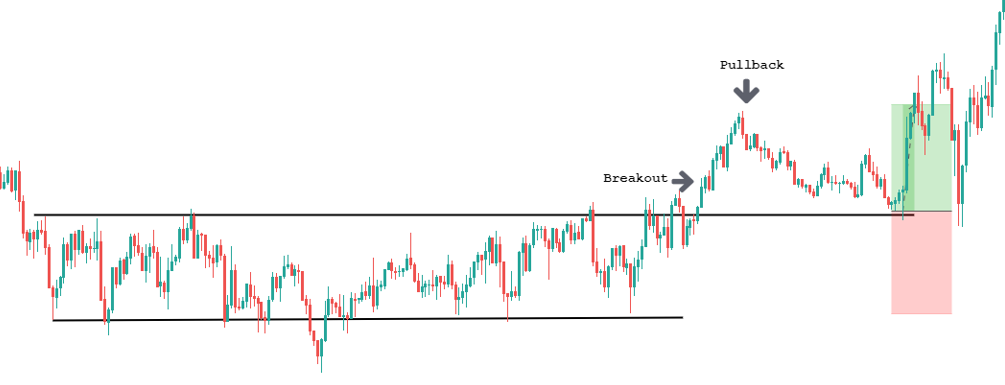
Coming to the strategy, it primarily deals with support and resistance levels as well as the pin bar candlestick pattern. A support and resistance break signifies the strength of the buyers/sellers in the market. As per the strategy, we wait for the market to break above a resistance level. And once the price starts to pull back to the resistance turned support level, we anticipate a buy when the pin bar candle appears in that area.
Trade Example
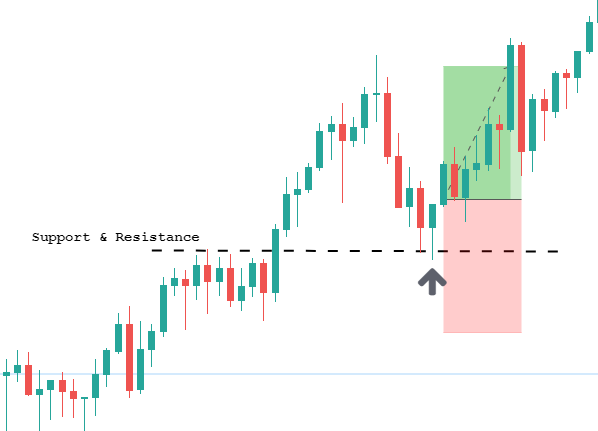
Consider the below example. The market was ranging for a while and then broke above the resistance level (black dotted line). Now, all we wait for is for the market to pullback and give us the pin bar pattern.
After breaking the resistance, the market starts to a pullback (red candles). Once it reaches the Support & Resistance Level (black dotted line), the pin bar candle appears. This indicates that the buyers are back into action. Hence, right after the close of the pin bar candle, one can get into a long position.
Stop Loss & Take Profit Placement
For every strategy you use, it is necessary to maintain a logical stop loss. Talking about this strategy, it is logical to place a stop loss below low of the pin bar candle. The price going below implies that the buyer has called it a quit.
As beginners, a Take Profit at the recent highs is apt for this strategy. Intermediate and more experienced traders may remove 50% of their positions at the recent highs and leave the rest to fly in anticipation of higher highs.
Breakout Trading Strategy
Breakout trading is the easiest trading strategy in forex and is apt for beginners. There are numerous ways to trade a breakout. We’ll be discussing a few of them here. The idea of this strategy is to anticipate for a buy/sell after the breakout happens. Based on where the breakout happens, we can classify them into different breakout strategies.
Wedge Breakout Strategy
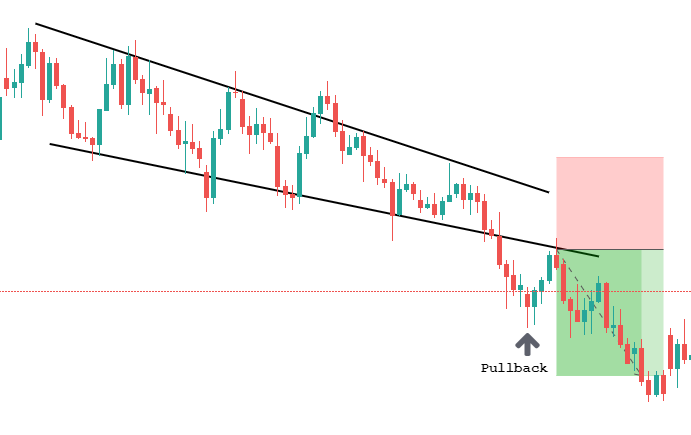
As per this strategy, when the market breaks out from a wedge pattern, we wait for the price to retrace to the wedge lines, and then attempt to go long or short accordingly.
Consider the below chart. The market is trying to make lower lows and lower highs; hence, the formation of the wedge. But, at a point in time, it breaks below the wedge. Now, we wait for the price to retrace back to the wedge. Once the price gets to the bottom of the wedge, we can prepare to go short.
Stop Loss & Take Profit Placement
A stop-loss above the recent high of the wedge (as shown in the chart) is sufficient for this strategy.
Scroll behind and look for the support and resistance areas. And this is where the take profit goes. Else, as a beginner, it recommended aiming not more than 1RR.
Range Breakout Strategy
Similar to the above technique, here, wait for the price to break above or below the range. Take a trade after the price retraces to the support and resistance level.
Form the below chart we can clearly ascertain that the market is bouncing between the two black lines, which is a case of a range. Now that we have a visible range, we wait for the price to break above/below and prepare to open positions on this pair.
Finally, the price breaches above the resistance line. So, when the price comes down to the resistance (which is now the support) line, we can hit the buy.
Stop Loss & Take Profit Placement
A healthy stop-loss would be at the bottom of the range. As you gain experience, you may heighten the stop-loss just below the top range line. Take-profit order can be placed at the higher timeframe’s resistance area.
Moving Average Crossover
This is another simple, effective strategy for beginners that make use of the simple moving average. Moving average is a lagging indicator that uses old price data and moves slower than the current market price. The longer you set the period to, the slower it moves. So, for this strategy, we utilize a longer moving average in conjunction with a shorter moving average. In our example, we shall be using the 200-day moving average as the longer MA and 25 day moving average as the shorter MA.
According to this strategy, when the shorter moving average moves above or below the longer moving average, it indicates a change in the trend, giving us a bullish or bearish signal.
Below is the chart of USD/CAD on the 4H timeframe. We have inserted two moving averages to this chart. The orange line represents the 25-day moving average, and the blue line represents the 200-day moving average. It can be observed that the 25-day moving average follows the prices much closely compared to the 200-day moving average.
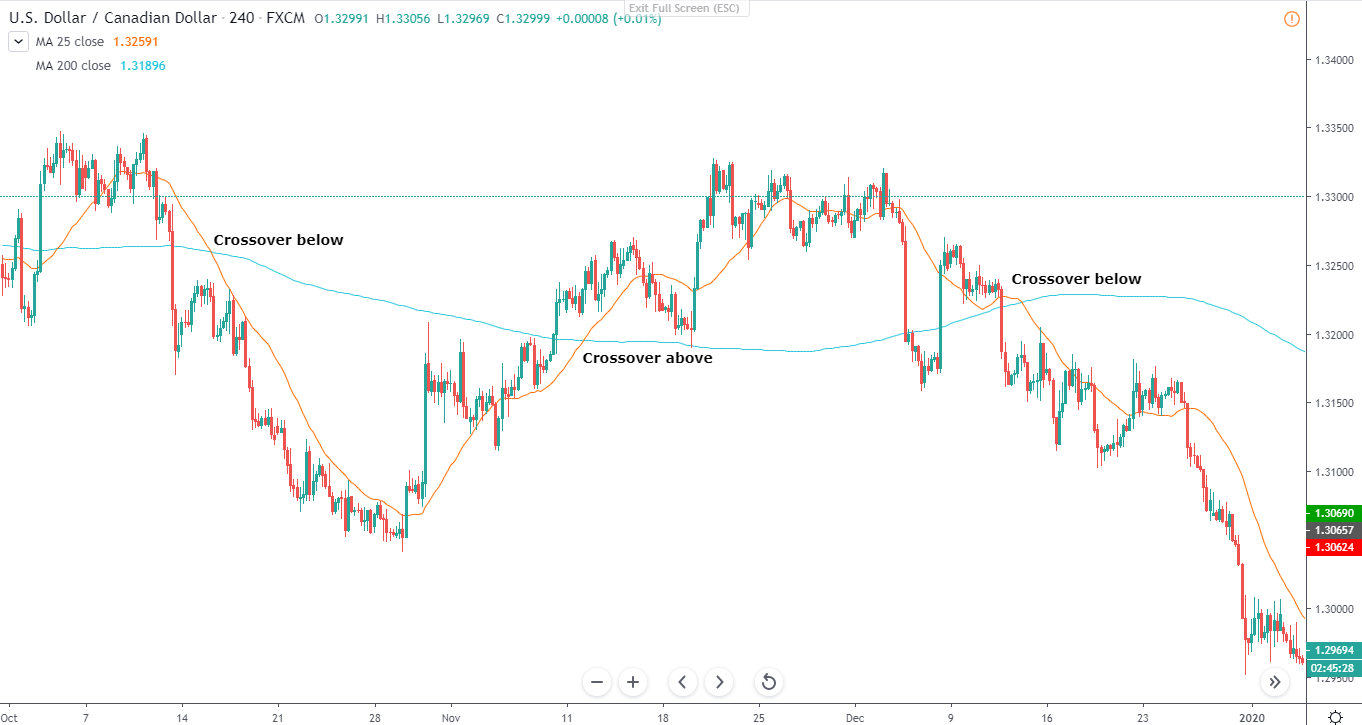
In the chart, there are three crossovers between the two moving averages. When the 20 day moving average crosses below the 200 day moving average, it indicates a change in the trend. Technically, it means that the recent prices are lower than the older ones. Hence, indicating a sell signal.
Similarly, when the 25 day moving average moves the above the 200-day moving average, it suggests a bullish signal, as the recent prices are higher than the older ones.
Well, in this strategy, there is no specific entry and exit point. However, it is recommended to trade this strategy during market opening sessions to have good liquidity and volatility.
Additional Reading
This strategy can be used in conjunction with the breakout strategy as well. As a confirmatory tool, one may discard a breakout if it does not match the overall trend indicated by the moving average indicator. For instance, if the breakout happens towards the upside and the shorter moving average is below, the longer moving average, then such a setup must not be taken into account.
Scalping with the Stochastic Indicator
Scalping is rigorous trading in a small timeframe. Scalping is usually associated with day trading. In this section, we shall learn to scalp with the stochastic indicator.
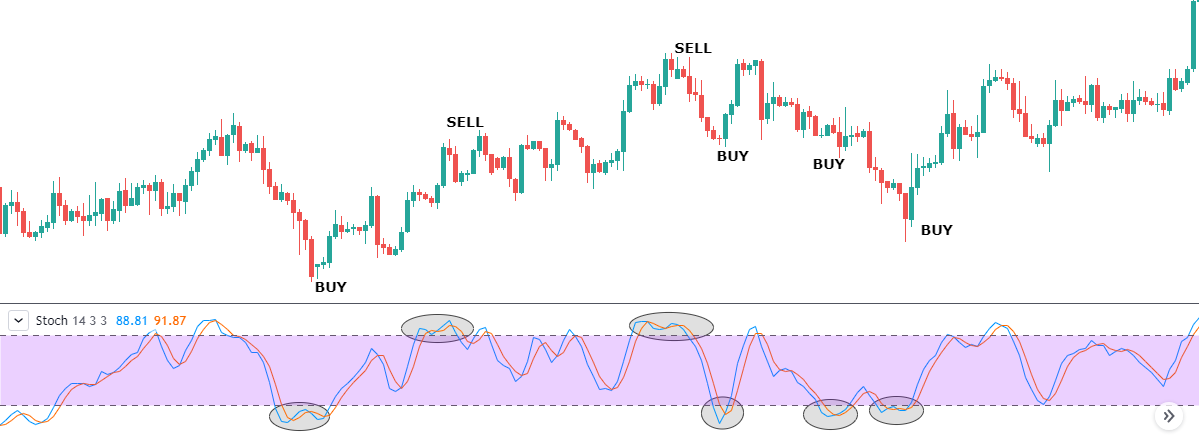
The stochastic indicator consists of a lower bound and an upper bound. The lower bound is referred to as the oversold area, while the upper bound is called the overbought area. According to the strategy, when the two lines in the indicator cross above the oversold area, a long signal is generated, and when it crosses below the overbought area, a sell signal is generated.
In the below chart, it is evident that we have six trading opportunities, four buys and two sells. And it is observed that out of the six attempts, only once (fifth) the opportunity has failed. Hence, proving the consistency of the strategy. It is not recommended to not use any indicator standalone. To reduce risk on the trade, it is suggested to use indicators in conjunction with other indicators.
Support and Resistance Strategy
Support and resistance is, no doubt, the most important term in the Forex industry. Support is an area in the market where the buyers are powerful, and resistance is an area where the sellers are powerful. Trading these levels is extremely simple.
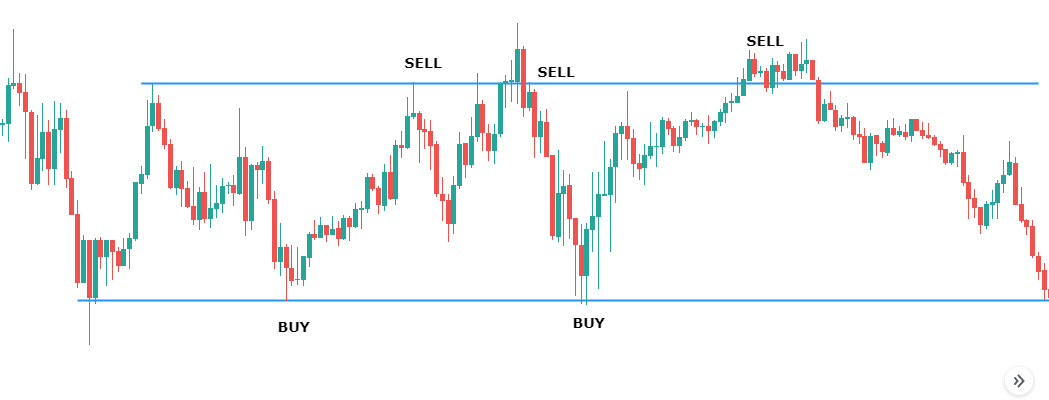
According to this strategy, when the price is at the support region, we attempt to go long as the buyers here are influential. And when the price is around the resistance region, we look for sell opportunities as the sellers dominate this area.
Consider the below example. We can clearly infer that the market is hovering between the two blue lines, forming a range. To trade this, we hit the buy as the price gets to the bottom line (support) and go short as the price touches the bottom line as shown. Out of five trades, we can see that four of them performed pip-to-pip.
The Spinning Top Candlestick Pattern Strategy
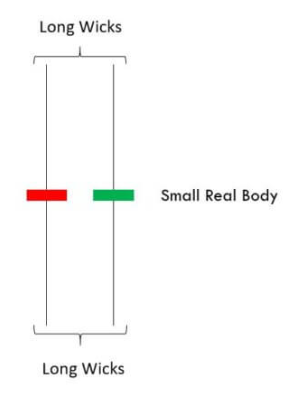
This is another day trading strategy that is based on a candlestick pattern. A spinning top is a single candlestick pattern and is used to give trading signals. It is a candlestick with a short body with wicks on the top and bottom. This pattern depicts indecision in the market. If this pattern occurs in the charts, one must apprehend that both buyers and sellers aren’t under dominance. However, this pattern can still be used to buy and sell signals. Below is how a bullish and bearish Spinning Top candle would look like.
The predominant trend before the pattern occurs vital to identify the signal provided by the spinning top. If the pattern occurs following a downtrend, then it implies that the sellers are losing strength, and there is a possibility of the market to reverse its direction. Conversely, if the pattern occurs after a predominant uptrend, then it indicates the end of the uptrend and beginning of a downtrend.
Triggering the buy or sell button just on the occurrence of the pattern is not the right way to do it. While trading single candlestick patterns, it is always recommended to wait for a confirmation. For this pattern, a small range after the pattern occurs is sufficient to confirm the legitimacy of the pattern.
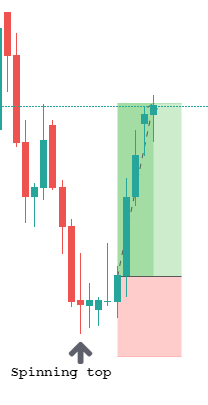
Consider the below chart. We can see that the market was in a clear downtrend. After falling for quite a while, the spinning top candlestick pattern showed up. Later, the market even hovered in the same region, giving us confirmation that the market is set to reverse its direction.
Stop Loss & Take Profit Placement
Talking about the stop loss and the take profit, you may keep the stop loss well below the low (bottom of the wick) of the spinning top candle, and a take profit at the resistance or the recent highs.
The False Breakout Strategy
Trading is not all about technical analysis. There is psychology involved as well. And this psychology is often associated with false breakouts. An analogy to false breakouts is that it happens to trap the public in the wrong direction.
The false breakout strategy is the one that is typically used in conjunction with other strategies. Here, we shall discuss how false breakouts are an excellent confirmation tool for trading a range.
Consider the below chart. We clearly see that the market is in a range state. The traditional way to trade a range is to buy at support and sell at resistance. But, in this strategy, we do not execute our trade as the price touches these levels. Instead, we wait for the price to breakout from these levels and retrace back the move. In simple terms, we anticipate for a false breakout at the support and resistance levels.
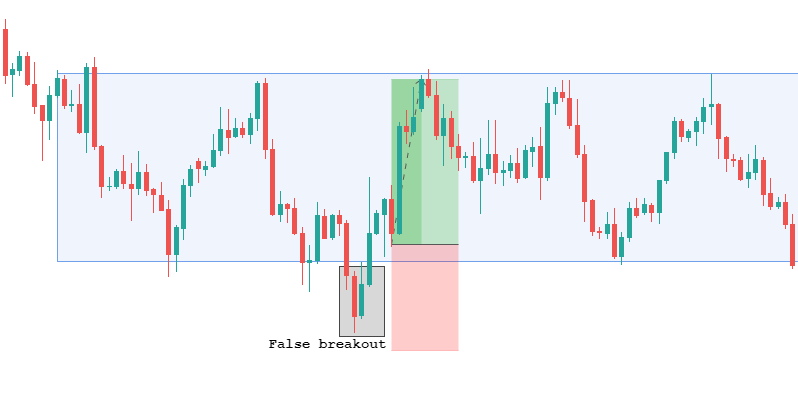
Coming to charts, we can see that the market broke below the support and then shot right back up, forming a false breakout. Hence, this is when we can confidently go long on this pair.
Final Words
This article was primarily aimed for beginners to get their feet wet in day trading. And we hope you found this beginner guide to be useful. Note that, the above strategies explained are just to give novice traders a glance on how strategies work and how correlated each one of them is. Also, it is highly recommended to test these strategies out on a demo account before applying it to a real account.
Talking about day trading, it is that business that takes a lot of time and patience to find success. Traders who day trade to make a quick buck, usually tend to fail in the long run. Furthermore, technical analysis is the most vital component in day trading. So, mastering technical analysis in trading is the only way to succeed in this domain. Finally, risk management too plays a significant role in a day trading strategy. A strategy with poor risk management is pointless.
References
https://dailypriceaction.com/forex-beginners/forex-trading-strategies-for-beginners/
https://tradingsim.com/blog/scalp-trading-active-investing-strategy/
https://www.thebalance.com/top-day-trading-entry-strategies-4145808
Author Profile

Fat Finger
My name is Phat Fin Ge, but most people just call me Fat Finger or Mr. Finger.
Many years ago, I was a trader on the Hong Kong Stock Exchange. I became so successful that my company moved me to their offices on Wall Street. The bull market was strong, but my trading gains always outperformed market averages, until that fateful day.
On October 28th, 1929, I tried to take some profits after Charles Whitney had propped up the prices of US Steel. I was trying to sell 10,000 shares, but my fat finger pressed an extra key twice. My sell order ended up being for 1,290,000 shares. Before I could tell anyone it was an error, everyone panicked and the whole market starting heading down. The next day was the biggest stock market crash ever. In early 1930, I was banned from trading for 85 years.
I went back to Hong Kong to work at my family's goldfish store. Please come and visit us at Phat Goldfish in Kowloon, only a 3 minute walk from the C2 MTR entrance.
I thought everyone would forget about me and planned to quietly return to trading in 2015. To my horror, any error in quantity or price which cause a problem kept getting blamed on Fat Finger, even when it was a mix up and not an extra key being pressed. For example, an error by a seller on the Tokyo Stock Exchange was to sell 610,000 shares at ¥6 instead of 6 shares at ¥610,000. That had nothing to do with me or with how fat the trader's finger was, but everyone kept yelling, "Fat Finger! Fat Finger!" In 2016, people blamed a fat finger for a 6% drop in the GBP. It really was a combination of many things, none to do with me or anyone else who had a wider than average finger.
Now that I can trade again, I'm finding forex more interesting than stocks. I've been doing some research on trading forex and other instruments and I'll be sharing it here.
If you see any typing errors, you can blame those on my fat finmgert. If you see any strange changes in price, it's not my fault.
Info
2141 Views 0 CommentsComments
Table of Contents
Recent
-
Bitcoin Fundamental Briefing, March 2024 Demystifying Cryptocurrency Nodes: Deep Dive into Polygon Node Ecosystem Strategies for Trading Forex on a Budget Bitcoin Fundamental Briefing, February 2024 Bitcoin Fundamental Briefing, January 2024 Strategic Asset Allocation Techniques for Currency Traders Bitcoin Fundamental Briefing, December 2023 Bitcoin Fundamental Briefing, November 2023