Horizontal and vertical lines in FX

Horizontal and vertical lines are valuable objects in forex. They help traders make sense of market randomness. Horizontal lines show traders important support and resistance levels, whereas vertical lines help traders understand market cycles better. We will try to explain below how to identify where to draw those lines, how to draw them, and how to trade them.
Identifying, drawing, and trading horizontal lines
Horizontal lines represent important price levels. Studying historical price action can reveal levels that the price has reacted to in the past. You can identify those levels by starting with the higher time frames such as the monthly, weekly, or daily timeframes. You can draw a line if you spot three tops or bottoms at the same price level. You can go deeper to lower timeframes and find levels that the price has reacted to more than 3 times in the past if you prefer shorter term trading. You can use different colors for higher timeframes and lower timeframes, as horizontal lines drawn on higher timeframes tend to be more meaningful as they are based on larger volumes of trading.
There is a disagreement between traders regarding whether you should draw the line at the candle wicks or the candle bodies. However, in general, drawing the lines at the wicks is considered less risky, as it prevents trading false breakouts.
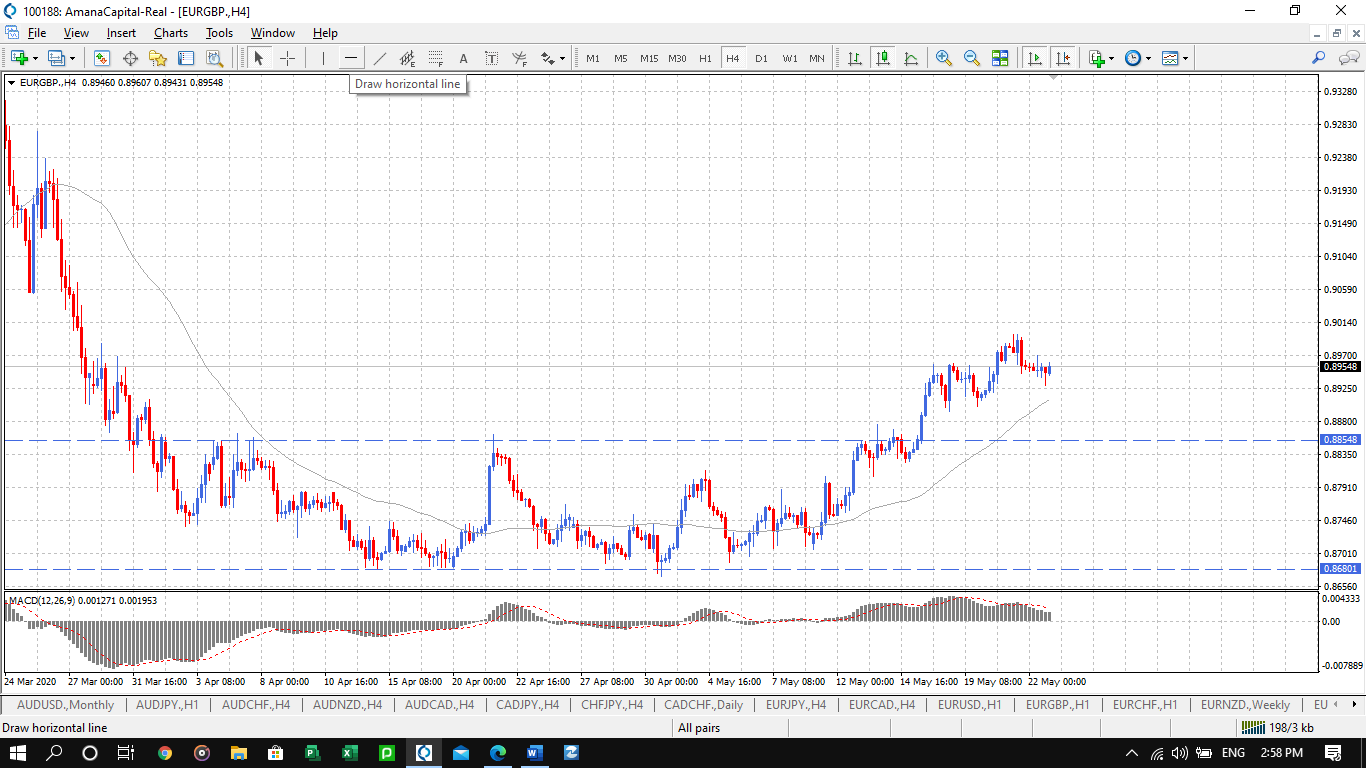
The tool for drawing horizontal lines
Drawing horizontal lines on MT4 is quite easy, given that there is a tool for that. The tool can usually be found in the toolbox above the chart. After you click on the horizontal line button, you will be able to draw a horizontal line at the level you want. You can edit the level later on or move the line to make it more precise.
Trading horizontal lines
There are many ways to trade horizontal lines. You can either trade the breakout or trade within the trading range.
If you want to trade the breakout, you have to make sure that the breakout taking place is not a false one. To do so, it would be better to wait for the candle, or more than one candle, to close outside of the trendline. This ensures there is conviction regarding where the price is going. You can also wait for a close outside the trendline and then a retest of the trendline.
If you want to trade within the range, you should wait for the price to touch the horizontal line and then bounce off of it decisively. You can use lower timeframes to find patterns that confirm the reversal. In such a case, you would put the stop loss outside of the trading range. If the price breaks out, you can close the position and switch to a breakout trade.
Identifying, drawing and trading horizontal lines
When you draw horizontal lines, the aim is to find key price levels. However, when you draw vertical lines, the aim is to identify market cycles, or waves.
Typically, markets move in waves, which have similar lengths to some extent (they often vary around an average). Estimating the potential length of a certain wave is a great way to reduce the noise in the market, and to estimate how long your trade should last.
Remember, that markets move in fractals. That is, they more in waves within waves, or they move in shorter-term trends within longer-term trends. To draw vertical lines, you can use the ZigZag indicator available on MT4, MT5, and most other platforms. It will help you identify tops and bottoms. Then, you can choose the tops and bottoms you want to draw the vertical lines, as shown in the chart below. Changing the settings of the ZigZag tool will likely change the length of the waves and the tops and bottoms that the indicator picks.
How to draw a vertical line in MT4
Drawing a vertical line is easy, as there is a tool for that in MT4 and MT5. It is usually in the toolbox above the chart. Once you draw the vertical lines, you will see that you managed to segment the market into cycles, or time periods.
Another tool that helps you draw vertical lines and predict the length of market waves is the Fibonacci time zones tool. You simply identify a wave, and then the tool will show you potential time zones in the future based on that wave and based on Fib percentages.
There is also the cycle lines tool, which helps you draw cycles of equal length on the chart (vertical lines at equal distance form one another).

Trading vertical lines
While vertical lines help you predict wave length, using other indicators to forecast the direction of the price action and find a good entry point is highly recommended. Then, vertical lines can also help you optimize your entry point, and also determine how long your trade should be open.
For example, if you predict a market reversal after the current wave, it may be better to wait until the current wave is over. You can do so by drawing vertical lines in the future based on the average wave length and your desired trade duration. You can also use the Fib time zones tool to predict wave lengths. With Fib time zones, you simply need to pick the most obvious trend in the market and select it using the tool. Then the tool itself will predict the length of future waves (or corrections). Once the current wave is over, and you have another technical entry signal, you can enter a trade betting on the upcoming wave.
Using horizontal and vertical lines together is a great approach to increase your trading accuracy. This not only helps you pinpoint great entry points; but also helps you predict the duration of the trade. This in turn would keep you in the market despite fluctuations, as you understand which wave you are in. Moreover, this also helps you catch trends and place trades with a good risk to reward ratio. Despite this, it takes some training before you can master those lines and reap the benefits.
https://www.forexpeacearmy.com/r/forex-articles/356/add-remove-vertical-horizontal-lines-metatrader4
Author Profile

DIY Trading Expert
I used to have a column on a DIY blog for home improvement projects. There were some small problems with people misreading my directions. Furniture collapsed. Plumbing caught fire. Buildings fell over. A few people died in ways my lawyer won't let me talk about.
Now I spend my time figuring out how to do all those things that experts are supposed to know. Then I make simple step-by-step guides to each one.
No one who's followed my advice about how to do things in their FX trading platform has been killed, yet. It's a perfect record and I'm very proud of it.
Info
1511 Views 0 CommentsTags
forex tradingComments
Table of Contents
Recent
-
Bitcoin Fundamental Briefing, March 2024 Demystifying Cryptocurrency Nodes: Deep Dive into Polygon Node Ecosystem Strategies for Trading Forex on a Budget Bitcoin Fundamental Briefing, February 2024 Bitcoin Fundamental Briefing, January 2024 Strategic Asset Allocation Techniques for Currency Traders Bitcoin Fundamental Briefing, December 2023 Bitcoin Fundamental Briefing, November 2023