How to understand an Economic Calendar

Fundamental Analysis studies the underlying reasons why prices are moving. There can be lots of different catalysts behind moves in the market.
Often prices move due to economic indicators. These indicators are data points that track various sectors within an economy.
Some common examples would be GDP, CPI or employment numbers. All these data points paint a picture of the overall health of an economy.
There are literally hundreds of data points released on a weekly basis. Some of these economic indicators are more important than others.
Traders need to keep track of these data points. In addition, they also need to know which ones are important.
The good news is there are tools available to help us with this. They are called Economic Calendars.
In this article we will be discussing the following points:
- Why keeping track of economic indicators is important?
- What is an economic calendar?
- How to see when economic events take place
- How to know which economic events are important
- Evaluating what markets are expecting from economic events
- Putting it all together
Why keeping track of economic indicators is important?
Beginners often question whether tracking data points are necessary. Understanding who uses these indicators usually clears up this question.
The most important institutions in the financial markets are Central Banks. According to the ECB, central banks manage the currency and money supply of a country.
This means they are responsible for setting monetary policy. Every business cycle in an economy requires different policies.
The key component used in monetary policy is managing interest rates. Central banks raise, and lower interest rates based on the health of an economy.
When an economy is booming, central banks usually raise interest rates. In contrast, an economy in recession usually requires central banks to lower rates.
Interest rates are a big factor when determining currency values. Consequently, it makes monetary policy very important for forex traders.
So, how do central banks gauge which monetary policy is appropriate? They do this by evaluating economic indicators for their economy.
Traders know the impact that interest rates can have on currency values. Thus, they try to anticipate future monetary policy changes.
Keeping track of economic indicators is an essential part of this process.
What is an economic calendar?
Economic data points are released by independent and government agencies. Below are examples of some of these agencies:
- Bureau of Labor Statistics (releases economic data for the US)
- Office for National Statistics (releases economic data for the UK)
- Eurostat (releases economic data for the EU)
- IHS Markit (releases PMI data for various countries around the world)
These are only a few of the many agencies that release economic data. But with so many countries and indicators how can traders keep track of them all?
It would take forever and a day to scour through all these websites. Luckily, with the help of economic calendars we don’t need to.
According to Wikipedia, an economic calendar is used to “monitor market-moving events”. It usually displays several economic data points in chronological order.
These calendars show the data releases for many countries all in one place. This means traders don’t have to struggle to find all the data from individual agencies.
The economic calendar groups it all together. There are many calendars available to choose from online.
Some of them are free and others have subscription fees.
Below are some examples of what different types of economic calendars look like:
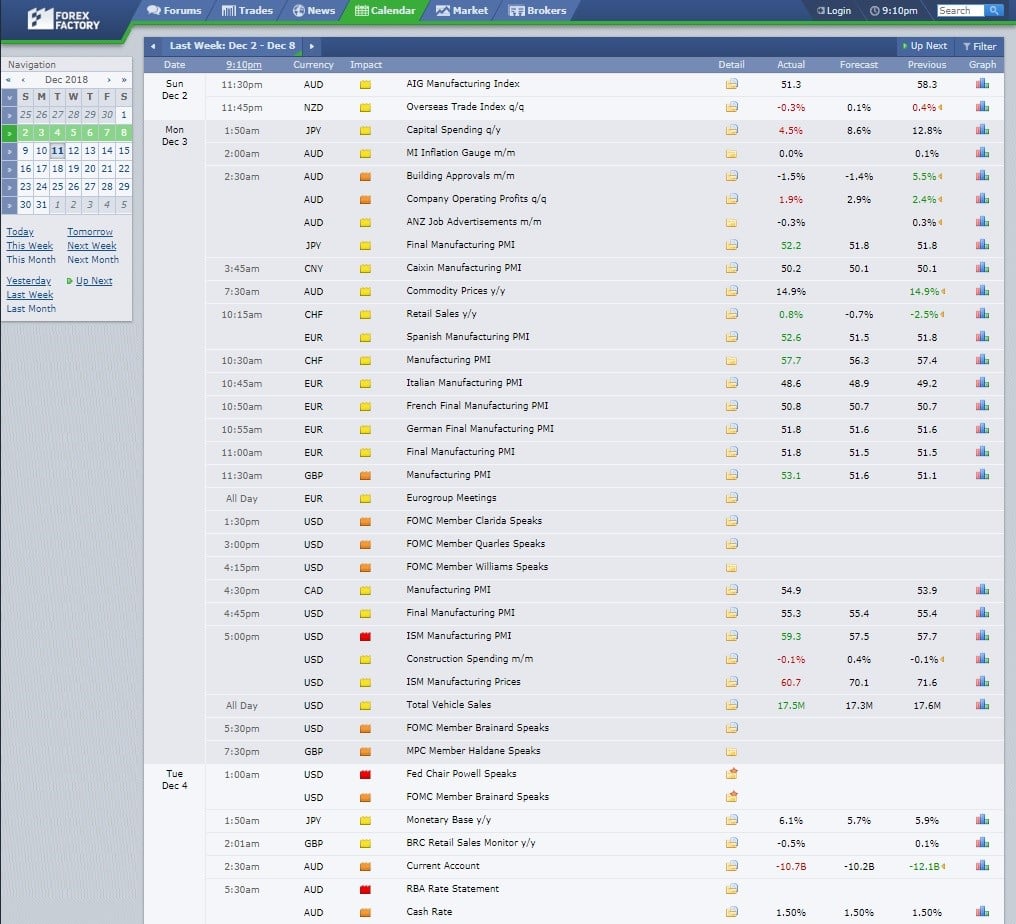
- Below is the Forex Factory Economic Calendar. It’s an example of a free calendar.
- Below is the Metastock Xenith Economic Monitor. It’s an example of a paid subscription calendar.

These are just few examples but there are many ones available online. A quick google search for economic calendar should give you a lot of options.
Most brokers also provide their clients with calendars as well.
How to know when economic events will take place
We’ve learnt what an economic calendar is. Now, we can look a little deeper into the details contained in them.
The main purpose of a calendar is to be able to plan ahead. That’s the part that we will look at next.
By and large, economic indicators releases occur on scheduled dates, times and intervals An example would be the NFP which is usually released the first Friday of every month.
Similarly, another example would be something like quarterly GDP numbers. As they are quarterly numbers they’re released on a quarterly basis.
Luckily, we don’t have to remember when all the events are due. The economic calendar provides us with that important info.
We can simply look a day or week ahead and see which events are scheduled. As an illustration, we can look at the example below.
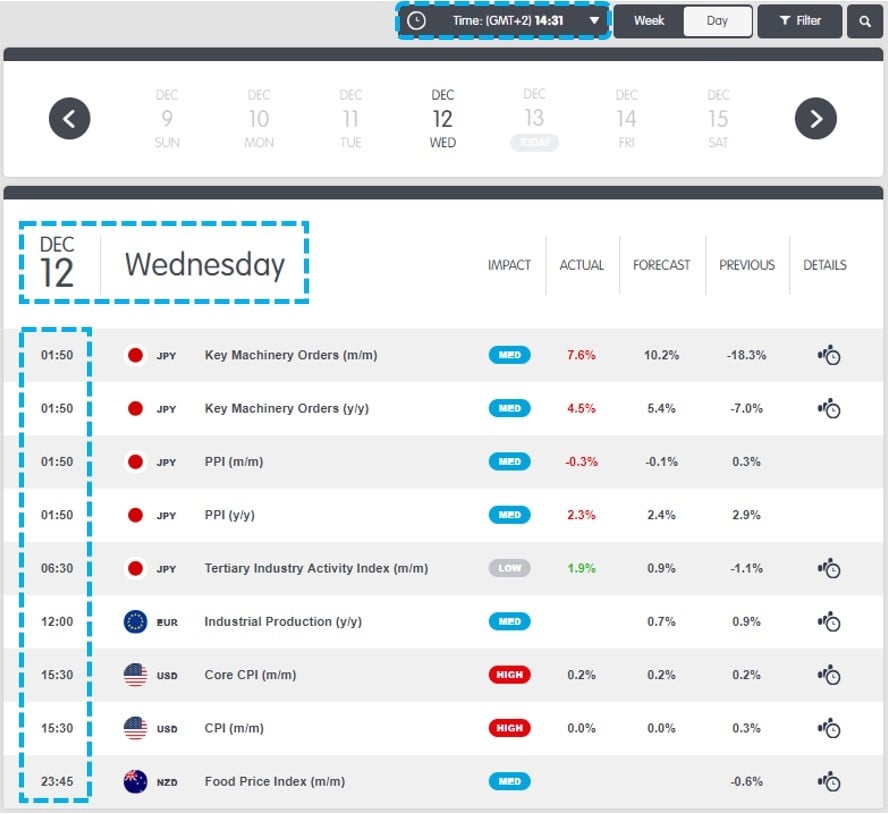
The calendar shows us the dates as well as the time of the various releases. This allows us to plan ahead when these events will take place.
This helps us in two important ways.
Firstly, being able to see the events in advance allows us to plan future trades.
Consequently, it gives us time to analyze what the markets are expecting from events. Knowing what markets expect from events can lead to great trading opportunities. Especially if there the actual data comes out with big deviations versus expectations.
Secondly, seeing the events in advance helps us to manage existing trades.
In other words, it can help us to reduce our risk on open positions. It can help us take profits and reduce risk if data is forecasted to come out against our trades.
In the same way, it can also help us to stay in winning trades. A vital consideration is the time zone which is used by different economic calendars.
Some calendars automatically detect your local time. Thus, the times displayed for the risk events are in your local time.
However, some calendars require you to set your time zone manually. Make sure to double check this on the calendar you decide to use.
How to know what economic events will take place
The next step in the calendar is knowing what events are due. Majority of calendars will give a short description of the event.
In addition, they also note which currency the event is related to. The examples below illustrate how different calendars display the same event.
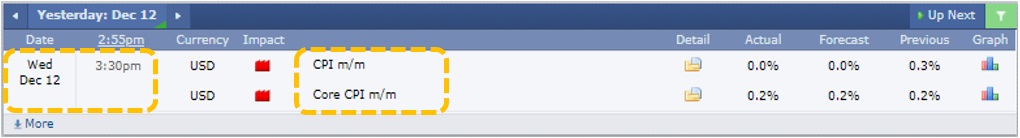
- Below is an example from the Forex Factory calendar. The event displayed is US CPI
- Below is an example from the Metastock Xenith calendar.
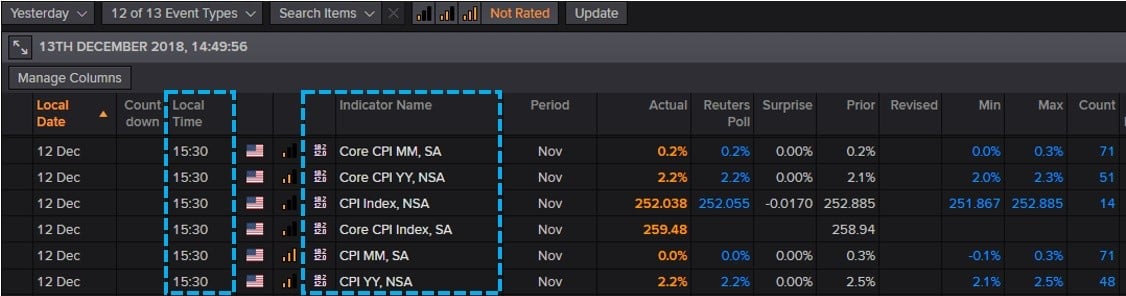
Both calendars provided the impacted currency and the event description. Also, note that the Xenith calendar offered a lot more data points compared to the others.
The free calendars only had the month over month numbers. This is one of the perks of having a subscription-based calendar.
They normally provide more data points and are quicker to release them.
How to know what the different indicators mean
But what about beginners who don’t know what the indicators mean. For those who are new to trading all the various indicators can be rather daunting.
Luckily, some economic calendar has that covered as well. Some of the calendars also provides detailed descriptions of the indicators.
This is a very helpful tool. Especially for beginner traders who are still learning. Let’s see what some of these detailed descriptions look like.
For this example, we have used US CPI as an example once more.
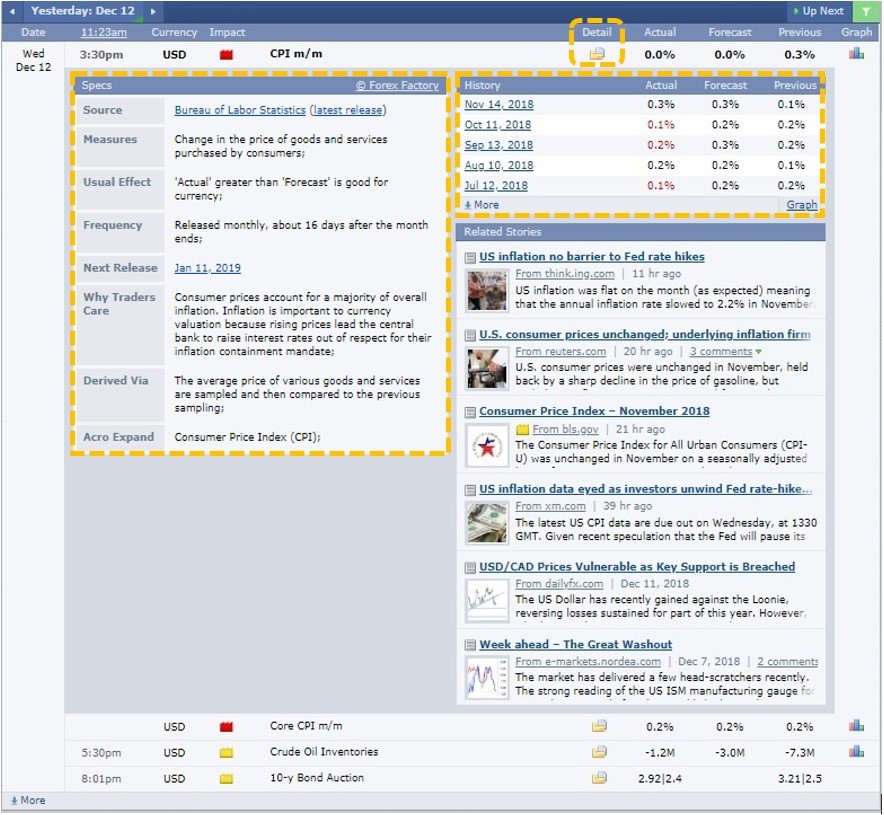
- Below is an example of a detailed description on the Forex Factory Calendar.
- Below is an example from the Metastock Xenith Calendar. This subscription-based calendar provides more info compared to the other two free versions.
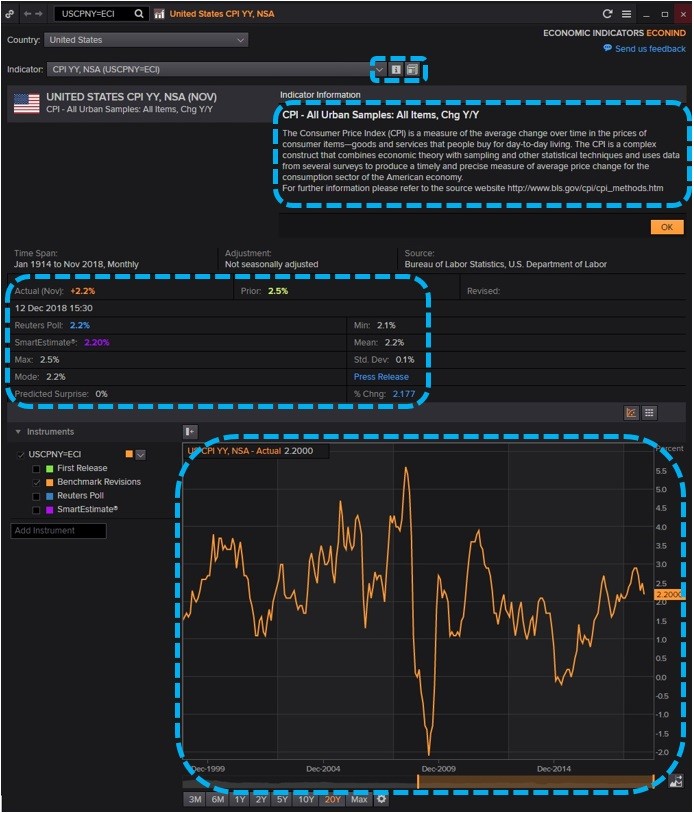
Both calendars provide great detailed information about the indicator.
The detail sections will usually provide the following helpful info:
- The agency or source that is providing the data
- It explains what the indicator is measuring
- Usually it also shows what type of impact the release has on the currency
- Some calendars provide the past historic data for the indicator
- It also shows when the next release is due
- Some will also provide a chart of the indicator as well.
In the above examples there was more information provided in the Xenith calendar. But as we mentioned, the subscription-based calendars usually have more info.
So, for a beginner, this type of information can be very helpful. If you are not sure what an indicator measures you can simply look at the details option on the calendars.
However, not all economic calendars have this detailed option available. Make sure to look for this when you are choosing a calendar for yourself.
How to know which economic events are important
There can be anything from 400 and 800 economic data points released every month. Furthermore, that is only for the G7 currencies.
To emphasize, there are roughly between 100 and 200 scheduled data points every week.
Are all the events and indicators important for trading? According the Investopedia, the answer is no.
Not every event on an economic calendar will be market-moving. This is where knowledge of the Fundamentals is helpful.
But don’t worry, even if you are new to fundamental analysis. The calendar can help.
Usually, economic calendars will have a section that shows an indicator’s volatility.
In other words, what the likely impact of the event will have on the markets. This is an essential part of the calendar.
Especially for beginners as it shows them which events are the most important. It narrows down the list to help us see which indicators to focus on.
So, let’s have a look at a few examples of how calendars display this info.
- The forex factory calendar below displays the impact in colors. Where red is high impact, orange is medium and yellow is low impact.
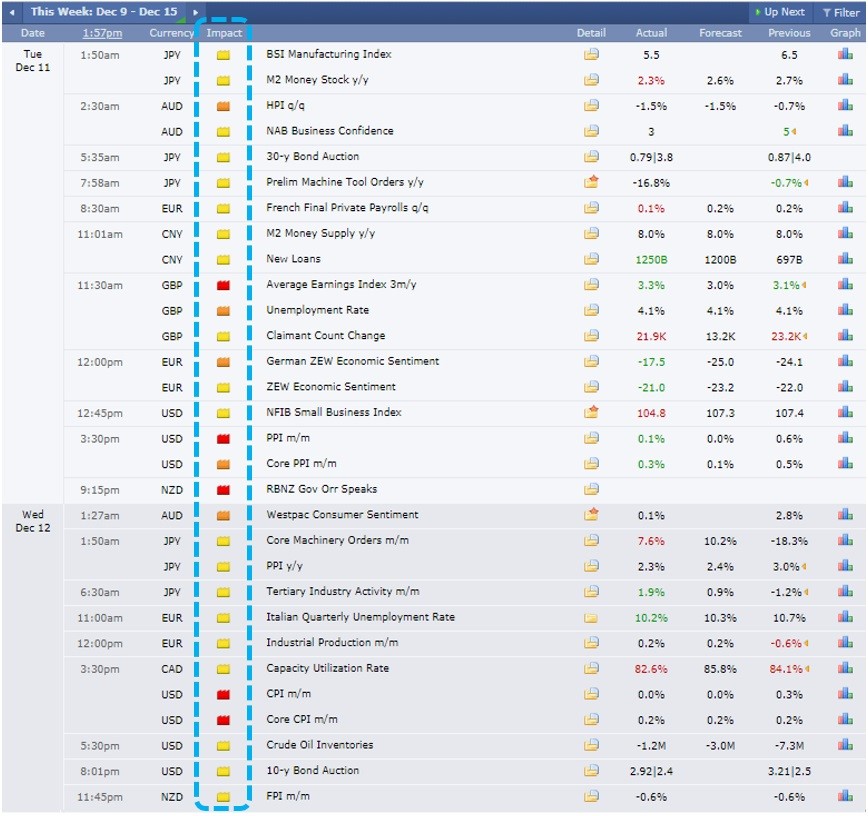
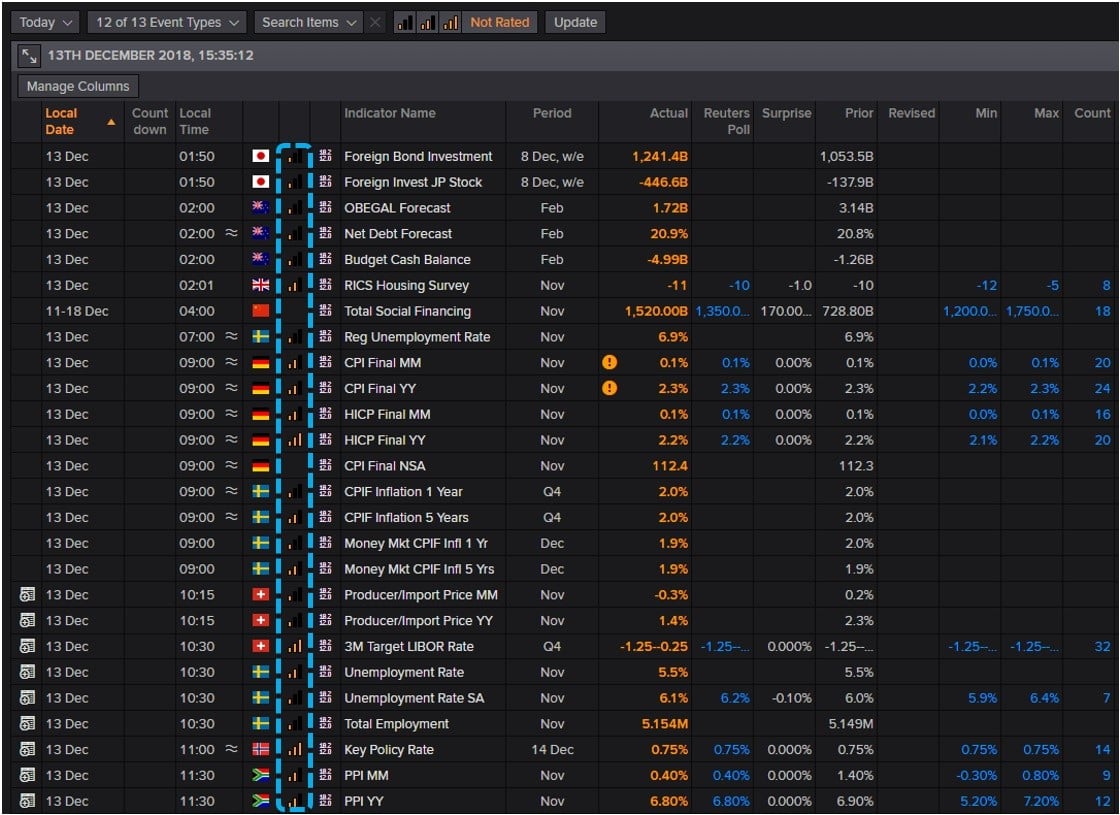
- Below is an example from the Metastock Xenith calendar. It displays the impact in bars.
As you can imagine, this can save a trader a lot of time during the day. Traders can plan their day to be present when the important events are released.
A word of caution with this though. These impact ratings are not perfect.
Some of the calendars are not always accurate with their impact ratios. A good example of this would be Euro Zone PMI releases.
According to the Forex Factory calendar these events have medium impact. This can be seen in the example below.
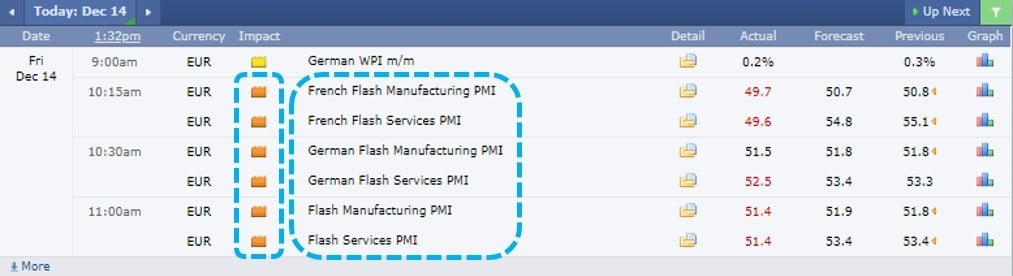
However, the PMI indicators are essential leading indicators. As a result, they can have a big impact on the markets. PMI data should be rated as a high-impact release. Do not always trust the impact ratings on their own.
Good Fundamental Analysis skills will help a great deal when it comes to this. Furthermore, not all news events will always have the same impact.
Sometimes the market will not react to high-impact news. At other times, low impact news can cause big moves in the markets.
In the following section we will explain why this happens.
How to know what markets are expecting from economic events
Markets don’t always react to high and low-impact news in the same way. The reason for this has to do with expectations.
Markets usually price in data points based on the forecasted outcome. As a result, what traders expect to happen is just as important as the event itself.
If economic data releases come out as expected the response can be muted. In contrast, big deviations between expectations and actual numbers can be market moving.
Whenever actual numbers differ a lot from expectations it can create trading opportunities. It’s this subtlety that can cause the impact of events to differ.
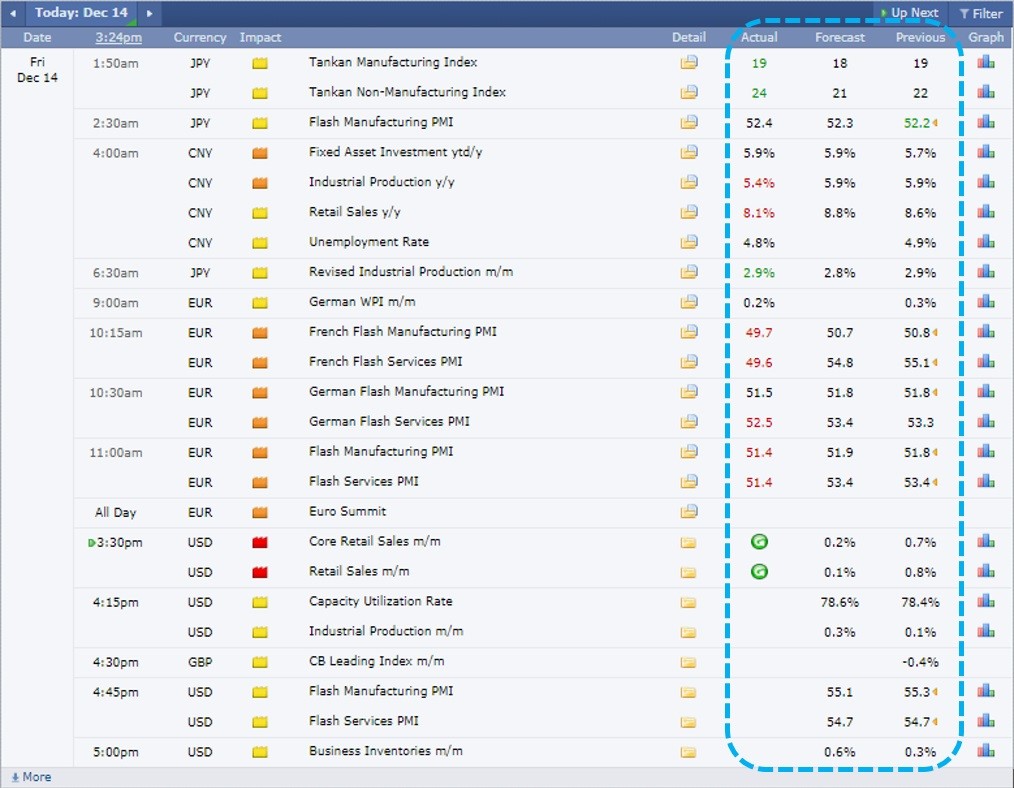
So, how can we see what markets are expecting from data releases? Most economic calendars will give us this information.
Majority of the calendars will provide the following information:
- What the previous release of the item was
- The market forecast for the upcoming release
- The actual data release number
Let’s look at a few examples below. The first example is the Forex Factory expectations section.
Subscription-based calendars often provide more information. For instance, the Metastock Xenith example below is a good example of this.

It also provides an estimate or poll of the event like the free versions. However, it also shows the Minimum and Maximum forecasts based on analyst surveys.
The minimum and maximum numbers are very important. They let us know when an event has deviated significantly from market expectations.
Above is an example how the Metastock calendar points out big deviations. Did you notice the lighting symbol next to some of the releases?
They show when actual numbers came in below the minimum or above the maximum forecasts. These can provide good trading opportunities.
Putting it all together
As shown above, there are many valuable uses for economic calendars. So, how do we go about putting all the info together?
Below we’ve highlighted a few key points to help with this.
1. Find an economic calendar you’re comfortable with
This should be a very easy first step. There are many different economic calendars available online.
Make sure to select one that has the features we mentioned above. Look for ones that offer more details.
2. Use the calendar to plan ahead
Don’t get blindsided by economic events. Make sure to plan your trading days with the help of the calendar.
If you are in trades double check to see if your trade is at risk with upcoming events. Also, make use of the market expectations and the fundamentals to plan future trades.
Economic data points can offer great trading opportunities. Especially, if the actual numbers deviate substantially from the forecasts.
3. Evaluate how markets react to news events to sharpen your skills
Practice your fundamental skills by analyzing how markets react to news events. Do research before events about what traders are expecting from data releases.
Why is the event important? What are market participants expecting from it?
How are traders likely to trade the event based on bit beats or misses? These are important questions to start with.
Then, see how the actual event differs from the market’s forecasts. Furthermore, read how analysts interpreted the actual data after it was released.
This will be a great way to sharpen your skills.
Summary
In this article we discussed how to understand an economic calendar.
In addition, we also provided some valuable uses for them. They are quintessential tools in a trader’s toolbox.
We would not advise that you try to trade without them. Also, don’t feel overwhelmed if you are new to economic calendars.
It will take time to develop the necessary skills to use these calendars profitably. However, once you get there it will be worth the time and effort.
We wish you all the best with your trading.
If you have any questions or comments, feel free to let us know in the comment box below.
Author Profile
Forex Source
When you understand why currencies move, you have more confidence in every trade you take.
Click here for the trade plan for this weeks economic calendar
Info
1554 Views 2 CommentsComments


Thanks for sharing!!
Table of Contents
Recent
-
Bitcoin Fundamental Briefing, March 2024 Demystifying Cryptocurrency Nodes: Deep Dive into Polygon Node Ecosystem Strategies for Trading Forex on a Budget Bitcoin Fundamental Briefing, February 2024 Bitcoin Fundamental Briefing, January 2024 Strategic Asset Allocation Techniques for Currency Traders Bitcoin Fundamental Briefing, December 2023 Bitcoin Fundamental Briefing, November 2023