How to select different chart types in MetaTrader 4
There are three main chart types: bar charts, candlestick charts, and line charts.
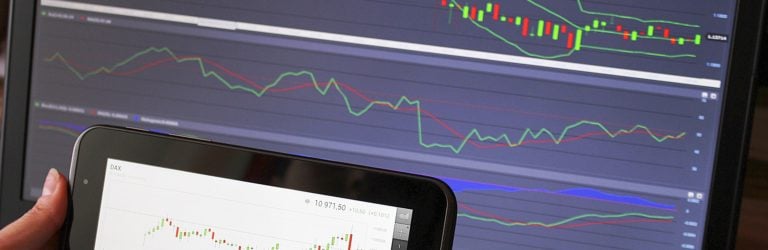
Bar charts in MetaTrader4
The bar chart is a type of chart that was mostly used by technical analysts before candlestick charts passed them in popularity. The “bar” depicts the price action using a single vertical bar to show the range of price action (price range between the high and low prices). It also has two short horizontal bars to the left and the right of the vertical bar, which represent the opening and closing prices.
The “bar” refers to the range of price for a specific time period (which could be M1, H1, H4, or any available time frame) as shown in the picture below. The highest tip of the bar is the highest price for the period while the lowest tip of the bar is the lowest price for the period in review.
The bar also has two short horizontal ticks that branch off to the left and right of the vertical bar. The short tick to the left is the opening price, while the short tick to the right is the closing price for the period under review.


To switch a chart to the bar chart type, press Alt + 1 or click on the designated bar chart icon as shown in the picture below.

Later in this article, I will discuss how you can customize the appearance of charts.
Candlestick charts in Metatrader4
Japanese candlestick charts, commonly known as candlestick charts, are a type of charts which were first used over two hundred of years ago in trading rice contracts in Japan. The candlesticks were believed to have been first developed by a Japanese rice trader known as Munehisa Homma in the mid 18th century.
The candlestick charts are named after their look; the price representation is done using icons that look like candlesticks. The picture below shows how a candlestick chart looks like using default MT4 settings.

Candlesticks are made up of two components.
- The body, which is shown by default on the MT4 platform to be either transparent or opaque (filled) against a black chart background. Color adjustments also commonly display them as black or white (on white colored charts) or as red and green on either black or white background charts.
- The shadow, which resembles the wick of a candle. There can be an upper or lower shadow, which is located either at the top or bottom of the body respectively.
On MT4, the transparent candle (which takes the color of the chart background) represents a bullish movement (closing price is above opening price) while opaque (filled) candles represent bearish movement (closing price is below opening price).
The tips of the wicks or shadows are formed when there is a differential between the opening and closing prices, and the high/low prices.
Where the high price is the same as the open/close price or the low price is the same as the open/close price, no wicks are formed.
The tips of the shadow indicate the highest and lowest price points of that particular candle. The upper shadow is located above the body, and its tip represents the highest price point.
The lower shadow is located below the body, and its lowest point represents the lowest price point.


To load candlestick charts, just press Alt + 2 or use the dedicated candle stick tab as shown below.

Line Charts in MetaTrader4
This type of chart is generated by using the current price and the last closing price. Line charts are mostly used to determine support and resistance zones and to determine the trend quickly.

To load a line chart, simply press Alt + 3 or use the dedicated line graph tab as shown below.

Outline:
- How to add or remove the grid
- How to add or remove horizontal and vertical lines and view the objects list
- How to use the crosshair
- How to select different chart types
- How to customize appearance of charts
- How to create a chart template
- How to load a chart template
- How to view and move between multiple charts
Author Profile

DIY Trading Expert
I used to have a column on a DIY blog for home improvement projects. There were some small problems with people misreading my directions. Furniture collapsed. Plumbing caught fire. Buildings fell over. A few people died in ways my lawyer won't let me talk about.
Now I spend my time figuring out how to do all those things that experts are supposed to know. Then I make simple step-by-step guides to each one.
No one who's followed my advice about how to do things in their FX trading platform has been killed, yet. It's a perfect record and I'm very proud of it.
Info
1125 Views 0 CommentsComments
Table of Contents
Recent
-
Bitcoin Fundamental Briefing, March 2024 Demystifying Cryptocurrency Nodes: Deep Dive into Polygon Node Ecosystem Strategies for Trading Forex on a Budget Bitcoin Fundamental Briefing, February 2024 Bitcoin Fundamental Briefing, January 2024 Strategic Asset Allocation Techniques for Currency Traders Bitcoin Fundamental Briefing, December 2023 Bitcoin Fundamental Briefing, November 2023