AceTraderFx Jun 25: Weekly/Daily Technical Outlook & Trading Ideals on GBP/USD

AceTraderFx Jun 2: Daily Technical Outlook & Trading GBP/USD

DAILY GBP/USD TECHNICAL OUTLOOK
Last Update At 02 Jun 2015 00:11GMT

Trend Daily Chart
Sideways

Daily Indicators
Turning down

21 HR EMA
1.5221

55 HR EMA
1.5261

Trend Hourly Chart
Down

Hourly Indicators
Rising fm o/s

13 HR RSI
40

14 HR DMI
-ve

Daily Analysis
Consolidation b4 further fall

Resistance
1.5386 - May 28 high
1.5343 - Last Fri's high
1.5272 - Y'day's hourly res

Support
1.5170 - Y'day's low
1.5165 - May 07 low
1.5088 - May 05 low

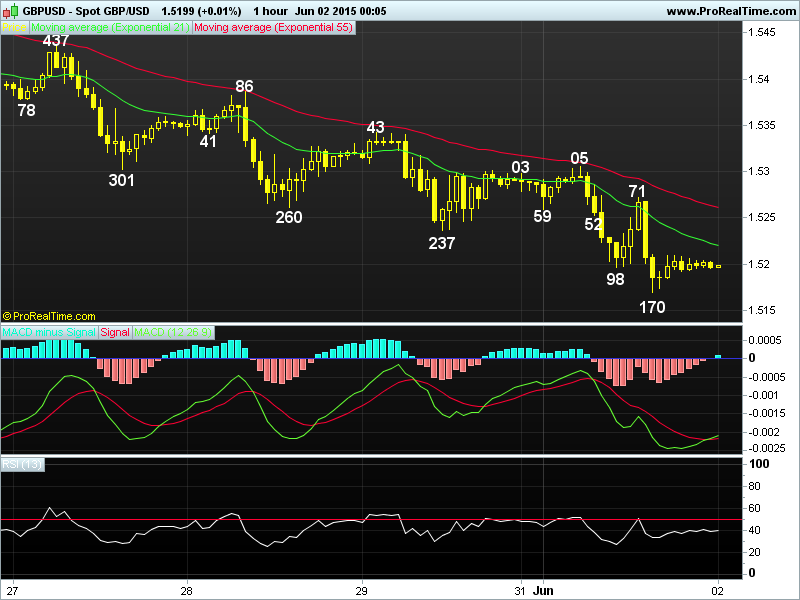
. GBP/USD - 1.5200.. Despite staging a brief bounce fm Asian low at 1.5259 to 1.5305 on Mon, the pound tumbled in Europe after release of downbeat U.K. mfg PMI. Cable dropped to 1.5197/98 b4 staging a short-covering rebound to 1.5272 but only to fall again to session lows of 1.5171 after upbeat U.S. mfg ISM.

. On the bigger picture, although cable's rally abv Apr's 1.5498 peak at 1.5498 to as high as 1.5815 in May confirms MT downtrend fm 2014 peak at 1.7192 has formed a temporary low at 1.4566, subsequent retreat n y'day's selloff to 1.5170 strongly suggests aforesaid corrective rise fm 1.4566 has ended n the 3-legged decline fm 1.5815 is en route to 1.5043 (being 61.8% r of the entire said rise fm 1.4566) later this week. Therefore, selling the pound on recovery in anticipation of further weakness to abovementioned target is favoured. Only abv y'day's high at 1.5305 wud violate recent series of lower highs n lower lows, then risk is seen for stronger rebound to 1.5343 n 1.5386 but last Wed's high at 1.5437 shud cap upside.

. Today, as current price is trading below the 21-hr n 55-hr emas, selling cable on recovery is recommended. Only abv 1.5305 signals low, 1.5343 n 1.5386.
GBP%20Jun%2002%281%29.png
 
Last edited by a moderator:
AceTraderFx Jun 8: Weekly Technical Outlook & Trading USD/JPY


WEEKLY USD/JPY TECHNICAL OUTLOOK
Last Update At 07 Jun 2015 23:22GMT

Trend Daily Chart
Up

Daily Indicators
Rising

21 HR EMA
125.31

55 HR EMA
124.74

Trend Hourly Chart
Up

Hourly Indicators
Easing fm o/bot

13 HR RSI
74

14 HR DMI
+ve

Daily Analysis
Consolidation b4 uptrend resumes

Resistance
126.65 - 61.8% proj. of 123.79-125.86 fm 125.37
126.48 - 2 times ext. of 118.88-121.49 fm 120.64
125.86 - Last Fri's near 13-year peak

Support
125.07 - Last Tue's high (now sup)
124.68 - Last Last Wed & Thur's high (now sup)
124.23 - Hoyrly sup

. USD/JPY - 125.65.. Although dlr continued its recent streak last week n climbed to a 12-1/2 year peak of 125.07 Tue, rally in eur/usd led to broad-based weakness in usd to 123.75, price then chopped inside a sideways range b4 rallying to a near 13-year high of 125.86 after robust U.S. jobs data on Fri.

. On the bigger picture, dlr's resumption of uptrend fm 2011 record low of 75.32 to 125.86 last Fri suggests price is now en route twd 126.48 later this week, this is 2 times extension of intermediate rise fm 118.88-121.49 measured fm 120.64, current rising daily technical indicators add credence to this view. Having said that, abv 126.65 needed to retain bullisness for further headway twd 127.37, this is 100% proj. of 121.45-125.07 measured fm 123.75. Therefore, buying dlr on dips for gain to indicated upside targets is the way to go n only a daily close below 125.07 confirms temporary top is made, then risk is seen for a much-needed correction to 124.23 but reckon 123.75/79 shud remain intact.

. Today, expect initial sideways tradng below said Fri's 125.86 high wud take place in Asia b4 prospect of marginal rise, o/bot readings on hourly indicators shud cap dlr below 126.48 n yield correction.
JPYJun%2008.png
 
Last edited by a moderator:
AceTraderFx Jul 29: Daily Technical Outlook & Trading GBP/USD

DAILY GBP/USD TECHNICAL OUTLOOK
Last Update At 29 Jul 2015 00:34GMT

Trend Daily Chart
Sideways

Daily Indicators
Neutral

21 HR EMA
1.5595

55 HR EMA
1.5572

Trend Hourly Chart
Near term up

Hourly Indicators
Rising

13 HR RSI
57

14 HR DMI
+ve

Daily Analysis
Consolidation with upside bias

Resistance
1.5676 - Jul 15 high
1.5647 - Last Wed's high
1.5628 - Y'day's high

Support
1.5528 - Y'day's low
1.5490 - Mon's low
1.5467 - Last Fri's low

. GBP/USD - 1.5609 ... Cable swung fm loss to gain in choppy Tue trading. Price fell at European open to 1.5528 on cross-selling in sterling but upbeat UK GDP triggered aggressive short-covering to 1.5618, then later to 1.5628 in NY.

. On the bigger picture, although early selloff fm Jun's 7-month peak at 1.5930 to 1.5330 in Jul confirms MT upmove fm 2015 bottom at 1.4566 (Apr) has made a top there as this high was accompanied by 'bearish divergences' on the daily indicators, subsequent strg bounce to 1.5676 n then the 2-week broad sideways swings suggest further choppy consolidation would continue, perhaps the upcoming FOMC statements n Thur's first reading of the key U.S. GDP may help cable stage a 'breakout' of its near term established 1.5676-1.5467 range. Abv previous strg res at 1.5671/76 would shift risk to the upside for gain to 1.5701 (61.8% r of 1.59360-1.5330) but abv pivotal res at 1.5789 needed to bring a retest of 1.5930 in Aug. a daily close below 1.5467 would shift risk to downside n yield weakness twd 1.5330 next week.

. Today, as current price is trading abv 21-hr & 55-hr emas, buying on dips is favoured but 1.5676 may hold. Below 1.5674 would yield 1.5528, 1.5490.
GBP%20Wed%282%29.png
 
Last edited by a moderator:
AceTraderFx Nov 18: Daily Technical & Trading Outlook GBP/USD

flag_gbp.gif
DAILY GBP/USD TECHNICAL OUTLOOK
Last Update At 18 Nov 2015 00:17GMT

Trend Daily Chart
Down

Daily Indicators
Bullish convergences

21 HR EMA
1.5208

55 HR EMA
1.5205

Trend Hourly Chart
Sideways

Hourly Indicators
Rising

13 HR RSI

56

14 HR DMI
+ve

Daily Analysis
One more rise b4 strg retreat

Resistance
1.5302 - 61.8% proj. of 1.5027-1.5265 fm 1.5155
1.5265 - Last Fri's high
1.5247 - Last Thur's high

Support
1.5182 - Mon's low
1.5155 - Y'day's low
1.5133 - Last Wed's European low

. GBP/USD - 1.5217... The British pound fell in tandem with euro to session lows of 1.5155 in European morning on Tue b4 rebounding to 1.5217 after inline UK inflation data, price later climbed to 1.5239 n NY b4 retreating.

. On the bigger picture, although cable's break of Sep/Oct's low at 1.5107 to 1.5027 in the 1st week of Nov signals correction fm 2015 near 5-year low at 1.4566 (Apr) has ended earlier at 1.5930 (May) n weakness to 1.4966, then 1.4827
would be seen, being 70.7% n 80.9% retracements respectively of aforesaid upmove fm 1.4566 to 1.5930. Having said that, last week's stronger-than-expected rise to 1.5265 suggests decline fm 1.5930 (Jun) has made a temporary low n 1.5295/00 needs to hold for prospect of another fall. Abv 1.5300 would risk stronger correction to 1.5335 but 1.5372 (38.2% r of 1.5930 to 1.5027) should remain intact.

. Today, cable's rally fm y'day's 1.5155 to as high as 1.5239 suggests pull back fm 1.5265 (Fri) has ended n said corrective rise fm 1.5027 may resume, abv 1.5242/47 would confirm this view, however, as hourly indicators would display 'bearish divergences' on next rise, reckon 1.5302 would cap upside n yield strg retracement of indicated upmove fm 1.5027 later.
GBP%20Nov%2018.png
 
Back
Top