Sive Morten
Special Consultant to the FPA
- Messages
- 18,681
Fundamentals
This week we do not have new driving factors for gold market, action was relatively narrow, as gold was struggling overbought condition for the whole week, but overbought wins and gold turns to deeper retracement.
Reuters reports that gold prices fell on Friday on a slight recovery in equities markets and Treasury yields but was on track for a fourth-straight monthly gain as fears of a global recession and uncertainty on U.S.-China trade relations drove investors to safe havens.
The market is awaiting news on the trade front, said Suki Cooper, precious metals analyst at Standard Chartered Bank.
“At the moment, gold market is focused on impact in terms of global growth and whether we’ll continue to see central banks around the world easing monetary policy,” Cooper added.
Chinese and U.S. trade negotiating teams are maintaining effective communication, a day after both sides discussed the next round of in-person negotiations in September, China’s foreign ministry said on Friday.
On Thursday, China’s commerce ministry said a September round of meetings was being discussed by the two sides, but added it was important for Washington to cancel a tariff increase.
Positive signs on the trade front also lifted world stocks to a one-week high, limiting bullion’s upside.
“Gold will have a very high beta to any reduction in trade tensions given that they have driven so much of its rally,” OANDA analyst Jeffrey Halley wrote in a note.
Escalation in the trade war between the world’s biggest economies and heightened fears over a global downturn contributed to a rise of more than $100 for gold in August.
A recent inversion of the U.S. yield curve, where short-dated yields are running above long-dated ones, has also unsettled investors as it often precedes a recession.
Meanwhile, the U.S. Federal Reserve and the European Central bank are widely expected to cut rates next month to stimulate their economies.
CFTC data shows that net long speculative position still stands near the top. It means that current action has not triggered yet massive profit taking and investors treat this pullback as short-term

Source: cftc.gov
Charting by Investing.com
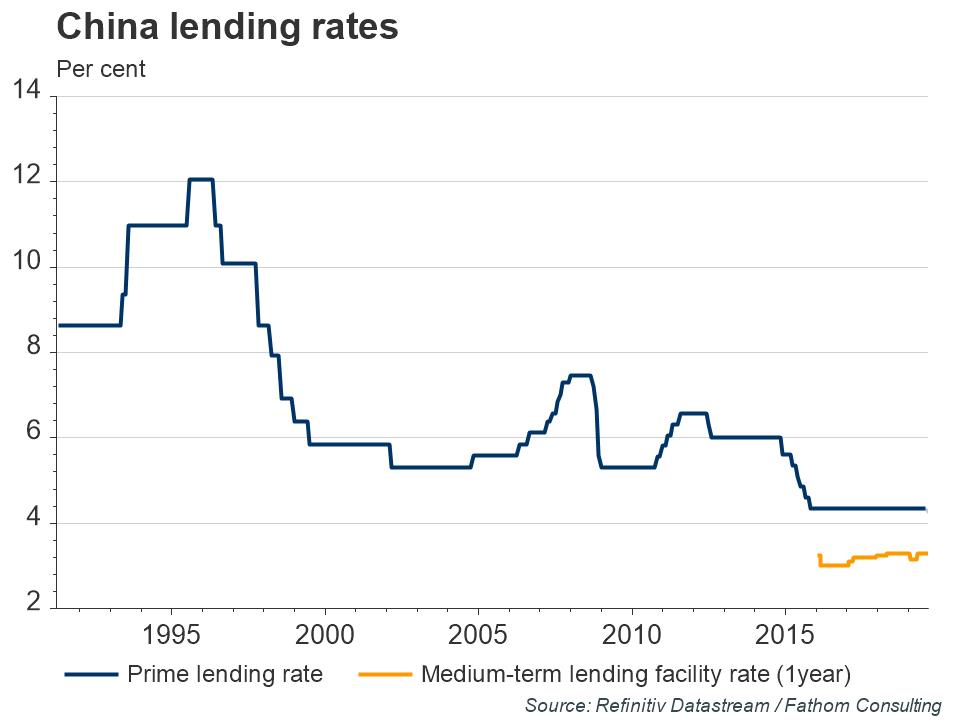
As the economy slows and the proportion of loss-making firms rises, China reformed one of its lending rates — the Loan Prime Rate (LPR) — earlier this month. The new LPR is based on the average of 18 banks’ submissions, excluding the highest and lowest. These submissions are to be based on “adding a few basis points to the interest rate of open market operations (mainly referring to the rate of the medium-term lending facility).” The PBoC stipulated that new bank loans should be priced in line with the LPR to help push borrowing costs down towards the medium-term lending facility rate. This will shift the blue line closer to the orange line in the chart below, as borrowers gain access to loan rates which more closely reflect the funding conditions of the banking system, regardless of their creditworthiness. This is just one tactic, among many, that China is using to combat the impact of Donald Trump’s trade tariffs.
Technical
Monthly
Gold market starts confirmation of our major resistance area showing inability to break it immediately.
Area of major 5/8 Fib resistance level at 1585 and monthly Overbought, accompanied by butterfly extension create solid barrier on a way up. Thus, although XOP target probably will be reached some day, but now odds suggest retracement.
Thus, we still keep this area - 1530-1585 as tactical ceil at current moment and expect that gold will show healthy retracement out there by fundamental reasons that we've mentioned.
Butterfly target has been hit relatively fast. Pattern itself suggests 3/8 retracement as minimal target. Hardly butterfly will fail as it is accompanied by Overbought and major Fib resistance level.

Weekly
Last week we've mentioned two other extensions that stand in the same monthly area. This is larger AB-CD and minor ab-cd patterns. Both of them have XOPs in the same area - 1555-1570, which agrees with our monthly range.
Gold was able to hit major XOP, while keeps minor one intact. Although we see started pullback down, out from major XOP - it doesn't lead to appearing of clear patterns yet. The only pattern that we could mention here is DiNapoli bearish "Kibby trade" as combination of overbought and major extension target. This pattern suggests retracement on daily chart, but it is not necessary that it should be deep, as it works in the same manner as "Stretch" pattern - combination of overbought and Fib level.
Thus, we need to keep an eye on patterns on lower time frame. Moderate retracement on monthly/weekly chart has to have solid background and clear strong reversal patterns on daily. If we will get nothing of this kind - it could mean that gold tends to go higher again.

Daily
On daily chart we indeed have some bearish signs, but they are not strong enough yet for position taking. Thus, our bearish divergence finally has been confirmed as trend has turned bearish, price drops back in High Wave pattern's range, market has formed minor reversal session on top and theoretically price could drop to 1495 area - daily oversold and nearest 3/8 Fib support level.
The thing that makes situation uneasy is too slow downside action. It is easy to recognize here potential H&S pattern and theoretically, we could take position now trying to anticipate drop to 1495, but with slow action, I would suggest it is better to sell on the right arm's top when head will be in place already. Because slow action keeps door open for upside continuation and it is more risky to sell now, despite better price level. For example, market could form 3-Drive "Sell" instead, trying to reach final weekly XOP target.

Intraday
On intraday charts action mostly is based on recent butterfly that has been completed in the beginning of the week. In fact, you could recognize two pattern, as right wing of large butterfly is another smaller 1.618 butterfly as well. Anyway, downside action is started and it takes the shape of AB-CD pattern, which is "222" Buy.

Right now it is unclear yet where downside action could stop. Now it stands at K-support area which was not broken, OP target and take a look - has formed minor butterfly "Buy" pattern, while on Friday morning it was just the bearish flag, as we've mentioned it.

Of course, we could talk on some trading here, but everyone who intends to trade gold market on intraday charts has to understand the risk. Trading right now cares more risk as market stands in reaction on overbought, but at the same time, this reaction is not strong enough and upside action could continue at any time. Safer way is to wait for big pattern on daily chart. If you want to trade anyway right now - try to stick with some patterns, at least. For example, here, on 1H chart this is bullish setup that lets to place very tight stop just below 1516 area. At least it cares very small, limited risk potential.
Conclusion
Fundamental and long-term technical analysis shows that gold keeps long-term bullish sentiment, but odds on moderate retracement becomes greater day by day.
The technical portion of Sive's analysis owes a great deal to Joe DiNapoli's methods, and uses a number of Joe's proprietary indicators. Please note that Sive's analysis is his own view of the market and is not endorsed by Joe DiNapoli or any related companies.
This week we do not have new driving factors for gold market, action was relatively narrow, as gold was struggling overbought condition for the whole week, but overbought wins and gold turns to deeper retracement.
Reuters reports that gold prices fell on Friday on a slight recovery in equities markets and Treasury yields but was on track for a fourth-straight monthly gain as fears of a global recession and uncertainty on U.S.-China trade relations drove investors to safe havens.
The market is awaiting news on the trade front, said Suki Cooper, precious metals analyst at Standard Chartered Bank.
“At the moment, gold market is focused on impact in terms of global growth and whether we’ll continue to see central banks around the world easing monetary policy,” Cooper added.
Chinese and U.S. trade negotiating teams are maintaining effective communication, a day after both sides discussed the next round of in-person negotiations in September, China’s foreign ministry said on Friday.
On Thursday, China’s commerce ministry said a September round of meetings was being discussed by the two sides, but added it was important for Washington to cancel a tariff increase.
Positive signs on the trade front also lifted world stocks to a one-week high, limiting bullion’s upside.
“Gold will have a very high beta to any reduction in trade tensions given that they have driven so much of its rally,” OANDA analyst Jeffrey Halley wrote in a note.
Escalation in the trade war between the world’s biggest economies and heightened fears over a global downturn contributed to a rise of more than $100 for gold in August.
A recent inversion of the U.S. yield curve, where short-dated yields are running above long-dated ones, has also unsettled investors as it often precedes a recession.
Meanwhile, the U.S. Federal Reserve and the European Central bank are widely expected to cut rates next month to stimulate their economies.
CFTC data shows that net long speculative position still stands near the top. It means that current action has not triggered yet massive profit taking and investors treat this pullback as short-term
Source: cftc.gov
Charting by Investing.com
As the economy slows and the proportion of loss-making firms rises, China reformed one of its lending rates — the Loan Prime Rate (LPR) — earlier this month. The new LPR is based on the average of 18 banks’ submissions, excluding the highest and lowest. These submissions are to be based on “adding a few basis points to the interest rate of open market operations (mainly referring to the rate of the medium-term lending facility).” The PBoC stipulated that new bank loans should be priced in line with the LPR to help push borrowing costs down towards the medium-term lending facility rate. This will shift the blue line closer to the orange line in the chart below, as borrowers gain access to loan rates which more closely reflect the funding conditions of the banking system, regardless of their creditworthiness. This is just one tactic, among many, that China is using to combat the impact of Donald Trump’s trade tariffs.
Technical
Monthly
Gold market starts confirmation of our major resistance area showing inability to break it immediately.
Area of major 5/8 Fib resistance level at 1585 and monthly Overbought, accompanied by butterfly extension create solid barrier on a way up. Thus, although XOP target probably will be reached some day, but now odds suggest retracement.
Thus, we still keep this area - 1530-1585 as tactical ceil at current moment and expect that gold will show healthy retracement out there by fundamental reasons that we've mentioned.
Butterfly target has been hit relatively fast. Pattern itself suggests 3/8 retracement as minimal target. Hardly butterfly will fail as it is accompanied by Overbought and major Fib resistance level.
Weekly
Last week we've mentioned two other extensions that stand in the same monthly area. This is larger AB-CD and minor ab-cd patterns. Both of them have XOPs in the same area - 1555-1570, which agrees with our monthly range.
Gold was able to hit major XOP, while keeps minor one intact. Although we see started pullback down, out from major XOP - it doesn't lead to appearing of clear patterns yet. The only pattern that we could mention here is DiNapoli bearish "Kibby trade" as combination of overbought and major extension target. This pattern suggests retracement on daily chart, but it is not necessary that it should be deep, as it works in the same manner as "Stretch" pattern - combination of overbought and Fib level.
Thus, we need to keep an eye on patterns on lower time frame. Moderate retracement on monthly/weekly chart has to have solid background and clear strong reversal patterns on daily. If we will get nothing of this kind - it could mean that gold tends to go higher again.
Daily
On daily chart we indeed have some bearish signs, but they are not strong enough yet for position taking. Thus, our bearish divergence finally has been confirmed as trend has turned bearish, price drops back in High Wave pattern's range, market has formed minor reversal session on top and theoretically price could drop to 1495 area - daily oversold and nearest 3/8 Fib support level.
The thing that makes situation uneasy is too slow downside action. It is easy to recognize here potential H&S pattern and theoretically, we could take position now trying to anticipate drop to 1495, but with slow action, I would suggest it is better to sell on the right arm's top when head will be in place already. Because slow action keeps door open for upside continuation and it is more risky to sell now, despite better price level. For example, market could form 3-Drive "Sell" instead, trying to reach final weekly XOP target.
Intraday
On intraday charts action mostly is based on recent butterfly that has been completed in the beginning of the week. In fact, you could recognize two pattern, as right wing of large butterfly is another smaller 1.618 butterfly as well. Anyway, downside action is started and it takes the shape of AB-CD pattern, which is "222" Buy.
Right now it is unclear yet where downside action could stop. Now it stands at K-support area which was not broken, OP target and take a look - has formed minor butterfly "Buy" pattern, while on Friday morning it was just the bearish flag, as we've mentioned it.
Of course, we could talk on some trading here, but everyone who intends to trade gold market on intraday charts has to understand the risk. Trading right now cares more risk as market stands in reaction on overbought, but at the same time, this reaction is not strong enough and upside action could continue at any time. Safer way is to wait for big pattern on daily chart. If you want to trade anyway right now - try to stick with some patterns, at least. For example, here, on 1H chart this is bullish setup that lets to place very tight stop just below 1516 area. At least it cares very small, limited risk potential.
Conclusion
Fundamental and long-term technical analysis shows that gold keeps long-term bullish sentiment, but odds on moderate retracement becomes greater day by day.
The technical portion of Sive's analysis owes a great deal to Joe DiNapoli's methods, and uses a number of Joe's proprietary indicators. Please note that Sive's analysis is his own view of the market and is not endorsed by Joe DiNapoli or any related companies.