Sive Morten
Special Consultant to the FPA
- Messages
- 18,706
Fundamentals
(Reuters) The U.S. dollar rebounded from nearly eight-week lows against the euro and Swiss franc on Friday a day after a top Federal Reserve official joined a growing chorus signaling support for a U.S. interest rate hike in coming months.
San Francisco Fed President John Williams on Thursday said that, if the U.S. central bank waited too long to raise rates, it could be costly for the economy and that a possible rate hike in September should be in play.
Those comments added to statements perceived as hawkish from New York Fed President William Dudley and Atlanta Fed President Dennis Lockhart in recent days. They also came after an essay Williams published this week calling for a recalibration of the Fed's long-term goals, which had fueled some speculation that the Fed would not raise rates this year.
"Williams's yesterday reversed people’s interpretation of his comments earlier in the week," said Ian Gordon, FX strategist at Bank of America Merrill Lynch in New York. "It increased the implied probability of hikes."
While the dollar index, which measures the greenback against a basket of six major rivals, was last up 0.37 percent at 94.508 .DXY, it remained on track for a 1.3 percent decline for the week given the earlier skepticism over a 2016 Fed rate hike. That would mark its second straight week of losses.
Federal funds futures on Friday suggested traders saw a 53.5 percent chance of a Fed rate hike this year, according to CME Group's FedWatch program. Investors were also awaiting the Fed's annual conference in Jackson Hole, Wyoming next week.
Analysts also said traders were likely taking profits on short bets against the dollar on nervousness about having bets against the U.S. currency ahead of the weekend.
"The dollar had taken a pretty big tumble in the first part of this week, so people had gotten short the dollar and now they're just buying back," said Greg Anderson, global head of foreign exchange strategy at BMO Capital Markets in New York.
The euro was last down 0.3 percent against the dollar at $1.1319 , below a nearly eight-week high of $1.1365 touched Thursday. The dollar was up 0.6 percent against the Swiss franc at 0.9599 franc after hitting a low of 0.9532 Thursday.
Against the yen, the dollar was last up 0.36 percent at 100.22 yen, but was set for its fourth straight week of losses against the yen.
The US pulls ahead
by Fantom Consulting
Despite a weaker-than-expected advance estimate of Q2 GDP growth, we remain upbeat about the US economy. Strong non-farm payrolls data for June and July confirm that May’s figure was a ‘blip’, with the three-month moving average back within a whisker of 200,000. That is well above the neutral level, with payroll gains in excess of 60,000 resulting in a tightening of the US labour market. We believe that the US is very close to full employment, and that wage growth will accelerate before long, putting upward pressure on core inflation. Consequently, US breakevens still look cheap to us.

In our central scenario, this forces the Federal Reserve’s hand, resulting in a 25 basis point increase in the federal funds rate later this year. A December tightening now looks more likely than September. We expect at least two more rate hikes in 2017. This is less than implied by the FOMC’s latest summary of economic projections, but more than investors expected at the time of writing.

we argued that low interest rates were holding back growth in productive potential by preventing the gales of creative destruction. We stand by that view, and implore Janet Yellen and her team to begin the process of interest rate normalisation in earnest. Bizarrely, a Trump victory may lend a helping hand, with his proposed fiscal stimulus easing the burden on monetary policy. Elsewhere, the policy mix has already begun to shift, with China leading the way.
COT Report
As we do not have yet data for last week, when most strong action has happened, but even on data that we have, we could make some concusions. Take a look that net short position is contracted 4 weeks in a row. In first 2 weeks this was mostly due closing of the shorts, because, as you can see net short position was reducing as well as open interest. Last week, net short position contracted more than open interest. It means that some new long positions were opened. Next week probably we will see brighter signs of this tendency. In general these changes suggest moderate bullish sentiment.

Technicals
Monthly
Recent action doesn't have strong impact on monthly chart by far, still it could change the shape of the chart. Although as July as August months right now are inside ones to June "high wave" candle, upward action, if it will continue further could change short term targets. Still, currently this action can't change long term bearish picture still.
Upside rally of most recent weeks could make an impact on reversal candle in May and could trigger action to YPR1 - that's what see right now.
Currently EUR stands at rather strong support area. This is lower border of downward channel and all-time 5/8 Fib support. Here EUR has formed Butterfly "buy" and it has reached first 1.27 extension here.
EUR is forming typical reversal candle in May. Price has moved above April top and closed below April's lows. It could not get extended continuation, but usually market shows downward continuation within next 1-3 candles.
Sometimes reversal candles lead to collapse, as it was on EUR around 1.40 area. Thrust down has started particularly by reversal candle in March 2014.
Speaking on big scale bearish signs, we have these ones:
EUR was not able to reach YPR1 and returned right back down to YPP, and now even stands slightly below it. This is bearish sign. Following this logic next destination could be YPS1 right around parity and 1.618 butterfly target. This is just another destination point that we have here.
That's being said, appearing of reversal candle brings nothing good to bulls. Currently we can't precisely forecast the consequences of its appearing, but even minor results will bring 1-2 months of downward action inside current 1.04 -1.15 consolidation... Although potential bearish impact could be even stronger.
Finally we have another bearish sign that looks like bearish dynamic pressure. Take a look that although trend holds bullish - market shows inablitity to move up, even from strong support area. Next strong support stands precisely at parity and will become a culmination of downward action, since this level includes support line, YPS1 and butterfly 1.618 target. Brexit results hardly will bring prosperity to EU and probably will become another bearish driving factor for EUR.
Right now as you can see, downward action (after May reversal candle has been formed) is interrupted and EUR has turned up. Our task is to find out what this upward action is, what to watch for and what targets to expect. The most important level that will determine everything is a top of reversal swing. If this top will be taking out - market could reach YPR1 or even higher levels (as butterfly "Sell" could be formed).
Conversely, downward butterflies are possible, until market stands below 1.16 highs.

Weekly
Weekly charts becomes very important for EUR, because it also breaks normal bearish market mechanics. One example of this we have seen 2 weeks ago on daily chart, when we have put the start our upside trading on EUR. Here we have similar signs but of a bigger scale, since this is weekly time frame.
As you can see EUR has not dropped lower right to 1.05 lows as it should for normal bearish behavior, but stopped precisely at 5/8 Fib support. Previously we've mentioned that EUR keeps small downward swings equality very accurate, and if it breaks it - it should double it down, as it was on a way from 1.17 to 1.05 lows.
But this has not happened, instead of that EUR has formed "222" Buy pattern. It has not doubled downward swing, but formed AB-CD retracement instead. Thus, weekly chart suggests next target around 1.16 top. This is minor 0.618 AB-CD extension. Other targets stand above OB level, so they are not really interesting to us by far.
Second moment - is a trend line. On Brext voting EUR has broken it down, but take a look what is going on right now - it is returning right back above it. Trend has turned bullish on weekly chart. Currently it is still flirting with the line, but if it will show true return back - this will be strong bullish sign that will bring a lot of confidence with upside continuation.
That's being said, weekly chart shows initial signs of cracking short-term bearish tendency. Here we do not talk on some global trend shifitng, but current action brings perspectives of moving to 1.16 top. As soon as this target will be hit - we will turn to next one...

Daily
So, on weekly chart we've estimated nearest upside target and here you can see "222" Buy setup that we've mentioned above.
Now it is a question how particularly it could be reached. I've drawn one of possible scenarios on daily picture. Trend is strongly bullish here, market right now stands at 5/8 Fib resistance. Also, as we've estimated on Fri, EUR has completed 1.618 butterfly target (not shown here).
Actually here we could get just two possible ways of upside breakout to 1.16 top. First one I'm putting here. This could be reverse H&S pattern. Upside breakout of Brexit range could become some problem for EUR, that's why we do not exclude deep retracement, before EUR will challenge Brexit candle top. This, in turn, will give us reverse H&S shape. Its target will lead market precisely to 1.16 level.
Another scenario is immediate upside action after breakout of Brexit candle range. But since OB level stands relatively close and market has intraday important target on a way up, this scenario, looks less probable, until it will be driven but some extraordinary events or news...

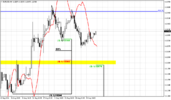
4-hour
Here we have another reasons why reverse H&S pattern on daily chart is more probable. Take a look that right around brexit candle top we have major 1.618 AB-CD target and WPR1. These combination increases chances on deep retracement before upside breakout will happen. Fib level that I've put on the chart, guys, are based not at current top but on 1.618 target, so they are slightly higher than should be, based on current market.
At the same time, deep retracement prior 1.618 target will be hit hardly will happen. That's why, in the beginning of the week, EUR could test WPP then continue move to major target:

Conclusion:
Last time we've said that support where market stands on monthly chart is very long-term and wide. Standing there could last for months or even years, and may be sometime upward action will happen there. And right now we see some hints on minor upward action. Still on a big scale EUR shows mostly bearish signs. Currently we can't talk on some very extended targets and better to treat current splash as tactical retracement yet.
In shorter -term perspective on Monday we expect testing of WPP and upside continuation to 1.618 target. After that we will see whether EUR will realise our setup for reverse H&S pattern or take immediate breakout of Brexit candle top. Our major target right now is 1.1615 area.
The technical portion of Sive's analysis owes a great deal to Joe DiNapoli's methods, and uses a number of Joe's proprietary indicators. Please note that Sive's analysis is his own view of the market and is not endorsed by Joe DiNapoli or any related companies.
(Reuters) The U.S. dollar rebounded from nearly eight-week lows against the euro and Swiss franc on Friday a day after a top Federal Reserve official joined a growing chorus signaling support for a U.S. interest rate hike in coming months.
San Francisco Fed President John Williams on Thursday said that, if the U.S. central bank waited too long to raise rates, it could be costly for the economy and that a possible rate hike in September should be in play.
Those comments added to statements perceived as hawkish from New York Fed President William Dudley and Atlanta Fed President Dennis Lockhart in recent days. They also came after an essay Williams published this week calling for a recalibration of the Fed's long-term goals, which had fueled some speculation that the Fed would not raise rates this year.
"Williams's yesterday reversed people’s interpretation of his comments earlier in the week," said Ian Gordon, FX strategist at Bank of America Merrill Lynch in New York. "It increased the implied probability of hikes."
While the dollar index, which measures the greenback against a basket of six major rivals, was last up 0.37 percent at 94.508 .DXY, it remained on track for a 1.3 percent decline for the week given the earlier skepticism over a 2016 Fed rate hike. That would mark its second straight week of losses.
Federal funds futures on Friday suggested traders saw a 53.5 percent chance of a Fed rate hike this year, according to CME Group's FedWatch program. Investors were also awaiting the Fed's annual conference in Jackson Hole, Wyoming next week.
Analysts also said traders were likely taking profits on short bets against the dollar on nervousness about having bets against the U.S. currency ahead of the weekend.
"The dollar had taken a pretty big tumble in the first part of this week, so people had gotten short the dollar and now they're just buying back," said Greg Anderson, global head of foreign exchange strategy at BMO Capital Markets in New York.
The euro was last down 0.3 percent against the dollar at $1.1319 , below a nearly eight-week high of $1.1365 touched Thursday. The dollar was up 0.6 percent against the Swiss franc at 0.9599 franc after hitting a low of 0.9532 Thursday.
Against the yen, the dollar was last up 0.36 percent at 100.22 yen, but was set for its fourth straight week of losses against the yen.
The US pulls ahead
by Fantom Consulting
Despite a weaker-than-expected advance estimate of Q2 GDP growth, we remain upbeat about the US economy. Strong non-farm payrolls data for June and July confirm that May’s figure was a ‘blip’, with the three-month moving average back within a whisker of 200,000. That is well above the neutral level, with payroll gains in excess of 60,000 resulting in a tightening of the US labour market. We believe that the US is very close to full employment, and that wage growth will accelerate before long, putting upward pressure on core inflation. Consequently, US breakevens still look cheap to us.
In our central scenario, this forces the Federal Reserve’s hand, resulting in a 25 basis point increase in the federal funds rate later this year. A December tightening now looks more likely than September. We expect at least two more rate hikes in 2017. This is less than implied by the FOMC’s latest summary of economic projections, but more than investors expected at the time of writing.
we argued that low interest rates were holding back growth in productive potential by preventing the gales of creative destruction. We stand by that view, and implore Janet Yellen and her team to begin the process of interest rate normalisation in earnest. Bizarrely, a Trump victory may lend a helping hand, with his proposed fiscal stimulus easing the burden on monetary policy. Elsewhere, the policy mix has already begun to shift, with China leading the way.
COT Report
As we do not have yet data for last week, when most strong action has happened, but even on data that we have, we could make some concusions. Take a look that net short position is contracted 4 weeks in a row. In first 2 weeks this was mostly due closing of the shorts, because, as you can see net short position was reducing as well as open interest. Last week, net short position contracted more than open interest. It means that some new long positions were opened. Next week probably we will see brighter signs of this tendency. In general these changes suggest moderate bullish sentiment.
Technicals
Monthly
Recent action doesn't have strong impact on monthly chart by far, still it could change the shape of the chart. Although as July as August months right now are inside ones to June "high wave" candle, upward action, if it will continue further could change short term targets. Still, currently this action can't change long term bearish picture still.
Upside rally of most recent weeks could make an impact on reversal candle in May and could trigger action to YPR1 - that's what see right now.
Currently EUR stands at rather strong support area. This is lower border of downward channel and all-time 5/8 Fib support. Here EUR has formed Butterfly "buy" and it has reached first 1.27 extension here.
EUR is forming typical reversal candle in May. Price has moved above April top and closed below April's lows. It could not get extended continuation, but usually market shows downward continuation within next 1-3 candles.
Sometimes reversal candles lead to collapse, as it was on EUR around 1.40 area. Thrust down has started particularly by reversal candle in March 2014.
Speaking on big scale bearish signs, we have these ones:
EUR was not able to reach YPR1 and returned right back down to YPP, and now even stands slightly below it. This is bearish sign. Following this logic next destination could be YPS1 right around parity and 1.618 butterfly target. This is just another destination point that we have here.
That's being said, appearing of reversal candle brings nothing good to bulls. Currently we can't precisely forecast the consequences of its appearing, but even minor results will bring 1-2 months of downward action inside current 1.04 -1.15 consolidation... Although potential bearish impact could be even stronger.
Finally we have another bearish sign that looks like bearish dynamic pressure. Take a look that although trend holds bullish - market shows inablitity to move up, even from strong support area. Next strong support stands precisely at parity and will become a culmination of downward action, since this level includes support line, YPS1 and butterfly 1.618 target. Brexit results hardly will bring prosperity to EU and probably will become another bearish driving factor for EUR.
Right now as you can see, downward action (after May reversal candle has been formed) is interrupted and EUR has turned up. Our task is to find out what this upward action is, what to watch for and what targets to expect. The most important level that will determine everything is a top of reversal swing. If this top will be taking out - market could reach YPR1 or even higher levels (as butterfly "Sell" could be formed).
Conversely, downward butterflies are possible, until market stands below 1.16 highs.
Weekly
Weekly charts becomes very important for EUR, because it also breaks normal bearish market mechanics. One example of this we have seen 2 weeks ago on daily chart, when we have put the start our upside trading on EUR. Here we have similar signs but of a bigger scale, since this is weekly time frame.
As you can see EUR has not dropped lower right to 1.05 lows as it should for normal bearish behavior, but stopped precisely at 5/8 Fib support. Previously we've mentioned that EUR keeps small downward swings equality very accurate, and if it breaks it - it should double it down, as it was on a way from 1.17 to 1.05 lows.
But this has not happened, instead of that EUR has formed "222" Buy pattern. It has not doubled downward swing, but formed AB-CD retracement instead. Thus, weekly chart suggests next target around 1.16 top. This is minor 0.618 AB-CD extension. Other targets stand above OB level, so they are not really interesting to us by far.
Second moment - is a trend line. On Brext voting EUR has broken it down, but take a look what is going on right now - it is returning right back above it. Trend has turned bullish on weekly chart. Currently it is still flirting with the line, but if it will show true return back - this will be strong bullish sign that will bring a lot of confidence with upside continuation.
That's being said, weekly chart shows initial signs of cracking short-term bearish tendency. Here we do not talk on some global trend shifitng, but current action brings perspectives of moving to 1.16 top. As soon as this target will be hit - we will turn to next one...
Daily
So, on weekly chart we've estimated nearest upside target and here you can see "222" Buy setup that we've mentioned above.
Now it is a question how particularly it could be reached. I've drawn one of possible scenarios on daily picture. Trend is strongly bullish here, market right now stands at 5/8 Fib resistance. Also, as we've estimated on Fri, EUR has completed 1.618 butterfly target (not shown here).
Actually here we could get just two possible ways of upside breakout to 1.16 top. First one I'm putting here. This could be reverse H&S pattern. Upside breakout of Brexit range could become some problem for EUR, that's why we do not exclude deep retracement, before EUR will challenge Brexit candle top. This, in turn, will give us reverse H&S shape. Its target will lead market precisely to 1.16 level.
Another scenario is immediate upside action after breakout of Brexit candle range. But since OB level stands relatively close and market has intraday important target on a way up, this scenario, looks less probable, until it will be driven but some extraordinary events or news...
4-hour
Here we have another reasons why reverse H&S pattern on daily chart is more probable. Take a look that right around brexit candle top we have major 1.618 AB-CD target and WPR1. These combination increases chances on deep retracement before upside breakout will happen. Fib level that I've put on the chart, guys, are based not at current top but on 1.618 target, so they are slightly higher than should be, based on current market.
At the same time, deep retracement prior 1.618 target will be hit hardly will happen. That's why, in the beginning of the week, EUR could test WPP then continue move to major target:
Conclusion:
Last time we've said that support where market stands on monthly chart is very long-term and wide. Standing there could last for months or even years, and may be sometime upward action will happen there. And right now we see some hints on minor upward action. Still on a big scale EUR shows mostly bearish signs. Currently we can't talk on some very extended targets and better to treat current splash as tactical retracement yet.
In shorter -term perspective on Monday we expect testing of WPP and upside continuation to 1.618 target. After that we will see whether EUR will realise our setup for reverse H&S pattern or take immediate breakout of Brexit candle top. Our major target right now is 1.1615 area.
The technical portion of Sive's analysis owes a great deal to Joe DiNapoli's methods, and uses a number of Joe's proprietary indicators. Please note that Sive's analysis is his own view of the market and is not endorsed by Joe DiNapoli or any related companies.
")