Sive Morten
Special Consultant to the FPA
- Messages
- 18,771
Fundamentals
This week provides a lot of information, mostly political, on EUR and GBP which we have to consider as it has primary impact on our fundamental background and long-term view. It is impossible to put in single report, so tomorrow we skip Gold update but focus on GBP. Today, as usual, let's talk on EUR.
Speaking briefly, last week we've got some EU statistics that was important and pushed EUR lower and some information from ECB on its QE programme.
As Reuters reports - the euro was pinned at more than two-year lows on Friday as a steady drip of negative economic data this week sapped investor demand for the single currency while the dollar benefited from some quarter-end rebalancing flows.
Dismal business activity data from the euro area, especially powerhouse economy Germany at the start of the week, has pushed European bond yields lower across the board this week with concerns about a weak economy in Britain also weighing.
“We have had a steady drip of weak data from the eurozone this week and that is highlighting the differences between the U.S. and Europe (that' what FPA talks about for a long time) where the former is still showing signs of strength,” said Thu Lan Nguyen, an analyst at Commerzbank.
Negative interest rates, quantitative easing and other attempts by the European Central Bank (ECB) to stimulate the euro zone economy are also making investment in U.S. government debt more attractive and boosting the greenback against the euro.
“The more recent drift lower in the euro seems to be perpetuated by the continued grind lower in growth expectations, and certainly in realized growth in the euro zone,” said Mazen Issa, senior FX strategist at TD Securities in New York.
Further ECB stimulus, negative rates and bond buying are also exerting a pull on the euro, he added.
The euro dropped as low as $1.0903, its lowest since May 2017, in overnight trading before rising back to $1.0938.
The single currency has technical support around $1.0925, which could provide a floor for the time being.
“We did break below that briefly yesterday, but that was late trading in New York, and so I think there is going to be quite a bit of hesitance to try to push it below that on a sustainable basis,” Issa said, noting that quarter-end rebalancing is also limiting risk taking.
U.S. data might give a further boost to the broadly firm dollar with personal income and consumption data due later in the trading day. Both indicators are expected to show improved readings, signaling an economy broadly impervious to global trade tensions.
Strong data in the United States has pushed an economic surprise data index published by Citigroup to its highest since February 2018.
In comparison, a similar index on Europe has fallen dramatically in recent days, signaling slowing economic activity.
We will talk about it tomorrow, but sterling was the other big loser in London trading after Bank of England policymaker Michael Saunders hinted at looser monetary policy if Brexit uncertainty remained prolonged against a backdrop of disappointing global growth.
Markets are also digesting the impeachment probe launched into U.S. President Donald Trump and the latest headlines from the trade dispute between the United States and China.
A whistleblower report released on Thursday said Trump not only abused his office in attempting to solicit Ukraine’s interference in the 2020 U.S. election, but the White House tried to “lock down” evidence about it.
China’s top diplomat said Beijing was willing to buy more U.S. products. CNBC reported that trade war talks were on track and scheduled for Oct. 10-11 in Washington, citing people familiar with the arrangements.
The European Central Bank said on Friday it would start publishing quarterly data about any intervention in the foreign exchange market, adding that the only instances to date dated back to 2000 and 2011.
“As of April 2020 the ECB will start publishing FXI (foreign exchange interventions) data,” the ECB said in a press release. “The table on the website will be updated quarterly, with a delay of one quarter, even if there has been no foreign exchange intervention during the period.”
EUR CFTC data doesn't show big difference. After solid increase of net short position two weeks ago - it has decreased a bit this week, but it looks more like "retracement" after the drop:

Source: CFTC.gov
Charting by Investing.com
Another interesting thing is markets stubbornly expect another rate cut in November-December. J. Powell has tried to explain market within two previous meetings that this is not the fact by making rhetoric tighter on possible rate cut, but it seems that market still believes...
Meantime recent update on EU economy sentiment by Fathom consulting confirms the cornerstone of our long-term fundamental view - growing disbalance of EU and US economy conditions.
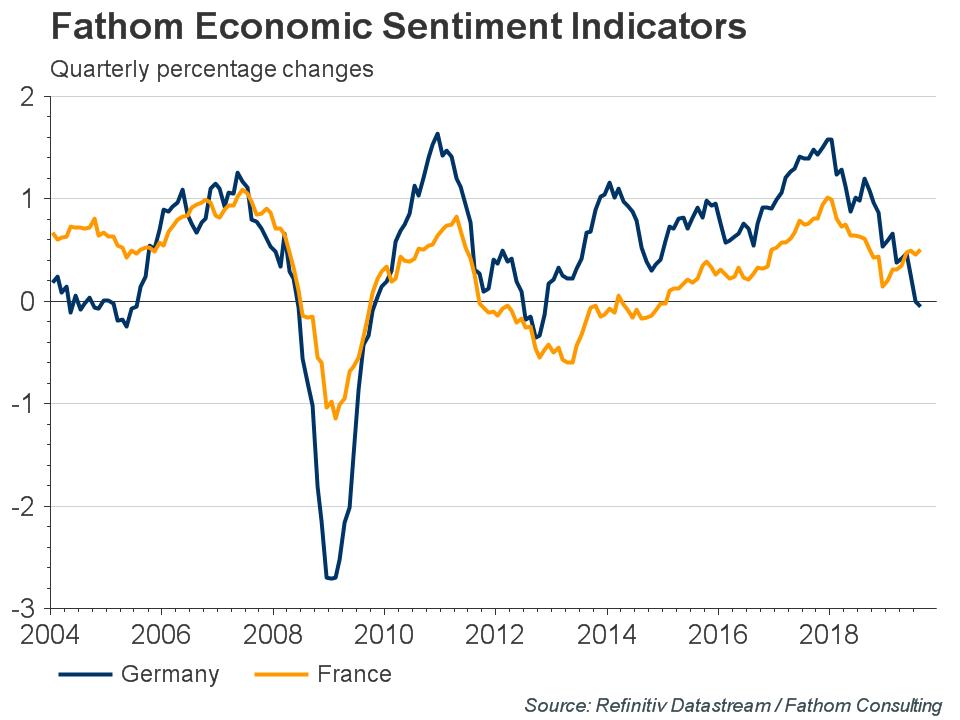
In their last report "Trading places – France emerges from Germany’s shadow", Fathom shows that situation in Germany is becoming worse:
Fathom’s Economic Sentiment Indicators (ESIs) distil information contained within numerous consumer and business surveys into composite measures of underlying sentiment. Over the past six years, sentiment in Germany has consistently been above France. Therefore, it is notable that in March the French ESI moved above the German ESI. The divergence in sentiment continued in August with Fathom’s German and French ESIs at -0.1% and 0.5% respectively.
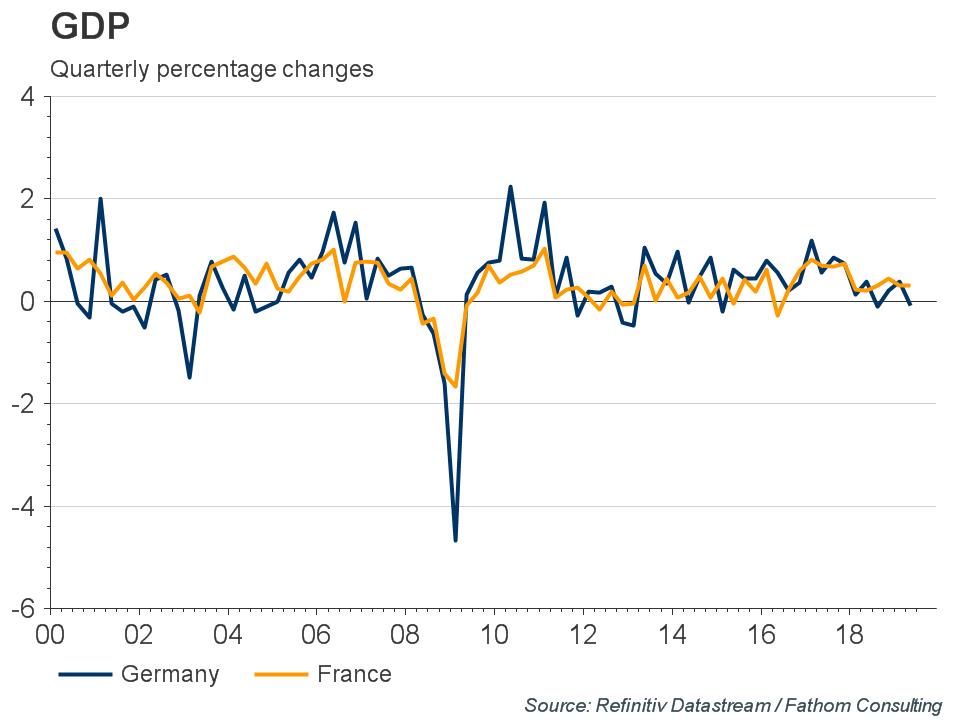
With a larger share of output produced in the manufacturing sector and a larger share of this output being exported, Germany is more exposed to fluctuations in global economic activity.
Recent weakness in global trade, particularly in autos, has been the main factor contributing to Germany’s slowdown in growth. GDP growth has averaged 0.1% over the last four quarters. But the impact on France, which is more service sector oriented, has been less pronounced, with GDP growth averaging 0.3% over the last four quarters.
It is not clear how France’s economy will develop in the longer term. In order to maintain that economy’s recent performance, the French labour market will need to become more flexible. Since July 2008, unemployment has been higher in France than in Germany, and the gap between the two has been increasing. Emmanuel Macron has attempted to combat this, starting in 2017 with the announcement of labour market reforms to support France’s small businesses. The reforms decentralised the collective bargaining process for smaller businesses and reduced the legal costs of dismissing employees by placing a cap on compensation for unfair dismissal. It is too soon to judge their success, but Emmanuel Macron will be hoping that they will be as successful as the German ‘Hartz reforms’ in the early 2000s. German unemployment is now at a record low level of 3%.
Even if these reforms are successful, France’s economy has further long-term problems to overcome. Government debt is still at an elevated level while the budget has been in a primary deficit since 2002. This contrasts with ample fiscal space in Germany with government debt at around 68% and a primary surplus since 2011. While low rates have eased the burden of interest payments on new French government debt, there are questions over the country’s ability to provide fiscal stimulus in the next economic downturn.
Meanwhile, the opposite problem is plaguing Germany. With ample fiscal space, the government have appeared unwilling to renege on their ‘Schwarze Null’ balanced budget policy that prevents their deficit from exceeding 0.35% of GDP. However, there have been suggestions that the government may attempt to use a ‘shadow budget’ to circumvent national debt rules.
Finally, we would like to make short comments on US/China trade war. Take a look what Chinese minister said above:"China’s top diplomat said Beijing was willing to buy more U.S. products."
Why? Fathom gives the answer - "Rising pork prices in China squeeze piggy banks"
Since the start of the year, China has been plagued by rising food prices, which has largely been attributed to an outbreak of African swine fever, an incurable pig virus. This has resulted in a shortage of pigs, which has pushed up pork prices.
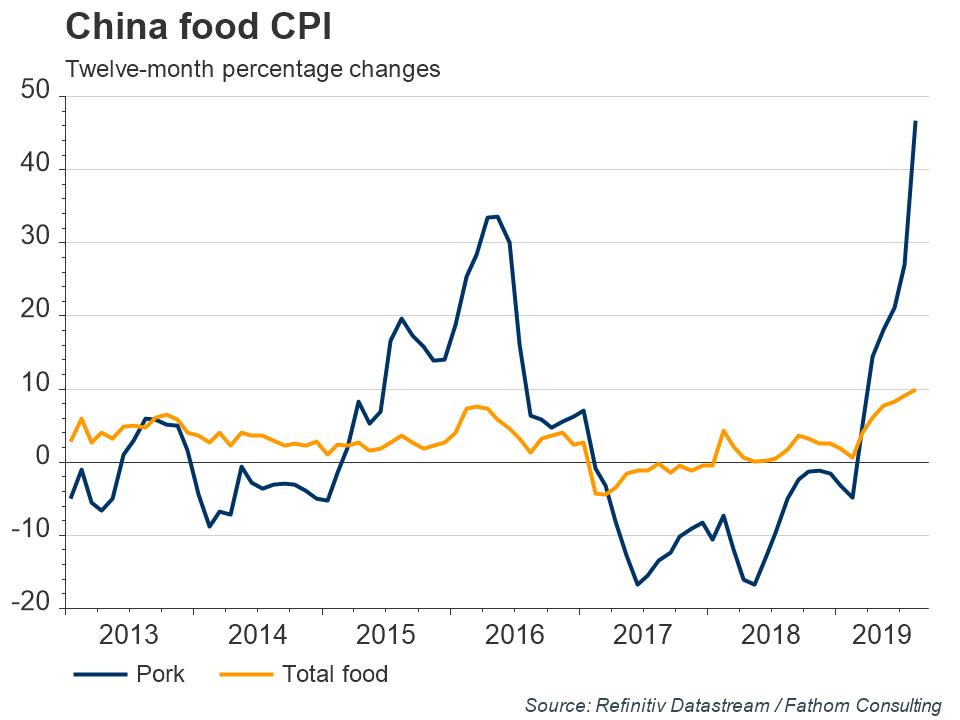
Since pork is a staple of many Chinese citizens’ diets, and is estimated to make up a large proportion of the consumer basket, this has had a knock-on effect on consumer prices. The CPI for food increased by 10% in August, relative to the previous year’s price. It is not just pork that has been affected, China has also seen an increase in the prices of fish, lamb and beef, as demand grows from consumers seeking cheaper alternatives to pork.
US exports huge amount of food products to China. Mostly this is grain & seeds that takes large part of total export, in a row with aircraft goods. But, China takes ~ 50% of total US pork export:
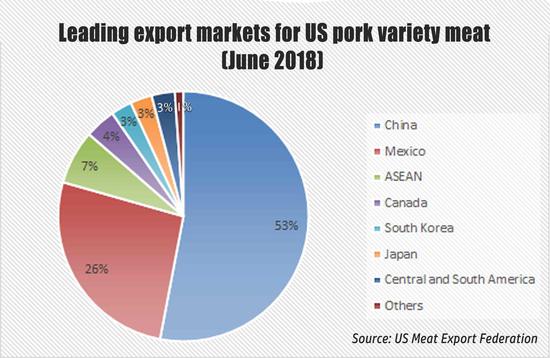
We even do not talk about poultry and beef. Taking "2+2" it is very easy to resolve this riddle. China buys a lot of food in US, so US takes in their hands, at some degree, of course, but still - the social situation in China. Food is most socially sensitive export cluster. In current situation, imposing tariffs make US foods more expensive to population, triggering inflation.
Taking in consideration weak social protection of majority of population - this could be very sensitive problem, especially in social sphere. Thus, situation comes to US victory in tariffs war... We talked about it since it has started.
Speaking in general on recent events - they mostly confirm our major long-term driving factor, which is disproportion of US and EU economy conditions. It will stay for a long time and continue to drive EUR/USD ratio down. By talking more extended view in the future, we treat the probability as "high" that US will turn with tariffs to EU when China surrender.
Technicals
Monthly
September is close to an end and it becomes the clone of August month. Attempt of pullback meets additional sell-off. As on August as on September we have long upper shadows on candles. Market right now stands at crucial area from technical point of view. This is the middle of the range and YPS1. Once EUR will break it - road to the bottom of the range around 1.03 area will be opened.
Overall tendency still stands moderately bearish, as by price action as by MACD trend. In September EUR forms new low, keeping "lower top - lower bottom" sequence.
As we've said earlier, here we could recognize downside narrow channel and market stands accurately inside of it.
Neither big support nor oversold levels stand around and it is free space till 1.03 lows. The only support is YPS1 and middle of the range. That's major technical support here.

Weekly
We keep weekly chart comments without a change as well. Market has to break out from current range to add something new as to monthly as to weekly time frames. The only new thing that we could say is "acceleration". Usually when market tests the tension of the bulls, creeping slowly down - it lasts till the first signs of acceleration. It will be fatal for EUR and become the harbinger of collapse.
This week data has not enough power to complete the breakout and price holds inside the channel by far, despite breakout of major 5/8 Fib support of 1.1185.
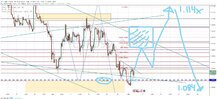
Technically previous upward action was reaction on COP target, and downside action that we see right now should be continuation of major tendency to the next target, which is OP at 1.05 area. Now downward action is held by Yearly Pivot Support 1 and channel's border. Once response will be over, we will keep an eye on downside continuation. EUR has pretty much room to fluctuate inside the channel as upper border stands around 1.13 area. To break the bearish context EUR has to climb above 1.14 top.

Daily
Here we already talked about possible new setup - 3-Drive pattern. In general, 1.0850-1.0880 area is a cluster of different targets. Here we also have AB=CD OP target, our 3-Drive consists of two side-by-side butterflies, and their extension agreement fits perfect to 3-Drive conditions.
This level is also daily oversold. As it has not been reached on Friday, we should wait for it on next week. Still, 3-Drive pattern is tricky. Although it is reliable enough, especially in a company of OS level, when it fails - it fails miserably. In a case of 1.0850 breakout it could be miserable plunge down. Because this is also crucial area on monthly chart, as we've said.
Thus, we have to be careful to nuances of price action on intraday charts. First we need clear bullish reversal pattern somewhere around 1.0850. Once it will be formed - we could take long position, but also be on guard to any signs of failure as it could be fatal for 3-Drive pattern.
Theoretical target of the pattern is the top between 2nd and 3rd drives, which is above 1.11.

Intraday
At first glance it seems that it is already time to consider bullish reversal patterns. But we start to do it only after reaching major daily targets. Here, on 4H chart our XOP and butterfly extension has to be reached. So, scalp traders still have some room for fast bearish trade:

On hourly chart we do not have something special, only Fib levels and no clear patterns. Divergence exists so, may be EUR will be able to climb slightly higher, to K-resistance area. Anyway we focus on daily 3-Drive pattern and mostly watch when market triggers it. Here, if you still would like to use "last chance" to sell, wait for bearish patterns such as "222" Sell, or maybe Agreement resistance will be formed around K-area.

Conclusion:
Recent events, news, statistics tell that major fundamental background stands the same, and investors start to talk about the same thing - EU and US economy divergence. So, we keep our long-term bearish view intact.
In a shorter term, market stands at vital area from technical point of view, forming potentially bullish reversal pattern on daily chart. But the trick is whether this pattern will work or not. It is big chance on fast action whatever direction will be set and very probable that it will be some external political or economical impact.
The technical portion of Sive's analysis owes a great deal to Joe DiNapoli's methods, and uses a number of Joe's proprietary indicators. Please note that Sive's analysis is his own view of the market and is not endorsed by Joe DiNapoli or any related companies.
This week provides a lot of information, mostly political, on EUR and GBP which we have to consider as it has primary impact on our fundamental background and long-term view. It is impossible to put in single report, so tomorrow we skip Gold update but focus on GBP. Today, as usual, let's talk on EUR.
Speaking briefly, last week we've got some EU statistics that was important and pushed EUR lower and some information from ECB on its QE programme.
As Reuters reports - the euro was pinned at more than two-year lows on Friday as a steady drip of negative economic data this week sapped investor demand for the single currency while the dollar benefited from some quarter-end rebalancing flows.
Dismal business activity data from the euro area, especially powerhouse economy Germany at the start of the week, has pushed European bond yields lower across the board this week with concerns about a weak economy in Britain also weighing.
“We have had a steady drip of weak data from the eurozone this week and that is highlighting the differences between the U.S. and Europe (that' what FPA talks about for a long time) where the former is still showing signs of strength,” said Thu Lan Nguyen, an analyst at Commerzbank.
Negative interest rates, quantitative easing and other attempts by the European Central Bank (ECB) to stimulate the euro zone economy are also making investment in U.S. government debt more attractive and boosting the greenback against the euro.
“The more recent drift lower in the euro seems to be perpetuated by the continued grind lower in growth expectations, and certainly in realized growth in the euro zone,” said Mazen Issa, senior FX strategist at TD Securities in New York.
Further ECB stimulus, negative rates and bond buying are also exerting a pull on the euro, he added.
The euro dropped as low as $1.0903, its lowest since May 2017, in overnight trading before rising back to $1.0938.
The single currency has technical support around $1.0925, which could provide a floor for the time being.
“We did break below that briefly yesterday, but that was late trading in New York, and so I think there is going to be quite a bit of hesitance to try to push it below that on a sustainable basis,” Issa said, noting that quarter-end rebalancing is also limiting risk taking.
U.S. data might give a further boost to the broadly firm dollar with personal income and consumption data due later in the trading day. Both indicators are expected to show improved readings, signaling an economy broadly impervious to global trade tensions.
Strong data in the United States has pushed an economic surprise data index published by Citigroup to its highest since February 2018.
In comparison, a similar index on Europe has fallen dramatically in recent days, signaling slowing economic activity.
We will talk about it tomorrow, but sterling was the other big loser in London trading after Bank of England policymaker Michael Saunders hinted at looser monetary policy if Brexit uncertainty remained prolonged against a backdrop of disappointing global growth.
Markets are also digesting the impeachment probe launched into U.S. President Donald Trump and the latest headlines from the trade dispute between the United States and China.
A whistleblower report released on Thursday said Trump not only abused his office in attempting to solicit Ukraine’s interference in the 2020 U.S. election, but the White House tried to “lock down” evidence about it.
China’s top diplomat said Beijing was willing to buy more U.S. products. CNBC reported that trade war talks were on track and scheduled for Oct. 10-11 in Washington, citing people familiar with the arrangements.
The European Central Bank said on Friday it would start publishing quarterly data about any intervention in the foreign exchange market, adding that the only instances to date dated back to 2000 and 2011.
“As of April 2020 the ECB will start publishing FXI (foreign exchange interventions) data,” the ECB said in a press release. “The table on the website will be updated quarterly, with a delay of one quarter, even if there has been no foreign exchange intervention during the period.”
EUR CFTC data doesn't show big difference. After solid increase of net short position two weeks ago - it has decreased a bit this week, but it looks more like "retracement" after the drop:
Source: CFTC.gov
Charting by Investing.com
Another interesting thing is markets stubbornly expect another rate cut in November-December. J. Powell has tried to explain market within two previous meetings that this is not the fact by making rhetoric tighter on possible rate cut, but it seems that market still believes...
Meantime recent update on EU economy sentiment by Fathom consulting confirms the cornerstone of our long-term fundamental view - growing disbalance of EU and US economy conditions.
In their last report "Trading places – France emerges from Germany’s shadow", Fathom shows that situation in Germany is becoming worse:
Fathom’s Economic Sentiment Indicators (ESIs) distil information contained within numerous consumer and business surveys into composite measures of underlying sentiment. Over the past six years, sentiment in Germany has consistently been above France. Therefore, it is notable that in March the French ESI moved above the German ESI. The divergence in sentiment continued in August with Fathom’s German and French ESIs at -0.1% and 0.5% respectively.
With a larger share of output produced in the manufacturing sector and a larger share of this output being exported, Germany is more exposed to fluctuations in global economic activity.
Recent weakness in global trade, particularly in autos, has been the main factor contributing to Germany’s slowdown in growth. GDP growth has averaged 0.1% over the last four quarters. But the impact on France, which is more service sector oriented, has been less pronounced, with GDP growth averaging 0.3% over the last four quarters.
It is not clear how France’s economy will develop in the longer term. In order to maintain that economy’s recent performance, the French labour market will need to become more flexible. Since July 2008, unemployment has been higher in France than in Germany, and the gap between the two has been increasing. Emmanuel Macron has attempted to combat this, starting in 2017 with the announcement of labour market reforms to support France’s small businesses. The reforms decentralised the collective bargaining process for smaller businesses and reduced the legal costs of dismissing employees by placing a cap on compensation for unfair dismissal. It is too soon to judge their success, but Emmanuel Macron will be hoping that they will be as successful as the German ‘Hartz reforms’ in the early 2000s. German unemployment is now at a record low level of 3%.
Even if these reforms are successful, France’s economy has further long-term problems to overcome. Government debt is still at an elevated level while the budget has been in a primary deficit since 2002. This contrasts with ample fiscal space in Germany with government debt at around 68% and a primary surplus since 2011. While low rates have eased the burden of interest payments on new French government debt, there are questions over the country’s ability to provide fiscal stimulus in the next economic downturn.
Meanwhile, the opposite problem is plaguing Germany. With ample fiscal space, the government have appeared unwilling to renege on their ‘Schwarze Null’ balanced budget policy that prevents their deficit from exceeding 0.35% of GDP. However, there have been suggestions that the government may attempt to use a ‘shadow budget’ to circumvent national debt rules.
Finally, we would like to make short comments on US/China trade war. Take a look what Chinese minister said above:"China’s top diplomat said Beijing was willing to buy more U.S. products."
Why? Fathom gives the answer - "Rising pork prices in China squeeze piggy banks"
Since the start of the year, China has been plagued by rising food prices, which has largely been attributed to an outbreak of African swine fever, an incurable pig virus. This has resulted in a shortage of pigs, which has pushed up pork prices.
Since pork is a staple of many Chinese citizens’ diets, and is estimated to make up a large proportion of the consumer basket, this has had a knock-on effect on consumer prices. The CPI for food increased by 10% in August, relative to the previous year’s price. It is not just pork that has been affected, China has also seen an increase in the prices of fish, lamb and beef, as demand grows from consumers seeking cheaper alternatives to pork.
US exports huge amount of food products to China. Mostly this is grain & seeds that takes large part of total export, in a row with aircraft goods. But, China takes ~ 50% of total US pork export:
We even do not talk about poultry and beef. Taking "2+2" it is very easy to resolve this riddle. China buys a lot of food in US, so US takes in their hands, at some degree, of course, but still - the social situation in China. Food is most socially sensitive export cluster. In current situation, imposing tariffs make US foods more expensive to population, triggering inflation.
Taking in consideration weak social protection of majority of population - this could be very sensitive problem, especially in social sphere. Thus, situation comes to US victory in tariffs war... We talked about it since it has started.
Speaking in general on recent events - they mostly confirm our major long-term driving factor, which is disproportion of US and EU economy conditions. It will stay for a long time and continue to drive EUR/USD ratio down. By talking more extended view in the future, we treat the probability as "high" that US will turn with tariffs to EU when China surrender.
Technicals
Monthly
September is close to an end and it becomes the clone of August month. Attempt of pullback meets additional sell-off. As on August as on September we have long upper shadows on candles. Market right now stands at crucial area from technical point of view. This is the middle of the range and YPS1. Once EUR will break it - road to the bottom of the range around 1.03 area will be opened.
Overall tendency still stands moderately bearish, as by price action as by MACD trend. In September EUR forms new low, keeping "lower top - lower bottom" sequence.
As we've said earlier, here we could recognize downside narrow channel and market stands accurately inside of it.
Neither big support nor oversold levels stand around and it is free space till 1.03 lows. The only support is YPS1 and middle of the range. That's major technical support here.
Weekly
We keep weekly chart comments without a change as well. Market has to break out from current range to add something new as to monthly as to weekly time frames. The only new thing that we could say is "acceleration". Usually when market tests the tension of the bulls, creeping slowly down - it lasts till the first signs of acceleration. It will be fatal for EUR and become the harbinger of collapse.
This week data has not enough power to complete the breakout and price holds inside the channel by far, despite breakout of major 5/8 Fib support of 1.1185.
Technically previous upward action was reaction on COP target, and downside action that we see right now should be continuation of major tendency to the next target, which is OP at 1.05 area. Now downward action is held by Yearly Pivot Support 1 and channel's border. Once response will be over, we will keep an eye on downside continuation. EUR has pretty much room to fluctuate inside the channel as upper border stands around 1.13 area. To break the bearish context EUR has to climb above 1.14 top.
Daily
Here we already talked about possible new setup - 3-Drive pattern. In general, 1.0850-1.0880 area is a cluster of different targets. Here we also have AB=CD OP target, our 3-Drive consists of two side-by-side butterflies, and their extension agreement fits perfect to 3-Drive conditions.
This level is also daily oversold. As it has not been reached on Friday, we should wait for it on next week. Still, 3-Drive pattern is tricky. Although it is reliable enough, especially in a company of OS level, when it fails - it fails miserably. In a case of 1.0850 breakout it could be miserable plunge down. Because this is also crucial area on monthly chart, as we've said.
Thus, we have to be careful to nuances of price action on intraday charts. First we need clear bullish reversal pattern somewhere around 1.0850. Once it will be formed - we could take long position, but also be on guard to any signs of failure as it could be fatal for 3-Drive pattern.
Theoretical target of the pattern is the top between 2nd and 3rd drives, which is above 1.11.
Intraday
At first glance it seems that it is already time to consider bullish reversal patterns. But we start to do it only after reaching major daily targets. Here, on 4H chart our XOP and butterfly extension has to be reached. So, scalp traders still have some room for fast bearish trade:
On hourly chart we do not have something special, only Fib levels and no clear patterns. Divergence exists so, may be EUR will be able to climb slightly higher, to K-resistance area. Anyway we focus on daily 3-Drive pattern and mostly watch when market triggers it. Here, if you still would like to use "last chance" to sell, wait for bearish patterns such as "222" Sell, or maybe Agreement resistance will be formed around K-area.
Conclusion:
Recent events, news, statistics tell that major fundamental background stands the same, and investors start to talk about the same thing - EU and US economy divergence. So, we keep our long-term bearish view intact.
In a shorter term, market stands at vital area from technical point of view, forming potentially bullish reversal pattern on daily chart. But the trick is whether this pattern will work or not. It is big chance on fast action whatever direction will be set and very probable that it will be some external political or economical impact.
The technical portion of Sive's analysis owes a great deal to Joe DiNapoli's methods, and uses a number of Joe's proprietary indicators. Please note that Sive's analysis is his own view of the market and is not endorsed by Joe DiNapoli or any related companies.
Last edited: