2023 Market Forecast by Solid ECN

Australian Dollar's Struggle Below EMA 50 Explained​

AUDUSD-H4.png


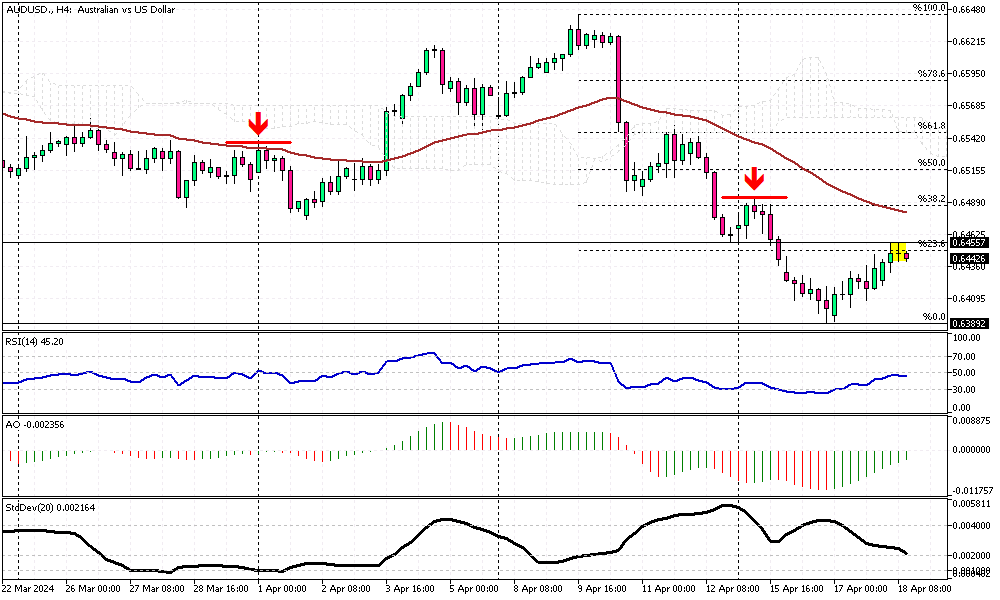
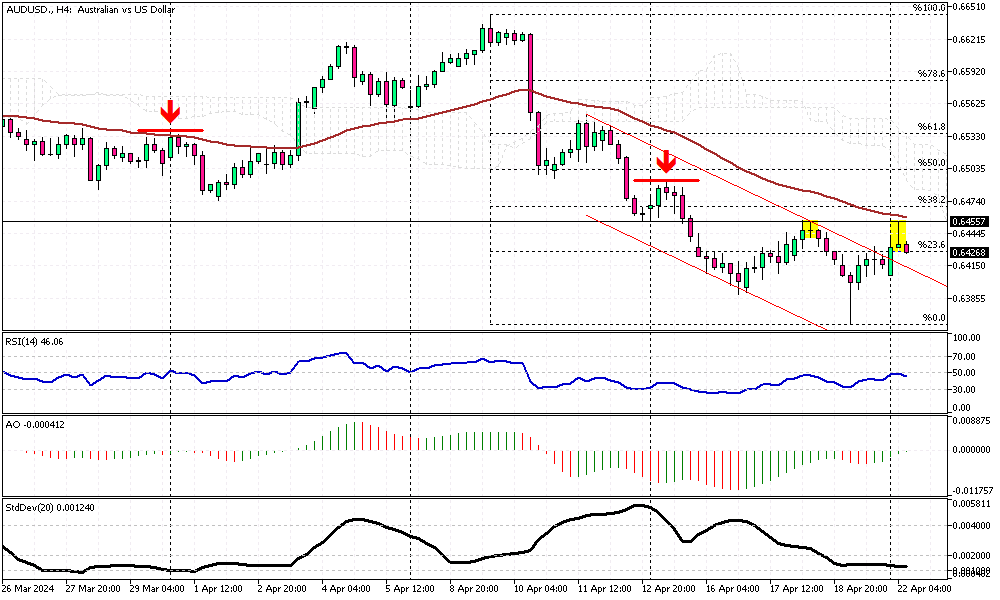
Solid ECN – The Australian dollar trades at about 0.644 against the U.S. dollar as of writing, slightly below the broken support level of 0.6455. Interestingly, the AUDUSD 4-hour chart shows a doji candlestick pattern, highlighted in the image above.

The Relative Strength Index still hovers below 50, but the Awesome Oscillator bars are green, giving mixed signals. Despite the contradiction between the technical indicators, the primary trend is bearish, and the pair trades below EMA 50. Based on price action analysis, our first bearish signal is the doji candlestick pattern.

Therefore, from a technical standpoint, selling pressure will likely increase if the AUDUSD remains below EMA 50. Should the market shift downwards, its initial target would be this week's low of 0.6389.

Conversely, EMA 50 is the dividing line between bull and bear markets. The bear market could be considered over if the price crosses and stabilizes above EMA 50. In this scenario, the uptick momentum that began this week at 0.6389 could extend to 0.652.​
 

Analyzing the Canadian Dollar's Recent Performance​

USDCAD-H4.png


Solid ECN – The Canadian dollar gained ground against the U.S. dollar in today's trading session, while its value had been declining for almost three weeks. Currently, the USDCAD trades at about 1.37, clinging to the lower band of the bullish flag and testing the 78.6% Fibonacci support.

The technical indicators are bearish. The Relative Strength Index hovers below 50, while the Awesome Oscillator shifts below the signal line, signaling a continuation of the downtrend. However, the bear market faces a barrier at 1.374, followed by the EMA 50. If the price maintains its position above these levels, the uptrend will likely resume, initially targeting April's high at 1.3844.​
 

ECB to Cut Rates as Euro Nears Five-Month Low​

EURUSD-H4.png


Solid ECN—The euro is trading at about $1.065, close to its five-month low. This is due to the European Central Bank (ECB) and the Federal Reserve taking conflicting paths. On Tuesday, ECB President Lagarde announced plans to reduce interest rates soon, noting that geopolitical events have not significantly influenced commodity prices.

As a result, investors are expecting the first rate cut from the ECB in June, with two additional cuts planned before 2025. Meanwhile, Federal Reserve Chair Powell mentioned Tuesday that the U.S. might delay reducing its interest rates based on recent inflation trends. He indicated there isn't an urgent need to cut rates, suggesting that reductions might not occur until late 2024.​
 

EUR Nears $1.07 Amid Easing Middle East Tensions​

EURUSD-H4.png


The euro moved closer to $1.07, recovering from a recent drop to its lowest point in over five months at $1.06 on April 16th. This change came as worries about increasing tensions in the Middle East began to ease. Investors also examined the differing attitudes of the European Central Bank (ECB), which is more cautious, and the Federal Reserve, which is more aggressive.

ECB officials indicated they might start lowering interest rates as early as June, with some predicting up to three rate cuts by the end of 2024. However, the overall market mood has slightly changed, with reduced expectations for rate decreases by both the ECB and the Federal Reserve. This shift is due to ongoing high inflation and signs of a strong economy in the US.​
 

AUDUSD Faces Key Resistance: Bearish Outlook​

AUDUSD-H4.png


Solid ECN – The AUDUSD currency pair climbed to EMA 50 on Monday and tested the 0.6455 resistance for the second time this month. As of writing, the pair is trading around 0.645 and declining, trying to stabilize itself below the 23.6% Fibonacci resistance level. Interestingly, the 4-hour chart formed a bearish long wick candlestick pattern, interpreted as a continuation of the downtrend.

The technical indicators are giving mixed signals. The relative strength index hovers below 50, indicating a bearish trend, but the awesome oscillator bars are green and about to flip above the signal line.

From a technical standpoint, the AUDUSD pair is in a bearish trend as long as it trades below the EMA 50. Based on the current data on the chart, the bearish trend should continue, aiming for last week's low, the 0.6361 mark.

The bearish scenario should be invalidated if the Australian dollar climbs above the 50% Fibonacci resistance level.​
 

Navigating USDCAD's Bearish Momentum & Reversals​

USDCAD-H4.png


Solid ECN – The USDCAD price dipped below the bullish flag and the EMA 50. The pair is currently trading at about 1.372. This level coincides with the Ichimoku cloud resistance area, which is also close to the 38.2% Fibonacci level. While the RSI indicator hovers below the 50 level, it still has room to drop to 30 or become oversold. Therefore, it can be interpreted that the downward momentum will likely continue but might pause when it reaches the 38.2% Fibonacci level.

From a technical standpoint, going against the primary trend is risky. Traders should wait and monitor the price action around the 38.2% Fibonacci support level and the bearish flag in the 4-hour chart, depicted in black.

We suggest waiting patiently for the price to climb above the EMA 50 and the 23.6% Fibonacci level and join the bullish trend if there is a new breakout.
 

Watching Bitcoin's Key Fibonacci Levels for Trends​

BTCUSDH4.png


Solid ECN – Bitcoin has shifted above the EMA 50, and the digital gold has stabilized itself above the 38.2% Fibonacci level and the Ichimoku cloud. However, the BTCUSD price still needs to overcome the upper band of the bearish flag before further growth.

From a technical standpoint, with the Bitcoin price sustained below the 50% Fibonacci support level, the bearish outlook remains valid. In this scenario, the downward pressure should continue, and the initial target will likely be the 23.6% Fibonacci support level.

On the other hand, if the bulls break out from the flag, the uptrend should continue, paving the way to $72,000.

Traders should watch the price action and market behavior around the 50% Fibonacci level.​
 

Oil Prices Dip as Middle East Tensions Ease​

USOUSDDaily.png


Solid ECN – On Monday, the price of WTI crude oil dropped below $81 per barrel, hitting a four-week low. This decrease came as tensions in the Middle East seemed to lessen. Iran minimized the impact of recent Israeli strikes on its land and announced it would not retaliate. Despite this, the region remains under close watch by investors since Iran, a major oil producer in OPEC, mainly exports its oil to China and countries outside the US financial system.

In the US, Congress approved an aid package for Ukraine and Israel. This package might include sanctions against Iran’s oil industry, although the exact implications are still unclear. Global economic worries and the possibility that the US Federal Reserve might maintain higher interest rates for an extended period dampen the oil market outlook. Additionally, recent figures revealed a significant increase in US crude oil stocks, with a rise of 2.7 million barrels—almost twice what was anticipated.​
 
Gold Prices Dip Below Key Technical Levels

XAUUSD-H4.png


Solid ECN—In today's trading session, the yellow metal dipped below the 23.6% Fibonacci support level and the Ichimoku cloud. When writing, the XAUUSD price is floating around $2,336, stabilizing below the EMA 50.

The technical indicators are bearish, with the relative strength index hovering below 50, and the awesome oscillator bars are in red and below the signal line.

From a technical standpoint, the gold market might have entered a consolidation phase that could extend to the 50% Fibonacci level at the $2,289 mark.

Conversely, should the price of gold flip above the cloud, we can consider that the uptrend will likely continue.​
 

Bitcoin Faces Resistance: Can It Break the $67K Barrier?​

BTCUSDH4.png


Solid ECN – Bitcoin, often called digital gold, has reached a critical resistance level around the $67,236 mark. The upper band of the wide bearish flag and the 50% Fibonacci support level support this barrier.

Technical indicators are signaling the bull market will continue. The BTCUSD price is above the Ichimoku cloud, and the relative strength index and the awesome oscillator hover above 50.

For the uptrend to continue, the price must close and stabilize itself above the 50% Fibonacci level, a task it has failed to achieve in today's trading session. Interestingly, the BTCUSD 4-hour chart has formed a bearish engulfing pattern, a signal that suggests a shift in trend from a bull to a bear market.

Therefore, if the price remains below the flag, a dip in the Bitcoin price is still possible.

We suggest monitoring the price behavior around the 50% Fibonacci level and the EMA 50 in today's trading session.​
 
Back
Top