GOR FX
Sergeant
- Messages
- 183
Hello everyone,
Been away for a while but am beck!
Last year we closed really high with our last swing trade on CADCHF yielding more than 600 pips.
Lots of activity as far as the system's criteria goes.
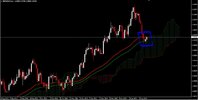
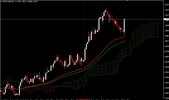
I will be posting more charts later but today's focus is the AUDNZD Daily chart that has corrected back to the cloud+ EMAs 50 and 63. Additionally the pair formed a Pinbar which signals a price rejection of these indicators or dynamic resistance/support.
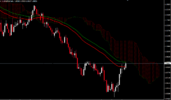
Looking for multiple shorting opportunities on the lower TFs with a 300 pip target to the downside on the longer term.
GOR
Been away for a while but am beck!
Last year we closed really high with our last swing trade on CADCHF yielding more than 600 pips.
Lots of activity as far as the system's criteria goes.
I will be posting more charts later but today's focus is the AUDNZD Daily chart that has corrected back to the cloud+ EMAs 50 and 63. Additionally the pair formed a Pinbar which signals a price rejection of these indicators or dynamic resistance/support.

Looking for multiple shorting opportunities on the lower TFs with a 300 pip target to the downside on the longer term.
GOR
