AceTraderFx Apr 14: Weekly/ Daily Technical Outlook on Major – EUR/USD

acetraderfx

AceTrader.com Representative
Messages
1,109
WEEKLY TECHNICAL OUTLOOK ON EUR/USD
Last Update At 14 Apr 2014 00:17GMT

Trend Daily Chart
Sideways

Daily Indicators
Rising

21 HR EMA
1.3875

55 HR EMA
1.3864

Trend Hourly Chart
Sideways

Hourly Indicators
Falling

13 HR RSI
34

14 HR DMI
-ve

Daily Analysis
Consolidation with downside bias

Resistance
1.3948 - Mar 17 high
1.3906 - Last Fri's high
1.3864 - Last Fri's low, now res

Support
1.3838 - Today's low in NZ
1.3780 - Last Wed's low
1.3748 - Last Mon's high


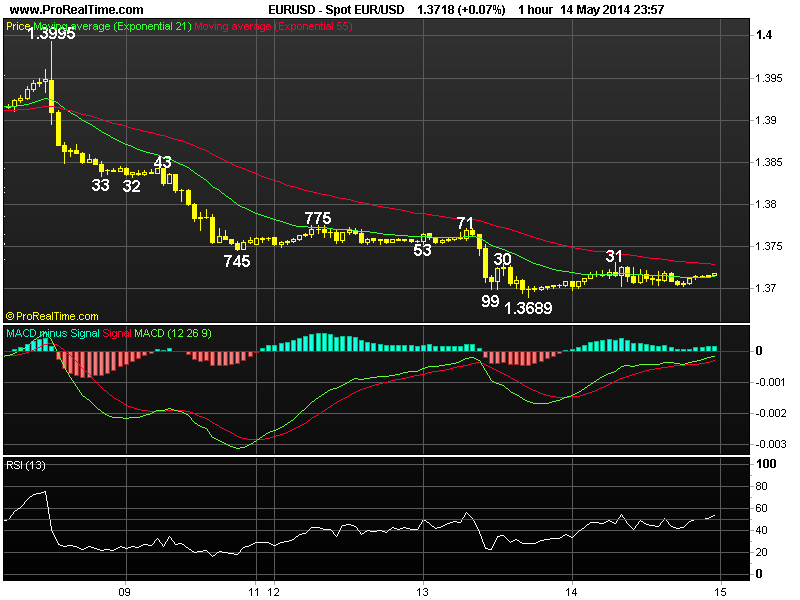
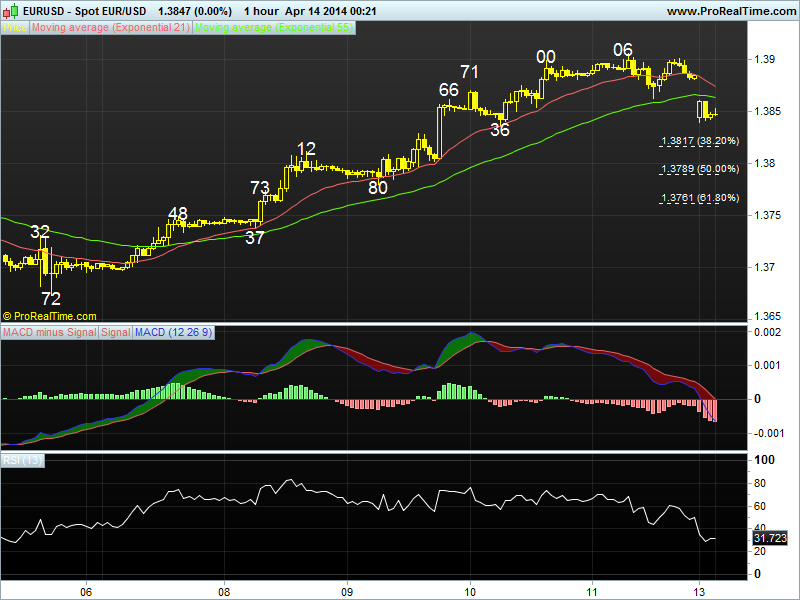
. EUR/USD - 1.3850... Euro climbed strongly last week due to dlr's broad-based weakness, price rose for 5 consecutive days fm Mon's 1.3696 low to 1.3906 on Fri b4 retreating to 1.3864 on profit-taking. Euro gapped-down to 1.3838 in NZ Mon after w/end euro-bearish comments fm ECB President Draghi b4 stabilising.

. Looking at the bigger picture, last week's breach of pivotal res at
1.3877 (Mar 24 high) to 1.3906 confirms early correction fm Mar 2-1/2 year peak at 1.3967 has ended at 1.3672 (Apr 4 low) n as daily oscillators are currently rising, suggesting price is en route to re-test said 2014 top. A daily close abv 1.3967 wud confirm MT uptrend fm 1.2042 (Jul 2012) has resumed n further gain to 'psychological' res at 1.4000 wud follow, break wud extend gain twd 1.4052 (the 50% projection of MT intermediate rise fm 1.2745-1.3894 measured fm 1.3477) but reckon 1.4100 wud hold n yield retreat later this month.

. Today, as the retreat fm Fri's high of 1.3906 to 1.3838 (NZ) suggests
near term upmove fm 1.3672 has made a temporary top, selling on recovery for a retracement twd 1.3780 is cautiously favoured but 1.3761 (61.8% r) shud contain weakness n bring rebound later. Only abv 1.3906 wud extend gain twd 1.3948.

eur%20t%2826%29.png
 
Last edited by a moderator:
AceTraderFx May 15: Daily Technical Outlook on EUR/USD

DAILY TECHNICAL OUTLOOK ON EUR/USD

Last Update At 14 May 2014 23:58GMT

Trend Daily Chart
Sideways

Daily Indicators
Bearish divergences

21 HR EMA
1.3714

55 HR EMA
1.3729

Trend Hourly Chart
Down

Hourly Indicators
Bullish convergences

13 HR RSI
53

14 HR DMI
-ve

Daily Analysis
Consolidation with upside bias

Resistance
1.3812 - May 02 low (now res)
1.3775 - Mon's high
1.3745 - Last Fri's low (now res)

Support
1.3689 - Tue's 1-month low
1.3672 - Apr 04 low
1.3643 - Feb 27 low


. EUR/USD - 1.3718.. The single currency finally gained respite y'day after tumbling fm last Thur's 2-1/2 year peak of 1.3995 to a 1-month trough of 1.3689 on Tue, minor short-covering lifted the pair to 1.3731 in Europe, price traded well abv 1.3689 in quiet NY session as focus was on yen & the sterling.

. Looking at the daily picture, euro's aforesaid selloff fm 1.3995 signals MT uptrend has formed a top there as this lvl was accompanied by prominent 'bearish divergences' on the hourly & daily oscillators, subsequent breach of 1.3771 sup suggests price is en route to re-test daily chart obj. at 1.3672 (Apr low), below this pivotal sup wud 'violate' the recent series of higher lows n higher highs, confirming MT uptrend fm 2012 trough at 1.2042 (Jul) has formed a top there, then further weakness to 1.3518 wud be seen later this month, this is a 'minimum' 38.2% r of the intermediate rise fm 1.2745 (2013 low). Failure to penetrate 1.3672 sup n subsequent rebound abv 1.3905 wud suggest pullback fm 1.3995 has ended n risk wud shift to the upside for gain twd 1.3995.

. Today, we're holding a long position for a corrective bounce twd 1.3771 but 1.3812 (prev. low, now res) shud cap upside. Below 1.3672 extends to 1.3643.

EUR%20may%2015.png
 
Last edited by a moderator:
AceTraderFx May 26: Daily Technical Outlook on EUR/USD

WEEKLY TECHNICAL OUTLOOK ON EUR/USD
Last Update At 25 May 2014 23:26GMT

Trend Daily Chart
Sideways

Daily Indicators
Falling

21 HR EMA
1.3634

55 HR EMA
1.3650

Trend Hourly Chart
Down

Hourly Indicators
Rising fm o/s

13 HR RSI
41

14 HR DMI
-ve

Daily Analysis
Consolidation b4 decline resumes

Resistance
1.3734 - Last Tue's high
1.3688 - Last Wed's NY res n Y'day's high
1.3653 - Last Fri's Asian high

Support
1.3615 - Intra-day fresh 3-month low in NZ
1.3563 - Feb 27 low
1.3518 - 38.2% r 1.2745-1.3995


. EUR/USD - 1.3628... Although euro gained respite initially last week b4 falling again on renewed cross-selling in euro, price penetrated previous 1.3648 low to 1.3635 Wed. Despite a brief recovery, euro tanked on downbeat German & EZ mfg & services PMIs, price weakened to a fresh 3-year trough of 1.3616 on Fri.

. Looking at the daily picture, last week's breach of 1.3648 to 1.3616 confirms decline fm May's 2-1/2 year peak at 1.3995 has once again resumed n this move signals uptrend fm 2012 bottom (Jul) has made a top there, the single currency is en route to 1.3518, this is a 'minimum' 38.% r of the intermediate rise fm 1.2745 to 1.3995, then next daily chart obj. at 1.3477 (2014 low in Feb), having said that, as daily indicators wud be in oversold territory on such move, reckon 1.3370 (50% r fm 1.2745) wud contain weakness. So selling on recovery in anticipation of decline to aforesaid downside targets is recommended n only a daily close abv 1.3734 wud dampen present bearish scenario on euro.

. Today, euro briefly weakened to 1.3615 in NZ after preliminary European Parliament elections were announced n with price currently trading below 21-hr n 55-emas, selling on recovery is recommended n only abv 1.3653/59 risks 1.3688.

EUR%20may%2026.png
 
Last edited by a moderator:
AceTraderFx Jun 3: Daily Technical Outlook & Trading Ideals on EUR/USD

DAILY TECHNICAL OUTLOOK ON EUR/USD
Last Update At 03 Jun 2014 00:14GMT

Trend Daily Chart
Down

Daily Indicators
Falling

21 HR EMA
1.3605

55 HR EMA
1.3612

Trend Hourly Chart
Sideways

Hourly Indicators
Falling

13 HR RSI
38

14 HR DMI
-ve

Daily Analysis
Consolidation b4 decline resumes

Resistance
1.3688 - May 22 high
1.3669 - Last Tue's high
1.3650 - Last Fri's high

Support
1.3586 - Last Thur's 3-1/2 month low
1.3563 - Feb 27 low
1.3518 - 38.2% r 1.2745-1.3995


. EUR/USD - 1.3594... Euro remained under pressure on Mon due to growing speculation ECB will loosen policy at its meeting Thur, price retreated fm 1.3643 (AUS) to 1.3594 in European morning n then further to 1.3588 in NY afternoon after Germany showed that the annual inflation slowed in May b4 recovering.

. Looking at the hourly n daily charts, y'day's decline fm 1.3643 to 1.3588 confirms the recovery fm last Thur's 3-1/2 month bottom at 1.3586 has ended earlier at 1.3650 last Fri n re-test of said sup is seen, break wud indicate MT uptrend fm 1.2042 (2012 low) has formed a top at May's 2-1/2 year peak at 1.3995 n as daily indicators are falling, price is en route to 1.3249 later this month, this is the 'minimum' 38.2% r of aforesaid entire rise fm 1.2042. However, euro shud hold well abv 1.3105 (Sep 13') n yield strg rebound later.

. Today, as long as 1.3650 holds, selling euro on recovery for resumption of decline to 1.3540/50 is favoured, however, as hourly oscillators' readings wud display 'bullish convergences' on next decline, reckon 1.3518 (38.2% r of intermediate rise of 1.2745-1.3995) shud remain intact. Only abv 1.3650wud indicate a temporary low is in place n risk retracement to 1.3384/88 b4 down.

EUR%20jun%2002.png
 
Last edited by a moderator:
AceTraderFx Jun 9: Weeky Technical Outlook & Trading Ideals on EUR/USD

WEEKLY TECHNICAL OUTLOOK ON EUR/USD
Last Update At 08 Jun 2014 23:54GMT

Trend Daily Chart
Down

Daily Indicators
Turning up

21 HR EMA
1.3643

55 HR EMA
1.3634

Trend Hourly Chart

Near term up

Hourly Indicators
Neutral

13 HR RSI
54

14 HR DMI
+ve

Daily Analysis
Consolidation with downside bias

Resistance
1.3734 - May 19 high
1.3691 - 38.2% r of 1.3995-1.3503
1.3677 - Last Fri's 2-week high

Support
1.3622 - Last Fri's low
1.3586 - May 29 low
1.3569 - 61.8% r of 1.3503-1.3677

. EUR/USD - 1.3647... The single currency remained under pressure initially last week due to mounting speculation of 'bold' stimulus measures fm the ECB. Although euro briefly tumbled to a near 4-month trough of 1.3503 after anticipated ECB's action, short-covering lifted price to 1.3670, then 1.3677 on Fri.

. Let's look at the daily picture 1st, although euro's aforesaid rally fm last Thur's 1.3503 low confirms the decline fm May's 2-1/2 year peak at 1.3995 has finally formed a temporary low there n several days of choppy consolidation is expected this week, as long as 1.3586 (previous low n also good sup) holds, mild upside bias remains for price to stage a corrective rise to 1.3691, this is the 'minimum' 38.2% r of the entire fall fm 1.3995-1.3503, however, as hourly oscillators' readings wud display 'bearish divergences' on such a move, strg gain beyond there is not envisaged n reckon euro wud hold below below previous daily res at 1.3734 (May 19 high) n bring another decline later this week.

. Today, Fri's retreat fm 1.3677 signals 1st leg of correction fm 1.3503 has ended n as many European centres are closed for Whit Monday holiday, consolidation is in store, so trading euro on both sides of the market is favoured.

EUR%20jun%2009.png
 
Last edited by a moderator:
AceTraderFx Sept 11: Daily Technical Outlook & Trading Ideals on EUR/USD

DAILY EUR/USD TECHNICAL OUTLOOK
Last Update At 11 Sep 2014 00:14GMT

Trend Daily Chart
Down

Daily Indicators
Rising fm o/s

21 HR EMA
1.2919

55 HR EMA
1.2925

Trend Hourly Chart
Sideways

Hourly Indicators
Neutral

13 HR RSI
50

14 HR DMI
-ve

Daily Analysis
Choppy consolidation to continue

Resistance
1.3030 - Hourly chart
1.2990 - Last Fri's high
1.2963 - Y'day's high

Support
1.2883 - Y'day's NY low
1.2860 - Tue's fresh near 14-month low
1.2839 - 1.618 times ext. of 1.3700-1.3333 fm 1.3433


. EUR/USD - 1.2919 ... The single currency briefly penetrated Tue's high at 1.2957 to 1.2963 in European morning, however, renewed selling interest there capped euro's upside n price ratcheted lower to session low of 1.2883 in New York midday b4 paring intra-day losses in NY afternoon.

. As mentioned in previous update, euro's rebound fm a near fresh 14-month low at 1.2860 on Tue to 1.2963 signals a temp. bottom has been made there as the magnitude of this move was the largest in over a month, therefore, several days of consolidation is in store. As long as 1.2990 res (last Fri's high) holds, out look remains bearish for the MT downtrend fm Jul's 2-1/2 year peak at 1.3995 to retrace the entire MT rise fm 2012 bottom at 1.2042 to resume to 1.2839 (1.618 times extension of 1.3700-1.3333 measured fm 1.3433), however, as the hourly oscillators wud display prominent 'bullish convergences' on next fall, previous key daily sup at 1.2745 shud remain intact.

. Today, in view of abv consolidative view on euro, one can trade on both sides of the market n buy on dips for another rebound or sell on next intra-day up move twd 1.2980/90 res for subsequent retreat.

EUR%20sep%2011.png
 
Last edited by a moderator:
AceTraderFx Sept 24: Daily Technical Outlook & Trading Ideals on EUR/USD

DAILY EUR/USD TECHNICAL OUTLOOK
Last Update At 24 Sep 2014 00:27GMT

Trend Daily Chart
Down

Daily Indicators
Bullish convergences

21 HR EMA
1.2857

55 HR EMA
1.2860

Trend Hourly Chart
Sideways

Hourly Indicators
Falling

13 HR RSI
47

14 HR DMI
-ve

Daily Analysis
Consolidation b4 one more fall

Resistance
1.2982 - Last Wed's high
1.2931 - Last Thur's high
1.2901 - Y'day's high

Support
1.2816 - Mon's fresh 14-month low
1.2772 - 61.8% proj. of 1.3221-1.2860 fm 1.2995
1.2745 - Apr 04 2013 low


. EUR/USD - 1.2852... Despite Mon's selloff to a fresh 14-month low at 1.2816, euro ratcheted higher on active short-covering in Europe on Tue after release of slightly higher German service PMI, however, renewed selling at 1.2901 at London midday capped rebound n knocked price lower to 1.2845 in NY.

. Euro's rebound fm Mon's fresh 14-month low of 1.2816 to 1.2901 y'day suggests MT downtrend fm May's 2-1/2 year peak at 1.3995 has made a minor bottom there, however, subsequent retreat to 1.2845, then 1.2840 today suggests as long as 1.2901 res holds, downside bias remains for MT decline fm May's 2-1/2 year peak at 1.3995 to retrace MT erratic upmove fm 1.2042 (2012 low) wud resume n extend marginal weakness to 1.2814 (50% projection of 1.3221-1.2860 measured fm 1.2995), however, as the hourly oscillators wud display prominent 'bullish convergences' on such move, suggesting steep fall below there is unlikely n reckon 1.2772 (61.8% projection of 1.3221-1.2860 fm 1.2995) wud hold n yield a much needed
minor correction.

. Today, selling euro on recovery for one more is cautiously favoured n only abv 1.2901 wud risk stronger correction to chart obj/res at 1.2931.
EUR%20sep%2024.png
 
Last edited by a moderator:
AceTraderFx Oct 7: Daily Technical Outlook & Trading Ideals on EUR/USD


DAILY EUR/USD TECHNICAL OUTLOOK
Last Update At 07 Oct 2014 00:30GMT

Trend Daily Chart
Down

Daily Indicators
Turning up

21 HR EMA
1.2601

55 HR EMA
1.2591

Trend Hourly Chart
Near term up

Hourly Indicators
Easing fm o/bot

13 HR RSI
72

14 HR DMI
+ve

Daily Analysis
Marginal rise b4 strg retreat

Resistance

1.2748 - 50% r of 1.2995-1.2500
1.2699 - Last Thur's high
1.2675 - Y'day's high

Support
1.2608 - 38.2% r of 1.2500-1.2675
1.2571 - Last Tue's low
1.2542 - Y'day's NY low

. EUR/USD - 1.2635 ... Although the euro remained under pressure in Asia on Mon after last Fri's selloff to a fresh 2-year low at 1.2500, price ratcheted higher in Europe n then jumped in U.S. session on active short-covering. Price rallied to as high as 1.2675 near New York close b4 easing at Asian open today.

. Looking at the hourly n daily charts, y'day's rally to 1.2675 strongly suggests MT downtrend fm May's 2-1/2 year peak at 1.3995 has formed a temporary bottom there n as long as 1.2570/71 (y'day's NY res, now sup n prev. low) holds, upside bias remains for further gain to 1.2699 res (post-ECB rate meeting high unchanged last Thur), break wud bring stronger retracement of MT intermediate decline fm 1.2995 to 1.2748 (50% r) n possibly twds 1.2765 res, however, reckon 1.2806 (61.8% r) shud cap upside this week n yield retreat later.

. In view of near term bullish scenario, buying euro on dips in anticipapation of further gain is favoured. However, as hourly indicators' readings wud be in o/bot territory on next rise, selling euro on upmove for a strg retreat is also appropriate. On the downside, a daily close below 1.2571 wud signal correct tion fm 1.2500 has possibly ended n yield weakness twd 1.2500 later this week.
EUR%20oct%2007.png
 
Last edited by a moderator:
Back
Top