AceTraderFx Apr 14: Weekly/ Daily Technical Outlook on Major – EUR/USD

AceTraderFx Oct 15: Daily Technical Outlook & Trading Ideals on EUR/USD

DAILY EUR/USD TECHNICAL OUTLOOK
Last Update At 15 Oct 2014 00:38GMT

Trend Daily Chart
Down

Daily Indicators
Turning up

21 HR EMA
1.2664

55 HR EMA
1.2674

Trend Hourly Chart
Near term down

Hourly Indicators
Falling

13 HR RSI
39

14 HR DMI
-ve

Daily Analysis
Consolidation with downside bias

Resistance
1.2791 - Last Thur's high
1.2769 - Y'day's high in Australia
1.2700 - Mon's hourly res

Support
1.2605 - Last Fri's low
1.2584 - Last Tue's low
1.2500 - Oct's fresh 2-year low

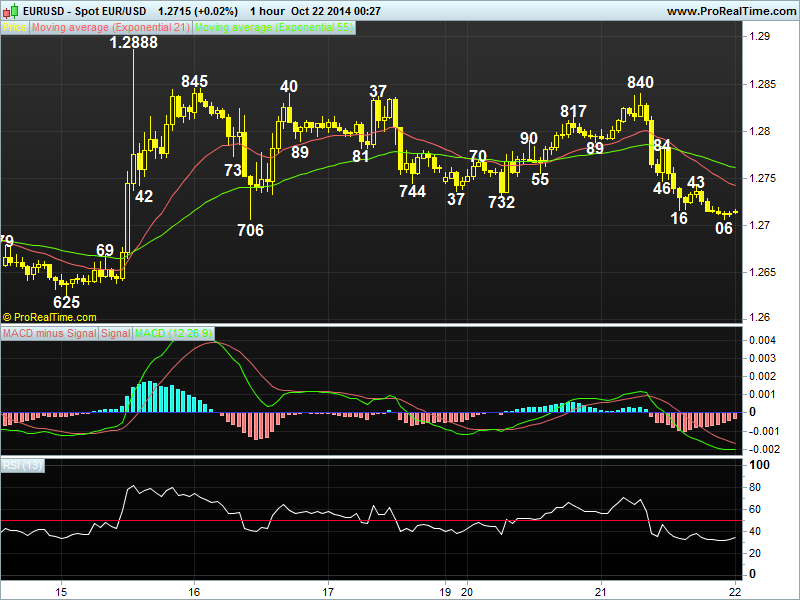
. EUR/USD - 1.2643 ... Despite euro's brief jump to 1.2769 in Aust. y'day on short covering, the pair ratcheted lower in Asia n then dropped sharply to 1.2640 in Europe after a surprise sharp fall in German ZEW economic sentiment. Euro staged a minor recovery to 1.2679 in New York morning b4 falling again.

. Looking at the hourly chart, y'day's selloff strongly suggests correction fm Oct's 2-year trough at 1.2500 has possibly ended at 1.2791 n further 'choppy' consolidation with downside bias wud be seen, a daily close below 1.2605 (last Fri's low) wud add credence to this view n yield re-test of 1.2500 later next week, break wud bring resumption of MT fall fm May's 2-1/2 year peak at 1.3995 to projected downside target at 1.2412 (2.618 times of 1.3995-1.3505 fm 1.3700). On the upside, only abv 1.2791 res brings stronger retracement of MT rise twd 1.2860 (prev. low, now res).

. In view of abv analysis, selling euro on recovery in anticipation of further weakness is favoured. A rise abv 1.2700 wud prolong near term gyration inside 1.2605-1.2791 broad range n another rebound to 1.2769 may be seen, break wud bring another corrective rise to 1.2791.
eur%20oct%2015.png
 
Last edited by a moderator:
AceTraderFx Oct 22: Daily Technical Outlook & Trading Ideals on EUR/USD

DAILY EUR/USD TECHNICAL OUTLOOK
Last Update At 22 Oct 2014 00:33GMT

Trend Daily Chart
Sideways

Daily Indicators
Turning up

21 HR EMA
1.2741

55 HR EMA
1.2761

Trend Hourly Chart
Near term down

Hourly Indicators
Falling

13 HR RSI
32

14 HR DMI
-ve

Daily Analysis
Consolidation with downside bias

Resistance
1.2888 - Last Wed's 3-week high
1.2840 - Y'day's high n last Thur's NY high
1.2784 - Y'day's hourly res

Support
1.2706 - Last Thur's low
1.2669 - Last Tue's European morning high
1.2625 - Last Wed's low

. EUR/USD - 1.2715... Despite euro's initial brief rise to 1.2840 in Europe on Tue, the single currency n then tumbled after Reuters reported the ECB was planning on corporate bond purchase as early as Dec. The pair weakened to as low as 1.2715 near NY close n then marginally lower to 1.2706 in Australia today.

. Although last week's rally to 1.2888 (Wed) signals the MT downtrend fm 2014 2-1/2 year peak at 1.3995 (May) has formed a temporary bottom at Oct's 2-year low at 1.2500, y'day's selloff suggests 1st leg of said corrective upmove has ended there n as long as hourly chart res at 1.2784 holds, consolidation with downside bias remains, a firm breach of 1.2706 sup (reaction low fm last Wed's 1.2888 high) wud add credence to the abv view n bring further weakness twd 'dynamic' sup at 1.2648 (this is 61.8% r of 1.2500-1.2888) but reckon pivotal sup at 1.2605 wud remain intact. On the upside, only a rise abv 1.2888 res wud bring a stronger correction to 1.2958, this a 'minimum' 38.2% r of MT intermediate fall fm 1.3700 (Jul high).

. Today, we're holding a short position in anticipation of further weakness n wud take profit on next decline as 1.2648 shud remain intact.
eur%20oct%2022.png
 
Last edited by a moderator:
AceTraderFx Nov 10: Weekly Technical Outlook & Trading Ideals on EUR/USD

WEEKLY EUR/USD TECHNICAL OUTLOOK
Last Update At 09 Nov 2014 23:57GMT

Trend Daily Chart
Down

Daily Indicators
Bullish convergences

21 HR EMA
1.2432

55 HR EMA
1.2441

Trend Hourly Chart
Sideways

Hourly Indicators
Rising

13 HR RSI
62

14 HR DMI
+ve

Daily Analysis
Initial rise b4 retreat

Resistance
1.2577 - Last Tue's high
1.2533 - Last Thur's high
1.2495 - Last Thur's European morning low

Support
1.2408 - Lst Fri's Euroepan morning high
1.2357 - Last Fri's 26-month low
1.2311 - 61.8% proj. of 1.3433-1.2500 fm 1.2888

. EUR/USD - 1.2460 ... The single currency continued its recent downtrend n hit a 2-year low at 1.2439 at the start of last week, despite staging a short-covering rebound to 1.2577 Tue, renewed selling emerged n knocked price to 1.2374 after ECB Draghi's dovish comments Thur, then 1.2357 on Fri b4 rebounding.

. Looking at bigger picture 1st, despite euro's resumption of the MT fall fm May's 2-1/2 year peak at 1.3995 to a fresh 2-year bottom at 1.2357,as aforesaid low was also accompanied by prominent bullish convergences on the hourly & daily oscillators n subsequent bounce to 1.2470 had pushed the hourly macd abv the zero line, suggesting consolidation with initial upside bias wud be seen. However, a daily close abv 1.2577 is needed to 'violate' recent series of lower highs n lower lows n yield stronger retracement twd next upside obj. at 1.2771 later this month. On the downside, below 1.2357 wud yield weakness to 1.2311 (61.8% proj. of 1.3433-1.2500 measured fm 1.2888) but 1.2146 shud hold fm here.

. Today, euro's gain to 1.2487 in NZ suggests 1-2 days of choppy sideways trading is in store, in view of abv analysis, one can trade the pair on both sides of the market as only below 1.2378 wud bring re-test of 1.2357.
EUR%20nov%2010.png
 
Last edited by a moderator:
AceTraderFx Nov 14: Daily Technical Outlook & Trading Ideals on EUR/USD

DAILY EUR/USD TECHNICAL OUTLOOK
Last Update At 14 Nov 2014 00:07GMT

Trend Daily Chart
Down

Daily Indicators
Bullish convergences

21 HR EMA
1.2468

55 HR EMA
1.2459

Trend Hourly Chart
Sideways

Hourly Indicators
Neutral

13 HR RSI
57

14 HR DMI
+ve

Daily Analysis
Consolidation with downside bias

Resistance
1.2560 - 38.2% r of 1.2888-1.2357
1.2533 - Last Thur's high
1.2509 - Mon's high

Support
1.2419 - Wed's low
1.2395 - Tue's low
1.2357 - Last Fri's 26-month low

. EUR/USD - 1.2474 ... Despite Wed's erratic decline to 1.2419, the single currency ratcheted higher on Thur n ratcheted higher back to 1.2490 in NY morning due to renewed cross buying in euro (eur/jpy rallied fm 143.57 to as high as 144.60). Price rose marginally to 1.2492 ahead of New York close b4 easing.

. Looking at the hourly & daily charts, the volatile price action fm last
Fri's 26-month trough at 1.2357 is possibly unfolding into a triangle with a-leg: 1.2509, b-leg: 1.2395, c-leg:1.2499, d-leg:1.2419. Therefore, as long as res at 1.2499 (reaction high on Mon/a-leg top) holds, consolidation with downside bias remains but below 1.2395 sup (b-leg trough) is needed to confirm correction is over n yield resumption of MT downtrend fm May's 2-1/2 year peak at 1.3995 for re-test of 1.2357, then later twd 1.2311 (this is 61.8% projection of 1.3433-1.2500 measured fm 1.2888) next week. On the upside, a daily close abv 1.2509 res wud bring stronger retracement to 1.2533 (last Thur's high) n then 1.2560 (38.2% r of 1.2888-1.2537) but reckon res 1.2577 may hold initially.

. Today, we're holding a short position entered y'day at 1.2485 for subsequent weakness to 1.2510 n only abv 1.2509 res wud abort bearish bias on euro.
eur%20nov%2014%281%29.png
 
Last edited by a moderator:
Back
Top