Daily Market Analysis By FXOpen

Market Analysis: EUR/USD Eyes More Gains, USD/CHF Could Rally
0xMeNXM.jpeg


EUR/USD started a fresh increase above the 1.0828 resistance. USD/CHF declined and now struggling below the 0.8860 resistance.

Important Takeaways for EUR/USD and USD/CHF Analysis Today

  • The Euro rallied after it broke the 1.0828 resistance against the US Dollar.
  • There is a connecting bullish trend line forming with support near 1.0845 on the hourly chart of EUR/USD at FXOpen.
  • USD/CHF declined below the 0.8860 and 0.8850 support levels.
  • There is a key contracting triangle forming with resistance near 0.8850 on the hourly chart at FXOpen.

EUR/USD Technical Analysis
IBwWOMs.png


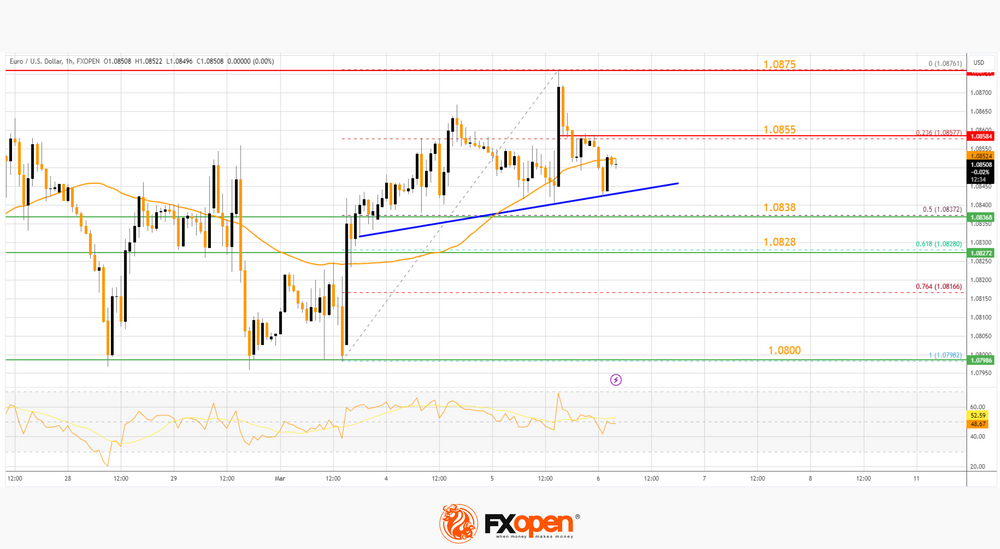
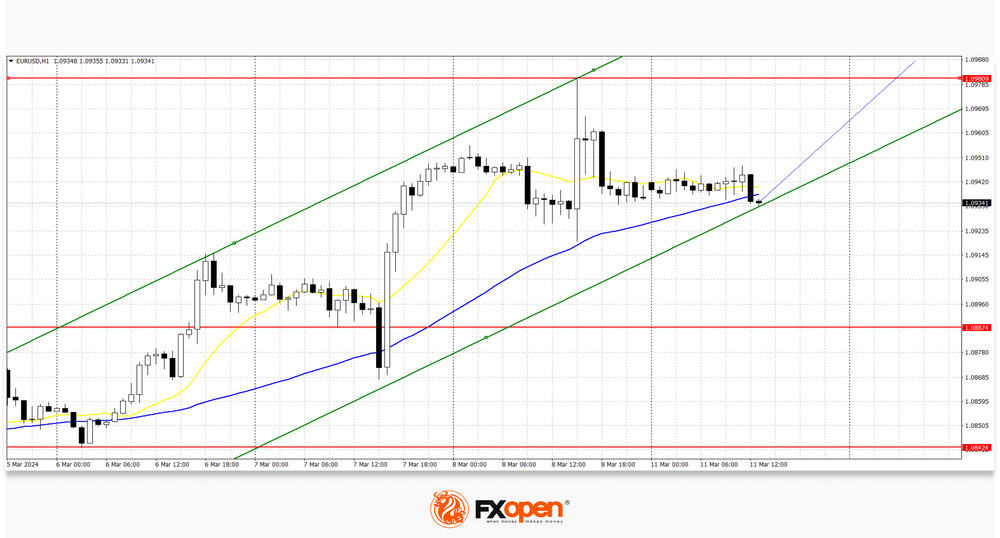
On the hourly chart of EUR/USD at FXOpen, the pair started a fresh increase from the 1.0800 zone. The Euro cleared the 1.0828 resistance to move into a bullish zone against the US Dollar, as mentioned in the previous analysis.

The bulls pushed the pair above the 50-hour simple moving average and 1.0855. Finally, the pair tested the 1.0875 resistance. A high was formed near 1.0876 and the pair is now consolidating gains. There was a move below the 23.6% Fib retracement level of the upward wave from the 1.0798 swing low to the 1.0876 high.

Immediate support on the downside is near a connecting bullish trend line at 1.0845. The next major support is the 50% Fib retracement level of the upward wave from the 1.0798 swing low to the 1.0876 high at 1.0838.

A downside break below the 1.0838 support could send the pair toward the 1.0800 level. Any more losses might send the pair into a bearish zone to 1.0765.

Immediate resistance on the EUR/USD chart is near the 1.0855 zone. The first major resistance is near the 1.0875 level. An upside break above the 1.0875 level might send the pair toward the 1.0920 resistance.

The next major resistance is near the 1.0940 level. Any more gains might open the doors for a move toward the 1.1000 level.

VIEW FULL ANALYSIS VISIT - FXOpen Blog...

Disclaimer: This article represents the opinion of the Companies operating under the FXOpen brand only (excluding FXOpen EU). It is not to be construed as an offer, solicitation, or recommendation with respect to products and services provided by the Companies operating under the FXOpen brand, nor is it to be considered financial advice.
 
After Updating the Historical High, the Price of Bitcoin Collapsed by 14%
axIZVlK.jpeg


Bitcoin's previous all-time high price, recorded on November 10, 2021, was around USD 68,900 per coin (depending on exchanges).

But yesterday, the price of Bitcoin exceeded 69k! However, the jubilation from the new historical peak quickly gave way to fear — as the BTC/USD rate began to fall rapidly. From peak A to low B – the price traveled a path of more than -14% in just 5 hours.

These events highlight 2 characteristic features of the cryptocurrency market:
→ Excessive volatility, which is not typical for the stock and foreign exchange markets. For comparison: on October 19, 1987 — Black Monday — the S&P 500 index fell by about 20.5%. After this incident, there were no days when the drop exceeded 14%.
→ Emotionality of the market and the importance of psychological levels. At these levels, the price of Bitcoin often makes false punctures. Yesterday, there were 2 such punctures: a false bullish puncture of the 2021 top, and a false bearish puncture of the round level of 60k dollars for Bitcoin.

bbxEGmt.png


VIEW FULL ANALYSIS VISIT - FXOpen Blog...

Disclaimer: This article represents the opinion of the Companies operating under the FXOpen brand only (excluding FXOpen EU). It is not to be construed as an offer, solicitation, or recommendation with respect to products and services provided by the Companies operating under the FXOpen brand, nor is it to be considered financial advice.
 
TSLA Stock Price Falls Over 9% in Just 2 Days
uXm3Bp5.jpeg


The day before yesterday, trading in TSLA shares began at an opening price of USD 199.34; trading yesterday closed at a price of USD 180.51. The fall in TSLA shares led Musk to lose the title of the world's richest man to Jeff Bezos.

The main driver of the decline in the price of TSLA shares was news:
→ about the temporary shutdown of the Giga Berlin plant in Germany after an arson set by a group claiming that the company led by Elon Musk is devouring “land, resources, people”;
→ that deliveries of electric cars from the Shanghai plant have dropped to their lowest level in more than a year — which may indicate fierce competition with Chinese manufacturers.

It also became known that Morgan Stanley analyst Adam Jonas is lowering his target price from USD 345 to USD 320 and predicting a decline in sales for FY24.

OzCRpkr.png


VIEW FULL ANALYSIS VISIT - FXOpen Blog...

Disclaimer: This article represents the opinion of the Companies operating under the FXOpen brand only (excluding FXOpen EU). It is not to be construed as an offer, solicitation, or recommendation with respect to products and services provided by the Companies operating under the FXOpen brand, nor is it to be considered financial advice.
 
The Price of Gold XAU/USD Sets a Historical Record Exceeding $2160 per Ounce
4OAWKUz.jpeg


The previous high was around USD 2,135, but gold rose above USD 2,160 an ounce this morning, reaching its highest level ever, as Treasury yields weakened on hopes that the US Federal Reserve will soon begin cutting interest rates.

In a speech yesterday, the Fed chief offered no clarity, saying it would likely be appropriate to ease policy restrictions "at some point this year."

Traders now see a 70% chance of a Fed rate cut in June.

Technical analysis of the XAU/USD chart shows that:
→ the price of gold is in an ascending channel (shown in blue);
→ after a false breakout of its lower border, the price confidently overcame the downward trend line (shown in red) and resistance 2,090;
→ a strong upward impulse led to the RSI indicator entering the extreme overbought zone.

2dIDYGV.png


TO VIEW THE FULL ANALYSIS, VISIT THE FXOPEN BLOG

Disclaimer: This article represents the opinion of the Companies operating under the FXOpen brand only (excluding FXOpen EU). It is not to be construed as an offer, solicitation, or recommendation with respect to products and services provided by the Companies operating under the FXOpen brand, nor is it to be considered financial advice.
 
USD/CAD Analysis: Canadian Dollar Strengthens after Bank of Canada Decision
5boNnE0.jpeg


The Bank of Canada has decided to keep interest rates at 5.0% for the fifth time in a row, it announced yesterday, as it continues to look for clearer signs that inflation is moving closer to the bank's 2% target before considering rate cuts.

According to Bank of Canada Governor Tiff Macklem:
→ the Bank is concerned that underlying inflationary pressures remain.
→ It is too early to ease restrictive policies. There is a clear consensus within the Board of Governors that the time has not come (for rate cuts).
→ We are now in a difficult phase of the monetary cycle.

These hawkish statements contributed to the Canadian dollar strengthening against other currencies, in particular against the US dollar.

13U2mQQ.png


TO VIEW THE FULL ANALYSIS, VISIT THE FXOPEN BLOG

Disclaimer: This article represents the opinion of the Companies operating under the FXOpen brand only (excluding FXOpen EU). It is not to be construed as an offer, solicitation, or recommendation with respect to products and services provided by the Companies operating under the FXOpen brand, nor is it to be considered financial advice.
 
Watch FXOpen's 4 - 8 March Weekly Market Wrap Video

Weekly Market Wrap With Gary Thomson: CHF, CAD, GOLD, TSLA


Get the latest scoop on the week's hottest headlines, all in one convenient video. Join Gary Thomson, the COO of FXOpen UK, as he breaks down the most significant news reports and shares his expert insights..

  • Swiss Franc Weakens after Inflation News #CHF
  • USD/CAD Analysis: Canadian Dollar Strengthens after Bank of Canada Decision #USDCAD #CAD
  • The Price of Gold XAU/USD Sets a Historical Record Exceeding $2160 per Ounce #XAUUSD #Gold
  • TSLA Stock Price Falls Over 9% in Just 2 Days #TSLA #teslastock

Stay in the know and empower yourself with our short, yet power-packed video.

Watch it now and stay updated with FXOpen.


Don't miss out on this invaluable opportunity to sharpen your trading skills and make informed decisions.


FXOpen YouTube


Disclaimer: This article represents the opinion of the Companies operating under the FXOpen brand only (excluding FXOpen EU). It is not to be construed as an offer, solicitation, or recommendation with respect to products and services provided by the Companies operating under the FXOpen brand, nor is it to be considered financial advice.

#fxopen #fxopenyoutube #fxopenint #weeklyvideo
 
Market Analysis: AUD/USD and NZD/USD Start Fresh Rally
mVBT2wr.jpeg


AUD/USD is gaining pace and recently cleared 0.6600. NZD/USD is also rising and could extend its increase above the 0.6200 resistance zone.

Important Takeaways for AUD/USD and NZD/USD Analysis Today

  • The Aussie Dollar is moving higher from the 0.6480 zone against the US Dollar.
  • A connecting bullish trend line is forming with support at 0.6615 on the hourly chart of AUD/USD at FXOpen.
  • NZD/USD is gaining pace above the 0.6155 support.
  • A key bullish trend line is forming with support at 0.6170 on the hourly chart of NZD/USD at FXOpen.

AUD/USD Technical Analysis
QK65R92.png


On the hourly chart of AUD/USD at FXOpen, the pair formed a base above 0.6480, as discussed in the previous analysis. The Aussie Dollar gained strong bids and started a decent increase above the 0.6540 resistance against the US Dollar.

The bulls pushed the pair above the 0.6580 resistance zone. There was a close above the 0.6600 resistance and the 50-hour simple moving average. Finally, the pair tested the 0.6635 zone. A high is formed at 0.6633 and the pair is now consolidating above 23.6% Fib retracement level of the upward move from the 0.6477 swing low to the 0.6633 high.

On the upside, the AUD/USD chart indicates that the pair is now facing resistance near 0.6635. The first major resistance might be 0.6650. An upside break above the 0.6650 resistance might send the pair further higher.

The next major resistance is near the 0.6720 level. Any more gains could clear the path for a move toward the 0.6800 resistance zone.

If not, the pair might correct lower. Immediate support is near a connecting bullish trend line at 0.6615. The next support could be 0.6595. If there is a downside break below the 0.6595 support, the pair could extend its decline toward the 0.6580 zone.

Any more losses might signal a move toward the 61.8% Fib retracement level of the upward move from the 0.6477 swing low to the 0.6633 high at 0.6540.

TO VIEW THE FULL ANALYSIS, VISIT THE FXOPEN BLOG

Disclaimer: This article represents the opinion of the Companies operating under the FXOpen brand only (excluding FXOpen EU). It is not to be construed as an offer, solicitation, or recommendation with respect to products and services provided by the Companies operating under the FXOpen brand, nor is it to be considered financial advice.
 
EUR/USD Hits 8-week High
eQOVr2k.jpeg


The euro is trading above USD 1.09, hitting its strongest point since mid-January on Friday, helped by news from both the US and Europe.

Friday's news showed that the US labor market is weakening:
→ The change in employment in the non-farm sector showed an increase in jobs = 275k for the month, although last month it was = +353k.
→ The unemployment rate rose to 3.9%, although it was 3.7% for 3 months.
News of a weakening labour market could put pressure on the Fed to ease monetary policy.

Meanwhile in Europe, the ECB kept borrowing costs at a record high, citing significant progress in containing inflation, and revised its inflation expectations downward, forecasting price growth of 2.3% in 2024, and 1.9% in 2025. And during a press conference last Thursday, ECB President Lagarde told reporters that policymakers had not discussed rate cuts at that meeting.

Thus, there is reason to believe that the Fed will start lowering rates earlier (it started raising them earlier than the ECB). And this assumption is shared by many market participants, judging by the bullish dynamics in the EUR/USD market.

u0it3Qs.png


TO VIEW THE FULL ANALYSIS, VISIT THE FXOPEN BLOG

Disclaimer: This article represents the opinion of the Companies operating under the FXOpen brand only (excluding FXOpen EU). It is not to be construed as an offer, solicitation, or recommendation with respect to products and services provided by the Companies operating under the FXOpen brand, nor is it to be considered financial advice.
 
The rally is over! NASDAQ leads US stock market declines
BpS8A1x.jpeg


The halcyon days of US tech stock rallies with increasing values of companies listed on the NASDAQ exchange, which have taken place alongside the increasing values of other North American indices, have ended abruptly.

The past few weeks have been of great interest, with the NASDAQ index leading the charge toward a seemingly unrelenting increase in value as confidence in large companies developing AI technology, such as NVIDIA, well known for its graphics cards and now highly engrossed in AI development, as well as strong performance from specialist American firms such as Broadcom and cloud computing giant Cloudstrike Holdings which have led the rally well into March.

As well as the NASDAQ index having tailed off, other US stock indices have experienced similar decrements.

The tables turned quite significantly at the end of last week; however, when the NASDAQ index began to reduce in value, the all-time highs of last week were not replicated this week.

On Friday, the NASDAQ index was trading at 18,273.8 according to FXOpen pricing; however, as market participants anticipate the opening of the US market today, the tech-friendly index is valued at 17,975.7 at the bottom of the candlestick in the pre-market opening hours.

In keeping with the nature of US tech stocks, volatility is once again a subject of discussion across mainstream reports and among analysts, especially given that one of the contingents of the NASDAQ index that was contributing to its rally, NVIDIA, has experienced a decline in stock value by 5.5%, according to some media reports, during the course of Friday last week after a substantial rally that has seen it gain approximately 80% year to date.

TO VIEW THE FULL ANALYSIS, VISIT THE FXOPEN BLOG

Disclaimer: This article represents the opinion of the Companies operating under the FXOpen brand only (excluding FXOpen EU). It is not to be construed as an offer, solicitation, or recommendation with respect to products and services provided by the Companies operating under the FXOpen brand, nor is it to be considered financial advice.
 
US Dollar Ended the Week under Pressure
haplE1o.jpeg


The February labour market report was published in the United States. The number of new jobs created by the national economy outside the agricultural sector increased by 275.0k in January after an increase of 229.0k a month earlier, while experts expected an increase of 200.0k. It should also be noted that the January figure was revised from the previous estimate of 353.0k jobs. The average hourly wage in annual terms adjusted from 4.4% to 4.3%, and in monthly terms, from 0.5% to 0.1%. At the same time, the unemployment rate in February increased sharply from 3.7% to 3.9%.

EUR/USD
oKb04lp.png


The EUR/USD pair shows mixed dynamics, remaining close to 1.0940. Immediate resistance can be seen at 1.0980, a break higher could trigger a rise towards 1.1100. On the downside, immediate support is seen at 1.0887, a break below could take the pair towards 1.0842.

Market activity remains subdued as investors analyse macroeconomic data released last week. On Friday, March 8, trading participants drew attention to the decline in the annual dynamics of industrial production in Germany in January by 5.5% after -3.5% in the previous month, and in monthly terms the figure strengthened by 1.0% after a reduction of 2 .0% in December against a forecast of 0.6%, which allows the German economy to emerge from recession in the near future. The German producer price index added 0.2% monthly after -0.8% in December, and slowed down by 4.4% year-on-year after -5.1%, while markets were expecting -6.6%. Trading participants also assessed statistics on the eurozone GDP product for the fourth quarter of 2023: on a quarterly basis, the figure remained at 0.0%, and on an annual basis it increased by 0.1%, which coincided with expectations.

Technical analysis of the EUR/USD pair shows that a new upward channel has formed at the highs of last week. Now the price is near the lower border and may continue to rise.

TO VIEW THE FULL ANALYSIS, VISIT THE FXOPEN BLOG

Disclaimer: This article represents the opinion of the Companies operating under the FXOpen brand only (excluding FXOpen EU). It is not to be construed as an offer, solicitation, or recommendation with respect to products and services provided by the Companies operating under the FXOpen brand, nor is it to be considered financial advice.
 
Back
Top