Daily Market Analysis By FXOpen

Correction in Crypto Markets: BTC/USD Rate Drops to $60,000
ENFPI2W.jpeg


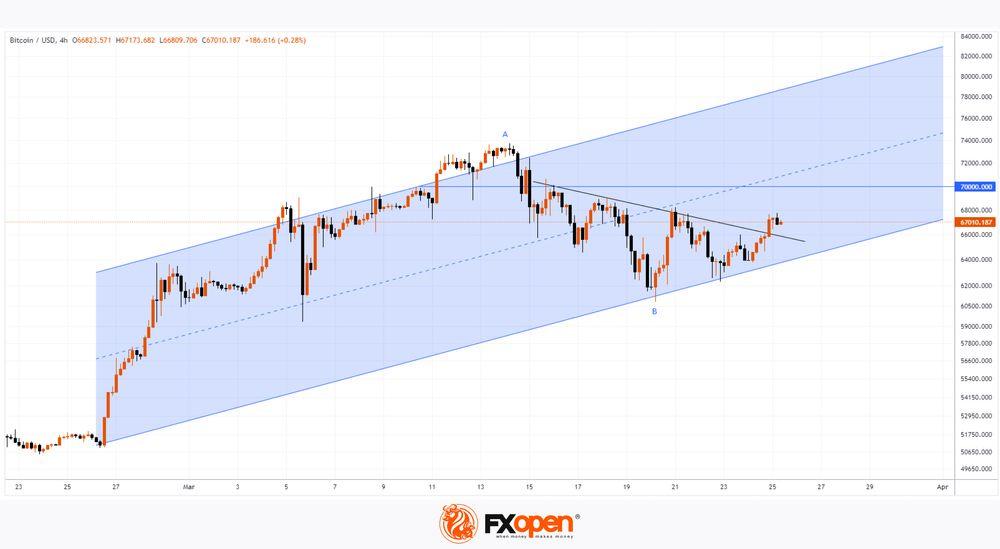
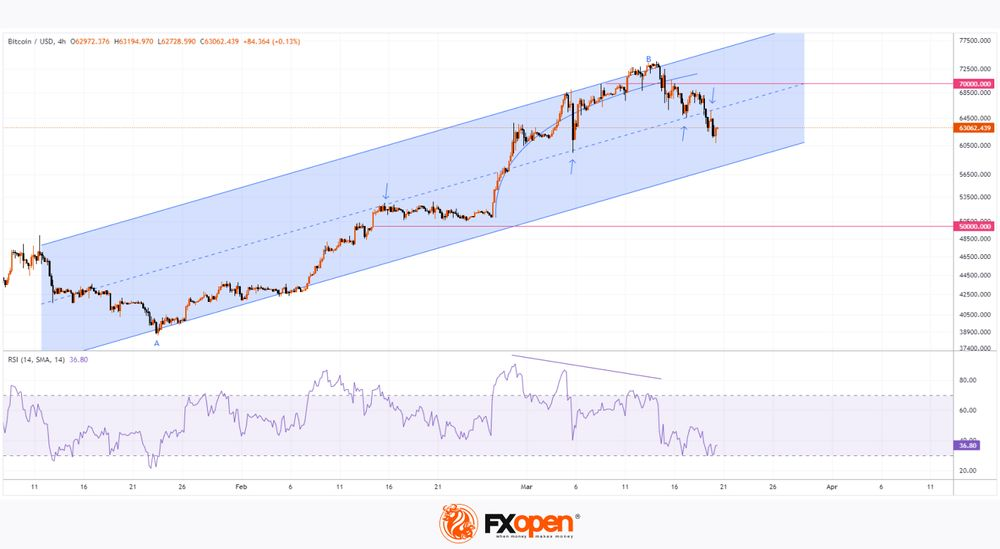
On March 18, we wrote that bears became more active near the $70,000 level.

As the BTC/USD chart shows, today the price of Bitcoin is already close to the psychological level of USD 60k, while the price of Ethereum is close to USD 3,000.

According to MarketWatch, experts consider the decline to be a correction that is “long overdue” as part of an upward trend. According to Fundstrat, Monday saw net outflows from BTC ETFs for the first time since March 1, amounting to about $154.3 million.

What's next?

From a technical analysis point of view, the price of Bitcoin, given an increase of approximately 90% from point A (around USD 38.8k) to point B (around USD 73.4k), a normal correction of 50% indicates the prospect of a decline to the area of USD 56.1k.

hC6uYtj.png


TO VIEW THE FULL ANALYSIS, VISIT THE FXOPEN BLOG

Disclaimer: This article represents the opinion of the Companies operating under the FXOpen brand only (excluding FXOpen EU). It is not to be construed as an offer, solicitation, or recommendation with respect to products and services provided by the Companies operating under the FXOpen brand, nor is it to be considered financial advice.
 
TSLA analysis: Price Returns to Above the $170 Level, But for How Long?
UtIpNVv.jpeg


After forming a low of the year on March 14, the TSLA share price managed to rise above the USD 170 level — investors reacted positively to Tesla’s decision to increase prices for electric vehicles in the US and Europe.

However, the TSLA stock market remains under pressure:
the TSLA price performs noticeably worse than the S&P 500 index;
the price forms a downward channel (shown in red);
Goldman Sachs analysts cut their forecast for Tesla shares to USD 190 from USD 220 for the next 12 months due to problems with production and sales.

Yahoo writes that investors are not happy with Musk's attitude. The fall in Tesla shares could quickly stop if the company gets a “real CEO” or Musk changes his position and returns to work and positively promoting the brand.

What is the market outlook?

j3mv0Fd.png


TO VIEW THE FULL ANALYSIS, VISIT THE FXOPEN BLOG

Disclaimer: This article represents the opinion of the Companies operating under the FXOpen brand only (excluding FXOpen EU). It is not to be construed as an offer, solicitation, or recommendation with respect to products and services provided by the Companies operating under the FXOpen brand, nor is it to be considered financial advice.
 
The price of the S&P 500 set a historical record amid news from the Fed
CykvuzI.jpeg


On March 14, we wrote: “The US500 stock index market is showing signs of positivity, indicating that an attempt to overcome the resistance of 5,200 points with a new record high may be made in the near future.” Yesterday's event created the momentum that allowed the bulls to do this.

On Wednesday evening it became known that it was decided to keep the interest rate at 5.5% in the US — this was expected. What market participants paid more attention to was the dovish tone of the Fed. Thus, it became known that by the end of 2024 there may be 3 consecutive rate cuts.

According to Jerome Powell:
→ recent inflation data turned out to be hotter than expected;
→ however, “in fact, the overall story has not changed, it is a gradual decline in inflation along a somewhat bumpy road.”

Thus, fears associated with a longer period of tight monetary policy have been dispelled. As a result, the US dollar fell in price against a number of currencies, and the US stock market index S&P 500 soared to a new historical high around the level of 5,250.

WgILDBN.png


TO VIEW THE FULL ANALYSIS, VISIT THE FXOPEN BLOG

Disclaimer: This article represents the opinion of the Companies operating under the FXOpen brand only (excluding FXOpen EU). It is not to be construed as an offer, solicitation, or recommendation with respect to products and services provided by the Companies operating under the FXOpen brand, nor is it to be considered financial advice.
 
USD/CHF Analysis: SNB Decision Breaks Multi-month Trend
6yn9D0d.jpeg


According to Reuters, on the sidelines of the World Economic Forum in Davos in January, the head of the Swiss National Bank (SNB) Thomas Jordan told the Swiss press that the appreciation of the franc creates problems for exporters. Thus, indicating intentions to weaken the CHF.

His words in January seem to be in line with how events are developing — the franc has weakened against the US dollar by more than 6% since the start of the year.

Moreover, today, quite unexpectedly, the Swiss National Bank decided to lower the interest rate: actual = 1.50%, forecast = 1.75%, previous value = 1.75%.

The result of the decision today was a sharp weakening of the franc against other currencies, including the US dollar.

bRyRELX.png


TO VIEW THE FULL ANALYSIS, VISIT THE FXOPEN BLOG

Disclaimer: This article represents the opinion of the Companies operating under the FXOpen brand only (excluding FXOpen EU). It is not to be construed as an offer, solicitation, or recommendation with respect to products and services provided by the Companies operating under the FXOpen brand, nor is it to be considered financial advice.
 
The Yen and European Currencies Strengthen after the Fed Meeting
F3RXQrp.jpeg


Yesterday's meeting of the US Federal Reserve disappointed dollar buyers. The rate remained at the same level as expected (5.25–5.50%). However, according to the updated FOMC forecast, it will be reduced three times this year by 0.25%, in contrast to four in the December forecast. The 2025 forecast also shows fewer expectations for rate cuts, just three. Naturally, investors' disappointment with this turn of events resulted in sales of the American currency in almost all directions. Thus, the US dollar/yen currency pair rebounded from recent highs at 151.80 and is currently trading below 151.00, the pound/US dollar retested 1.2800, and euro/US dollar buyers managed to strengthen the pair above 1.0900.

GBP/USD
rHaYBo8.png


Weak data on inflation and producer price index in the UK for February, published yesterday, led to the price falling below 1.2680, but by the evening, pound buyers managed to win back losses and test 1.2800. At the same time, today the pair faces an equally important day, rich in foundations.

A meeting of the Bank of England is scheduled at 15:00 GMT+3, at which a decision on the base interest rate will be made. Analysts assume that the rate will remain at the same level (5.25%). What is important for market participants will be the number of votes of committee members for a rate reduction this year. If the number of officials who believe that the rate should be reduced at the next BoE meetings is more than one, the pound/US dollar pair may decline to 1.2700-1.2600. Otherwise, the price growth on the GBP/USD chart may resume in the direction of 1.3000-1.2900.

TO VIEW THE FULL ANALYSIS, VISIT THE FXOPEN BLOG

Disclaimer: This article represents the opinion of the Companies operating under the FXOpen brand only (excluding FXOpen EU). It is not to be construed as an offer, solicitation, or recommendation with respect to products and services provided by the Companies operating under the FXOpen brand, nor is it to be considered financial advice.
 
Market Analysis: AUD/USD and NZD/USD Signal More Losses
bUkepLi.jpeg


AUD/USD declined below the 0.6575 and 0.6550 support levels. NZD/USD is also moving lower and might trade below the 0.6000 zone.

Important Takeaways for AUD/USD and NZD/USD Analysis Today

  • The Aussie Dollar started a fresh decline from well above the 0.6600 level against the US Dollar.
  • There was a break below a connecting bullish trend line with support at 0.6570 on the hourly chart of AUD/USD at FXOpen.
  • NZD/USD declined steadily from the 0.6105 resistance zone.
  • There was a break below a key bullish trend line with support at 0.6040 on the hourly chart of NZD/USD at FXOpen.

AUD/USD Technical Analysis
yEbO4hA.png


On the hourly chart of AUD/USD at FXOpen, the pair struggled to clear the 0.6635 zone. The Aussie Dollar started a fresh decline below the 0.6600 support against the US Dollar.

The pair even settled below 0.6575 and the 50-hour simple moving average. There was a clear move below the 50% Fib retracement level of the upward move from the 0.6504 swing low to the 0.6634 high. Moreover, there was a break below a connecting bullish trend line with support at 0.6570.

The pair is now trading below the 76.4% Fib retracement level of the upward move from the 0.6504 swing low to the 0.6634 high. On the downside, initial support is near the 0.6520 zone.

The next support sits at 0.6505. If there is a downside break below 0.6505, the pair could extend its decline. The next support could be 0.6455. Any more losses might send the pair toward the 0.6420 support.

On the upside, an immediate resistance is near the 0.6550 level. The next major resistance is near 0.6575, above which the price could rise toward 0.6635. Any more gains might send the pair toward 0.6700.

A close above the 0.6700 level could start another steady increase in the near term. The next major resistance on the AUD/USD chart could be 0.6780.

TO VIEW THE FULL ANALYSIS, VISIT THE FXOPEN BLOG

Disclaimer: This article represents the opinion of the Companies operating under the FXOpen brand only (excluding FXOpen EU). It is not to be construed as an offer, solicitation, or recommendation with respect to products and services provided by the Companies operating under the FXOpen brand, nor is it to be considered financial advice.
 
AAPL Share Price Falls More Than 4% after Antitrust Lawsuit
50G74yx.jpeg


Yesterday, the Department of Justice filed an antitrust lawsuit against Apple, alleging that the company has established a monopoly with the iPhone, which has harmed consumers, developers and competitors.

“Each step in Apple's course of conduct built and reinforced the moat around its smartphone monopoly,” the government said in the 88-page lawsuit.

The result of news of the lawsuit was a sharp decline in Apple's share price by more than 4%. This is a serious blow to stocks that are already underperforming the broader market. As confirmation, we note that yesterday, the ratio of the S&P 500 index to the AAPL share price set a maximum since November 2021.

The chart for AAPL stock shows an increasingly bearish picture:

9ek2StJ.png


TO VIEW THE FULL ANALYSIS, VISIT THE FXOPEN BLOG

Disclaimer: This article represents the opinion of the Companies operating under the FXOpen brand only (excluding FXOpen EU). It is not to be construed as an offer, solicitation, or recommendation with respect to products and services provided by the Companies operating under the FXOpen brand, nor is it to be considered financial advice.
 
GBP/USD Price Falls to 1.26 after Bank of England Decision
kZY0UvR.jpeg


Yesterday, the GBP/USD market experienced a day of intense volatility due to a number of news items. According to Trading Economics:

→ UK retail sales were flat last month after a strong rise of 3.6% in January, contrasting with market expectations of a 0.3% decline.

→ The Bank of England decided to leave interest rates unchanged. However, its head Andrew Bailey hinted at a potential reduction in interest rates. He noted positive indicators of lower inflation but stressed the need for greater confidence in managing price pressures.

Thus, a clearer prospect of easing monetary policy in the UK (which, however, is relevant for many countries) has become a driver for the weakening of the British pound.

CzOrSyQ.png


TO VIEW THE FULL ANALYSIS, VISIT THE FXOPEN BLOG

Disclaimer: This article represents the opinion of the Companies operating under the FXOpen brand only (excluding FXOpen EU). It is not to be construed as an offer, solicitation, or recommendation with respect to products and services provided by the Companies operating under the FXOpen brand, nor is it to be considered financial advice.
 
Watch FXOpen's 18 - 22 March Weekly Market Wrap Video

Weekly Market Wrap With Gary Thomson: S&P500, USD, SNB, TSLA


Get the latest scoop on the week's hottest headlines, all in one convenient video. Join Gary Thomson, the COO of FXOpen UK, as he breaks down the most significant news reports and shares his expert insights.

  • The Price of the S&P 500 Set a Historical Record amid News from the Fed #SP500 #theFed
  • US Dollar Shows Record Weekly Gain Since Mid-January #USD
  • USD/CHF Analysis: SNB Decision Breaks Multi-month Trend #USDCHF #SNB
  • TSLA analysis: Price Returns to Above the $170 Level, But for How Long? #TSLA #Tesla

Stay in the know and empower yourself with our short, yet power-packed video.

Watch it now and stay updated with FXOpen.


Don't miss out on this invaluable opportunity to sharpen your trading skills and make informed decisions.


FXOpen YouTube


Disclaimer: This article represents the opinion of the Companies operating under the FXOpen brand only (excluding FXOpen EU). It is not to be construed as an offer, solicitation, or recommendation with respect to products and services provided by the Companies operating under the FXOpen brand, nor is it to be considered financial advice.

#fxopen #fxopenyoutube #fxopenint #weeklyvideo
 
Bitcoin Price Recovered over the Weekend, But Market Anxiety Remains
YdnHO8y.jpeg


From the point of view of technical analysis of BTC/USD, on Friday evening the price of Bitcoin was near the lower boundary of the ascending channel (shown in blue). This was alarming as it indicated that the market action could result in a weekly bearish candle forming with the price of BTC down by around 5% — something that hasn't happened since August of last year.

However, this did not happen, as the price recovered over the weekend, forming rebounds from the lower border of the channel. The lower shadows of the candles are a sign of demand forces. Moreover, the bulls have broken through the downward trend line (shown in black). Will the bulls be able to return the price of Bitcoin to an upward trajectory within the specified trend?

Doubts remain.

→ Bitcoin “still looks overbought,” JPMorgan strategists warned, predicting a decline to USD 42k.

HgrVnBp.jpeg


TO VIEW THE FULL ANALYSIS, VISIT FXOPEN BLOG

Disclaimer: This article represents the opinion of the Companies operating under the FXOpen brand only (excluding FXOpen EU). It is not to be construed as an offer, solicitation, or recommendation with respect to products and services provided by the Companies operating under the FXOpen brand, nor is it to be considered financial advice.
 
Back
Top