Daily Market Analysis By FXOpen

Market Analysis: EUR/USD Starts Recovery, USD/CHF Could Extend Gains
w2TC4P7.jpeg


EUR/USD is attempting a recovery wave from the 1.0725 zone. USD/CHF climbed higher above 0.9070 and might extend gains in the near term.

Important Takeaways for EUR/USD and USD/CHF Analysis Today

  • The Euro declined toward 1.0725 before it started a recovery wave against the US Dollar.
  • There was a break above a key bearish trend line with resistance at 1.0765 on the hourly chart of EUR/USD at FXOpen.
  • USD/CHF climbed higher above the 0.9035 and 0.9070 resistance levels.
  • There was a break above a major bearish trend line with resistance at 0.9035 on the hourly chart at FXOpen.

EUR/USD Technical Analysis
3hoCvTV.png

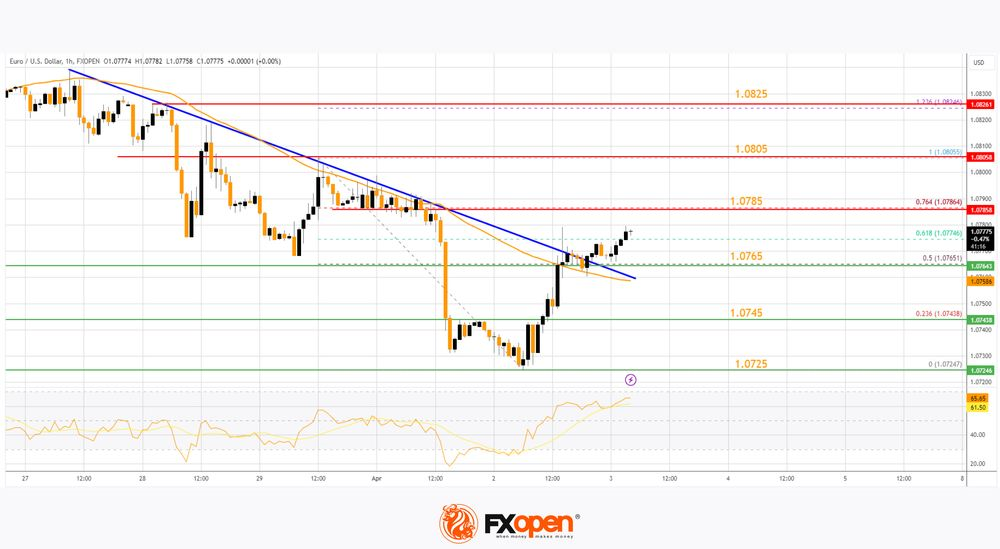
On the hourly chart of EUR/USD at FXOpen, the pair extended the decline below the 1.0785 support zone. The Euro even declined below 1.0750 before the bulls appeared against the US Dollar, as mentioned in the previous analysis.

The pair traded as low as 1.0724 and recently started a recovery wave. There was a move above the 1.0745 resistance zone. Besides, there was a break above a key bearish trend line with resistance at 1.0765.

The bulls pushed the pair above the 50-hour simple moving average and the 50% Fib retracement level of the downward move from the 1.0805 swing high to the 1.0724 low.

Immediate resistance on the EUR/USD chart is near the 1.0785 zone. It is close to the 76.4% Fib retracement level of the downward move from the 1.0805 swing high to the 1.0724 low. The first major resistance is near the 1.0805 level.

An upside break above the 1.0805 level might send the pair toward the 1.0825 resistance. The next major resistance is near the 1.0850 level. Any more gains might open the doors for a move toward the 1.0920 level.

Immediate support on the downside sits at 1.0765. The next major support is the 1.0745 zone. A downside break below the 1.0745 support could send the pair toward the 1.0725 level. Any more losses might send the pair to 1.0650.

TO VIEW THE FULL ANALYSIS, VISIT FXOPEN BLOG

Disclaimer: This article represents the opinion of the Companies operating under the FXOpen brand only (excluding FXOpen EU). It is not to be construed as an offer, solicitation, or recommendation with respect to products and services provided by the Companies operating under the FXOpen brand, nor is it to be considered financial advice.
 
USD/JPY Analysis: Calm Before the Storm?
dMs3hqV.jpeg


The USD/JPY chart today shows that the rate has stabilized at 152 yen per US dollar. But can we say that there is calm in the market?

Hardly.

First, it is important to note that in 2023 there was a sharp reversal of trend around the 152.00 level due to intervention by the Japanese authorities, which supported an excessively weak yen. Therefore, crossing this psychological threshold can serve as a trigger for a new intervention.

Secondly, Reuters writes about a growing volatility premium in the options market, which confirms the growing likelihood of a strong trend in the near future.

gScvNak.png


TO VIEW THE FULL ANALYSIS, VISIT FXOPEN BLOG

Disclaimer: This article represents the opinion of the Companies operating under the FXOpen brand only (excluding FXOpen EU). It is not to be construed as an offer, solicitation, or recommendation with respect to products and services provided by the Companies operating under the FXOpen brand, nor is it to be considered financial advice.
 
The US Stock Market Awaits the Publication of NFP And Unemployment Data
WANkRpP.jpeg


Important events of this week for investors and traders in the US stock market could be the employment news, which will be published tomorrow at 15:30 GMT+3:
→ non-Farm Payrolls (NFP) report for March. According to CNN, analysts expect nonfarm payrolls to rise by 192,500 in March. NFP for February was 275,000, according to FactSet.
→ data on the unemployment rate (Unemployment Rate). According to ForexFactory, the unemployment rate is expected to remain unchanged at 3.9%.

The state of the labour market is under close scrutiny by the Fed and could provide valuable insight into the prospects for interest rate cuts. The release of the unemployment rate and NFP numbers for March could be an example of what is called "bad news is good news" on Wall Street. After all, if the data shows a deterioration in the labour market, then this will be an argument for the Fed to lower interest rates, which in turn could lead to an increase in the stock market.

Indeed, according to CNN, Fed Chairman Jerome Powell said last week that a weakening labour market would be a reason to cut interest rates.

lhT6ZyB.png


TO VIEW THE FULL ANALYSIS, VISIT FXOPEN BLOG

Disclaimer: This article represents the opinion of the Companies operating under the FXOpen brand only (excluding FXOpen EU). It is not to be construed as an offer, solicitation, or recommendation with respect to products and services provided by the Companies operating under the FXOpen brand, nor is it to be considered financial advice.
 
Brent Oil Price Reaches Its Highest Since October 2023.
6xaQweM.jpeg


The Brent oil chart today shows that the price has exceeded USD 89 per barrel — this is the highest level since the end of October 2023.

Reasons for strong demand for oil:
→ The OPEC+ meeting ended this week. Exporting countries maintained their policy of limiting oil production unchanged.
→ Ukrainian drone attacks on oil refineries in Russia.
→ Latest data on the strength of the US economy.

4xnOvMZ.png


TO VIEW THE FULL ANALYSIS, VISIT FXOPEN BLOG

Disclaimer: This article represents the opinion of the Companies operating under the FXOpen brand only (excluding FXOpen EU). It is not to be construed as an offer, solicitation, or recommendation with respect to products and services provided by the Companies operating under the FXOpen brand, nor is it to be considered financial advice.
 
Market Analysis: AUD/USD and NZD/USD Remain In Uptrend
3B5xHrz.jpeg


AUD/USD is correcting gains from the 0.6620 zone. NZD/USD is also moving lower and might attempt a fresh increase from 0.6000.

Important Takeaways for AUD USD and NZD USD Analysis Today
  • The Aussie Dollar started a downside correction from 0.6620 against the US Dollar.
  • There is a key bullish trend line forming with support at 0.6550 on the hourly chart of AUD/USD at FXOpen.
  • NZD/USD is also moving lower below the 0.6030 support zone.
  • There is a major bullish trend line forming with support at 0.5995 on the hourly chart of NZD/USD at FXOpen.

AUD/USD Technical Analysis
3jZCn7x.png

On the hourly chart of AUD/USD at FXOpen, the pair started a fresh increase from the 0.6480 support. The Aussie Dollar was able to clear the 0.6535 resistance to move into a positive zone against the US Dollar.

There was a close above the 0.6550 resistance and the 50-hour simple moving average. Finally, the pair tested the 0.6620 zone. A high was formed near 0.6619 and the pair is now correcting gains.

There was a move below the 0.6600 level. The pair declined below the 23.6% Fib retracement level of the upward move from the 0.6480 swing low to the 0.6619 high. On the downside, initial support is near the 50% Fib retracement level of the upward move from the 0.6480 swing low to the 0.6619 high at 0.6550.

There is also a key bullish trend line forming with support at 0.6550. The next support could be 0.6535. If there is a downside break below the 0.6535 support, the pair could extend its decline toward the 0.6480 level. Any more losses might signal a move toward 0.6440.

On the upside, the AUD/USD chart indicates that the pair is now facing resistance near 0.6580. The first major resistance might be 0.6600. An upside break above the 0.6600 resistance might send the pair further higher.

The next major resistance is near the 0.6620 level. Any more gains could clear the path for a move toward the 0.6650 resistance zone.

TO VIEW THE FULL ANALYSIS, VISIT FXOPEN BLOG

Disclaimer: This article represents the opinion of the Companies operating under the FXOpen brand only (excluding FXOpen EU). It is not to be construed as an offer, solicitation, or recommendation with respect to products and services provided by the Companies operating under the FXOpen brand, nor is it to be considered financial advice.
 
TSLA Analysis: Price Recovers after Disastrous Report
qsbJDJV.jpeg


We previously wrote that lower vehicle deliveries could lower TSLA's stock price.

And as it became known on Tuesday, Tesla, led by Elon Musk, delivered just 386,810 cars in the first three months of 2024 - 14% below analysts' forecasts, according to Bloomberg. As a result, Tesla shares fell 4.9% that day, extending their 2024 decline to 33%, the worst performance in the Nasdaq 100 Index.

What is the market outlook?

Bullish arguments:
→ After a strong disappointment on Tuesday, the price of TSLA showed signs of stability on Wednesday and Thursday. Since these were bullish candles, and the market was recovering despite the non-bearish gap on Tuesday, this can be interpreted as a sign of demand.
→ From the point of view of technical analysis, the market is supported by the lower border of the downward channel (shown in red). The price forms rebounds from this border, as shown by the arrows.
→ Bloomberg writes about a decrease in the number of short positions after the report on Tuesday. This could be a sign that short position holders do not see any further decline in the price of TSLA and are taking profits.

Bearish arguments:
→ TSLA price is still in the lower half of the downward channel, despite the bullish sentiment in the stock market.
→ Resistance may come from the level of USD 183 per share and the median line of the descending channel.

rAV2yOH.jpeg


TO VIEW THE FULL ANALYSIS, VISIT FXOPEN BLOG

Disclaimer: This article represents the opinion of the Companies operating under the FXOpen brand only (excluding FXOpen EU). It is not to be construed as an offer, solicitation, or recommendation with respect to products and services provided by the Companies operating under the FXOpen brand, nor is it to be considered financial advice.
 
BTC/USD Analysis: Bearish Arguments Become More Convincing
OHv5QF1.jpeg


On March 18, we wrote about the activation of bears near the USD 70,000 level and the likelihood of consolidation forming near this psychological mark.

On March 25, we wrote that anxiety remains in the Bitcoin market.

Technical analysis of the BTC/USD chart with new data on the behavior of Bitcoin prices today relative to the previously designated levels and lines shows that bearish arguments are becoming more convincing:

→ the median line of the ascending channel acted as resistance (shown by the first arrow);
→ the price has formed a consolidation zone (shown in green) with a subsequent bearish exit from it;

AvR0HB6.jpeg


TO VIEW THE FULL ANALYSIS, VISIT FXOPEN BLOG

Disclaimer: This article represents the opinion of the Companies operating under the FXOpen brand only (excluding FXOpen EU). It is not to be construed as an offer, solicitation, or recommendation with respect to products and services provided by the Companies operating under the FXOpen brand, nor is it to be considered financial advice.
 
Watch FXOpen's 1 - 5 April Weekly Market Wrap Video

Weekly Market Wrap With Gary Thomson: US stock market, EUR/USD, Oil, Gold


Get the latest scoop on the week's hottest headlines, all in one convenient video. Join Gary Thomson, the COO of FXOpen UK, as he breaks down the most significant news reports and shares his expert insights.

  • The US Stock Market Awaits the Publication of NFP and Unemployment Data
  • Market Analysis: EUR/USD Starts Recovery, USD/CHF Could Extend Gains
  • Brent Oil Price Reaches Its Highest Since October 2023
  • Gold Price XAU/USD Sets Another All-time High

Stay in the know and empower yourself with our short, yet power-packed video.

Watch it now and stay updated with FXOpen.


Don't miss out on this invaluable opportunity to sharpen your trading skills and make informed decisions.


FXOpen YouTube


Disclaimer: This article represents the opinion of the Companies operating under the FXOpen brand only (excluding FXOpen EU). It is not to be construed as an offer, solicitation, or recommendation with respect to products and services provided by the Companies operating under the FXOpen brand, nor is it to be considered financial advice.

#fxopen #fxopenyoutube #fxopenint #weeklyvideo
 
FTSE 100's Holy Grail of 8,000 Continues to Be a Pipe Dream
ftse100.jpg


The British economy has been somewhat of an anomaly over the past few years. In no way did the British authorities limit the liberties and livelihoods of the population to the extent that the North American authorities did during 2020 and 2021, and the nation has far less national debt.

Britain's banking industry is also less notorious for high profile, large scale collapses of long established institutions, and its overall investing mentality is very conservative compared to the gung-ho nature of the United States capital markets and commercial investing culture.

The differences between some of the largest stock markets in the world are also indicators of this differential. The technology-focused NASDAQ exchange in New York is a bastion of volatility and comprises the 'Magnificent 7' Silicon Valley internet companies as well as a raft of startups which suddenly gained multi-billion dollar valuations and entered the public listing arena via SPAC blank cheque companies.

By contrast, Britain's FTSE 100 index, which represents the 100 most highly capitalised companies whose stock is listed on the London Stock Exchange, represents more traditional, bricks and mortar businesses in more 'grey suit' sectors such as transport, construction, energy giants, retail chains and pharmaceuticals.

The FTSE 100 has been very buoyant recently however over the past few weeks, the index stopped short of the much anticipated 8,000 mark, and its performance has been slowly tailing off.

On March 1, the FTSE 100 reached 7,978 points after a month-long rally, which made it look as if 8,000 points was in easy reach, but since the beginning of last month, it has been decreasing in value, today standing at 7,925.4 at 8.30 am as the excitement of the week's trading begins in London.

TO VIEW THE FULL ANALYSIS, VISIT FXOPEN BLOG

Disclaimer: This article represents the opinion of the Companies operating under the FXOpen brand only (excluding FXOpen EU). It is not to be construed as an offer, solicitation, or recommendation with respect to products and services provided by the Companies operating under the FXOpen brand, nor is it to be considered financial advice.
 
BTC/USD Analysis: Bitcoin Price Rises Ahead of Halving
btcusd.jpg


The halving (reduction of block mining rewards) is expected to occur on April 19-20.

Theoretically, Bitcoin mining will become less profitable, leading to a reduction in coin supply. Given unchanged demand, this should drive up the BTC/USD price. Ripple CEO Brad Garlinghouse has forecasted that the cryptocurrency market cap will double by the end of 2024, reaching $5 trillion, with Bitcoin's halving contributing to this growth.

In practice, Bitcoin price is influenced by too many factors to conclusively prove the bullish impact of halving. For instance, looking at history, the last halving occurred on May 11, 2020, and the price increased by approximately 12% in the following week. On the other hand, today's Bitcoin price might already reflect the imminent halving.

Nevertheless, the market currently shows predominantly positive sentiment, as over the weekend, BTC/USD price rose by around 2.5%.

btcusdx.jpg


TO VIEW THE FULL ANALYSIS, VISIT FXOPEN BLOG

Disclaimer: This article represents the opinion of the Companies operating under the FXOpen brand only (excluding FXOpen EU). It is not to be construed as an offer, solicitation, or recommendation with respect to products and services provided by the Companies operating under the FXOpen brand, nor is it to be considered financial advice.
 
Back
Top