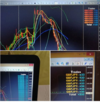
It looks like the item in the corner is just a total of pips scored within a pre-determined period of time. Seems a little odd that all the numbers are positive in all 3 views. No idea where this came from, but there are coding services which could make something like this for a reasonable price.
The chart iself has lines which look suspiciously like an assortment of moving averages.
This site uses cookies to help personalise content, tailor your experience and to keep you logged in if you register.
By continuing to use this site, you are consenting to our use of cookies.