EUR/USD Daily Video, May 03, 2013

Sive Morten

Special Consultant to the FPA
Messages
18,760
Good morning,
yesterday market has shown reasonable plunge. Although currently there is a potential for bullish daily stop grabber pattern - I'm not very fascinating with it and think that it will be better to stay flat today. Despite the direction that market will choose today - we will have a lot of time to possess ourselves with it, we do not need to hurry right now:


The technical portion of Sive's analysis owes a great deal to Joe DiNapoli's methods, and uses a number of Joe's proprietary indicators. Please note that Sive's analysis is his own view of the market and is not endorsed by Joe DiNapoli or any related companies.
 
Last edited by a moderator:
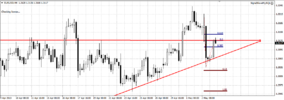
eurusd-h4-instaforex-group.png

Dear Sive,

Thanks for your analysis. Am attaching my chart for 4Hours. I Drew that triangle since 3 weeks ago when we were nursing the potential H&S Pattern.
The upper border of the triangle was broken on the 30th of April and the price returned back into the triangle yesterday, and couldn't close below the lower border of the triangle. I drew the fibonacci retracements from the most recent high at 1.3217 to the most recent low at 1.3036. Since you said/I've also observed that EURUSD likes the 50% retracement, price action currently flirts with the upper border of the triangle and that's where the 50% retracement is. Market has not closed above it on the 4Hour TF. I also drew a Fibonacci Extension AB=CD of A=1.3217, B=1.3036 and C=1.3136. 61.8 extension stands around the area 1.3025

My Question: Can take a short position based on this resistance cluster and also can I take profit from 1.3025?

Thanks alot.
 
View attachment 9162

Dear Sive,

Thanks for your analysis. Am attaching my chart for 4Hours. I Drew that triangle since 3 weeks ago when we were nursing the potential H&S Pattern.
The upper border of the triangle was broken on the 30th of April and the price returned back into the triangle yesterday, and couldn't close below the lower border of the triangle. I drew the fibonacci retracements from the most recent high at 1.3217 to the most recent low at 1.3036. Since you said/I've also observed that EURUSD likes the 50% retracement, price action currently flirts with the upper border of the triangle and that's where the 50% retracement is. Market has not closed above it on the 4Hour TF. I also drew a Fibonacci Extension AB=CD of A=1.3217, B=1.3036 and C=1.3136. 61.8 extension stands around the area 1.3025

My Question: Can take a short position based on this resistance cluster and also can I take profit from 1.3025?

Thanks alot.

Hi,
since we've got daily bullish stop grabber - that is opposite to your potential position, this could care significant risk of loss taking.
 
Back
Top