Sive Morten
Special Consultant to the FPA
- Messages
- 18,869
I leave quarterly and monthly charts intact – nothing really new there.
Quarterly
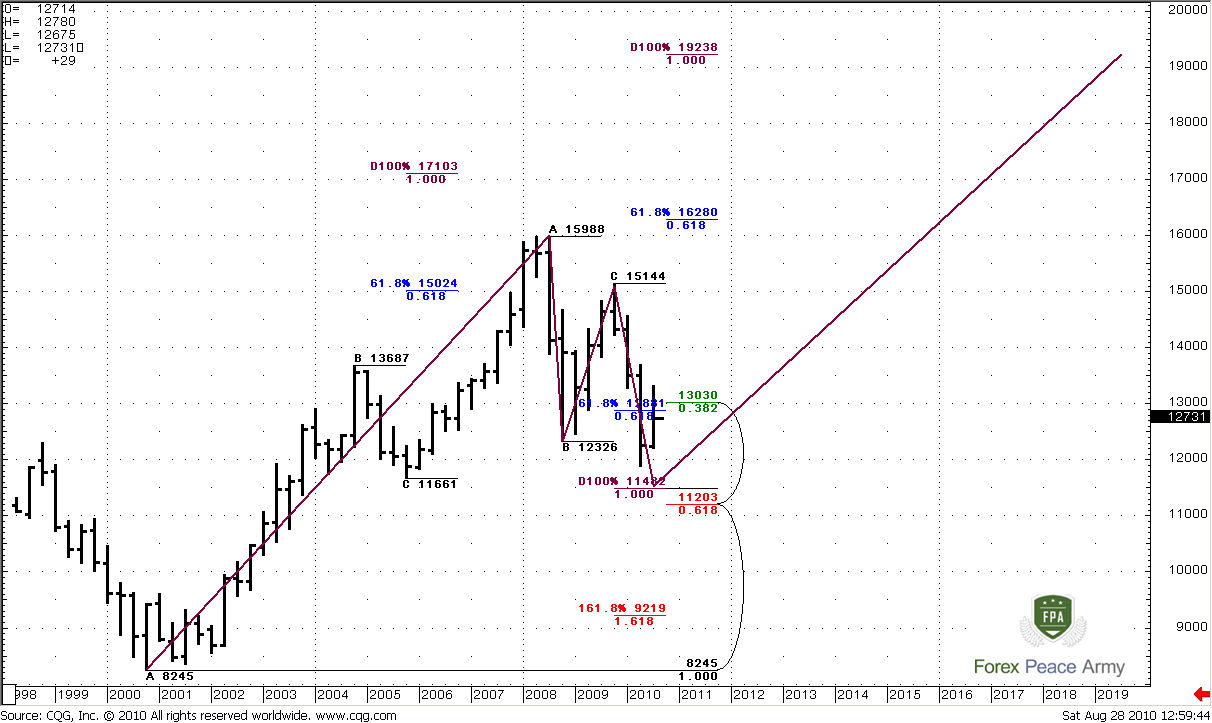
There are not much new on a monthly chart, that’s why I want you to show the very big picture of current events – quarterly chart. It’s really interesting. First of all, during early ABC-bottom move market has reached 61.8% expansion and turned to nice AB-CD retracement. Now, as you understand we are in CD leg. This AB-CD move harmonic enough to speak about possible reversal to the upside in D point around 1.14 area. This is also a Fib support that gives us an Agreement in 1.1380-1.1480. Besides, take a note that this area is below previous C=1.1661, so if it will be reached, we should treat the initial move up not as ABCD but as AB move rather. In this case we will get a huge ABCD pattern: A=0.8245, B=1.5988, C=1.1480 and D =1.9238.
Most interesting for us now is AB-CD correction to the downside. Market has reached 61.8% expansion at 1.2881 and passed through it. Now it has started retracement to the upside. Theoretically speaking, after reaching 61.8% market should not show deep retracement, it should not return higher than 1.30-1.31 area. And soon market should continue it’s move to 1.14-1.15 target, because, again, this AB-CD looks harmonic, and if market has moved below 61.8% already, in most cases it reaches target at D point – 100% expansion from AB leg.
But this is a very large picture, and obvious that we can’t trade it. Nevertheless, to see the large picture is useful for understanding of current situation.
Monthly
Trend is bearish; market has pierced 1.3123 area and pulled back. For now it looks like wash & rinse of this level, but current month is not closed yet.
The blue line is a lower border of DiNapoli Oscillator Predictor. When market touches it or even pierces – it means that market is oversold. In 2008 market was extremely oversold compares to 2010, when market just touched the line. That’s why I see current level of retracement to 1.33 area as logical. If you remember, I’ve told that market should show 0.382 or 0.5 retracement up, because it not so oversold as in 2008, when it has shown 0.618 retracement to the upside. So, now market has reached semi-position between 0.382 and 0.5. If market will continue up move, then the next resistance is roughly 1.35area.
1.26-1.2650 area is still in play. It has held the market during the previous week and still holds it. This is 50% retracement of a strong up bar and also a previous point of extremes. Market has touched it very often since 2004. Price action often found support or resistance at this level. Keep in mind this level, because we will be talking about it later.
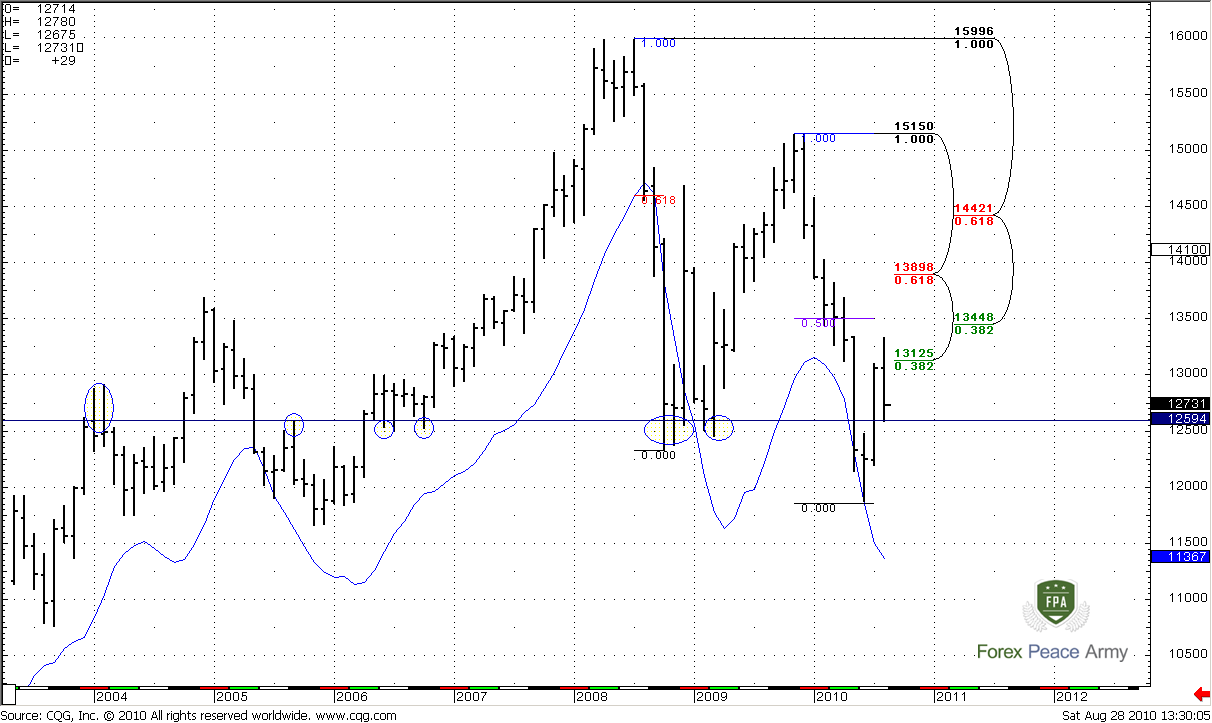
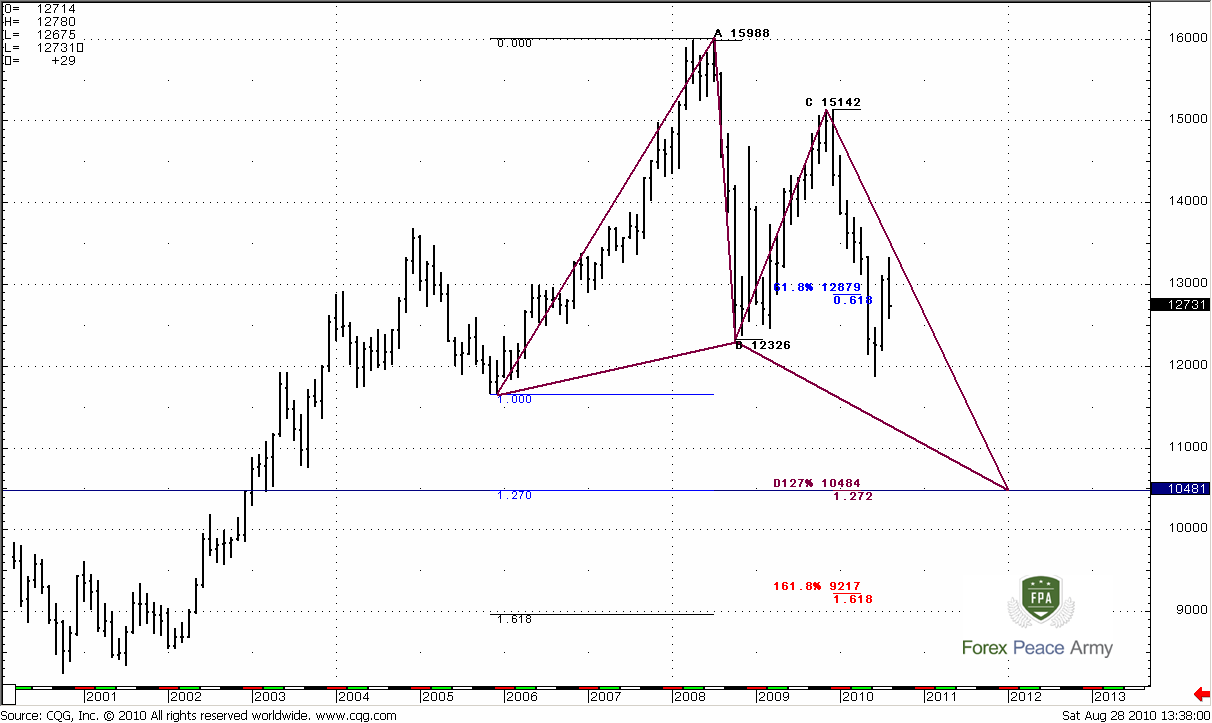
Another interesting picture is a butterfly on a monthly chart with the nearest target around 1.050 area. Also take a note that 1.27 ABCD target is also in this area
Monthly2
Weekly
If you remember, on the previous week we’ve discussed the possibility not only downward momentum trade with 1.2450 target, but also a possibility of shorter-term upward momentum trade. I was not sure about the last one, because the thrust up has sharply eight up bars – the minimum required amount. But now looks like this trade has started - market has reached 0.618 support and turned to the upside. So, what does it mean? It means that we should reach 1.3050 area with high probability and this is our context for lower time frames, and this context is up. The additional confirmation has come from yesterday’s close – market has closed above monthly pivot point. Will market will go further than 1.3050? Who knows… But currently there is enough information for next week.
That’s being said, I expect that market should reach 1.3050 area at near term. This fact gives us upward context for the next week.

Daily
Daily chart is particular important for next week. As you remember, our finish target, based on weekly chart is major 0.618 resistance at 1.3048. At the same time, on daily chart we have intermediate strong resistance, that can be used twofold. If you’re already have long positions – you will be able to take chips off the table, if you’re flat and weren’t be in time to enter long – you will have another chance to enter, because I expect that market should bounce from there. This is 1.2935-1.2957 area. In includes Agreement of 1.618% expansion target and Fib. resistance. Also there is a weekly pivot resistance 1 a bit higher – at 1.2976.
Daily chart also confirms the upside potential. First of all – daily trend turns bullish, price action confirms that. Second, market has reached 100% expansion from ABC move and risen above it. This is a sign of strength. And, finally, as I’ve said – market has closed above monthly pivot point. We have no overbought/oversold currently, so I would like to be a Buyer.

Let’s discuss potential levels to enter long on daily chart#2
As you remember, during the previous week, I’ve told that current price action could be a reverse H&S pattern. Although, I’ve expected to see the left shoulder, market has shown the complex double head. Anyway, will it be H&S or not, personally, I’ll be watching for 1.2752-1.2780 Fib. Confluence supports as a possible enter. I like to see some symmetry in market price action and this level is perfect from this point of view. Other levels, that also worthy to mention here are: 1.28-1.2810 combination of weekly pivot point and Fib. support and last gasp for bulls – 1.2702-1.2705 combination of weekly pivot support 1 and deep Fib. support.

I think that there two areas that are suitable for enter long on the next week – 1.28-1.2807 and 1.2752-1.2780. Personally, I like the second one for now, because still think that this can be a H&S reverse pattern. And move to this area seems logical.
4-Hour
On this time frame we can see picture in more details, and here are not only single possibility for enter. The nearest area of support – 1.2845-1.2850 Confluence support and previous high. Next strong area – 1.2822 Confluence support. Also, we can see that around 1.2775 area – another Fib support that gives us tight confluence compare to daily one – 1.2776-1.2779. For now it’s very difficult to say, from which area is better to enter long. Look for price action – if market will show thrust from level, intraday trend will turn bullish – probably this is it. But I still think that 1.2775 is a good area.

The technical portion of Sive's analysis owes a great deal to Joe DiNapoli's methods, and uses a number of Joe's proprietary indicators. Please note that Sive's analysis is his own view of the market and is not endorsed by Joe DiNapoli or any related companies.
Quarterly
There are not much new on a monthly chart, that’s why I want you to show the very big picture of current events – quarterly chart. It’s really interesting. First of all, during early ABC-bottom move market has reached 61.8% expansion and turned to nice AB-CD retracement. Now, as you understand we are in CD leg. This AB-CD move harmonic enough to speak about possible reversal to the upside in D point around 1.14 area. This is also a Fib support that gives us an Agreement in 1.1380-1.1480. Besides, take a note that this area is below previous C=1.1661, so if it will be reached, we should treat the initial move up not as ABCD but as AB move rather. In this case we will get a huge ABCD pattern: A=0.8245, B=1.5988, C=1.1480 and D =1.9238.
Most interesting for us now is AB-CD correction to the downside. Market has reached 61.8% expansion at 1.2881 and passed through it. Now it has started retracement to the upside. Theoretically speaking, after reaching 61.8% market should not show deep retracement, it should not return higher than 1.30-1.31 area. And soon market should continue it’s move to 1.14-1.15 target, because, again, this AB-CD looks harmonic, and if market has moved below 61.8% already, in most cases it reaches target at D point – 100% expansion from AB leg.
But this is a very large picture, and obvious that we can’t trade it. Nevertheless, to see the large picture is useful for understanding of current situation.
Monthly
Trend is bearish; market has pierced 1.3123 area and pulled back. For now it looks like wash & rinse of this level, but current month is not closed yet.
The blue line is a lower border of DiNapoli Oscillator Predictor. When market touches it or even pierces – it means that market is oversold. In 2008 market was extremely oversold compares to 2010, when market just touched the line. That’s why I see current level of retracement to 1.33 area as logical. If you remember, I’ve told that market should show 0.382 or 0.5 retracement up, because it not so oversold as in 2008, when it has shown 0.618 retracement to the upside. So, now market has reached semi-position between 0.382 and 0.5. If market will continue up move, then the next resistance is roughly 1.35area.
1.26-1.2650 area is still in play. It has held the market during the previous week and still holds it. This is 50% retracement of a strong up bar and also a previous point of extremes. Market has touched it very often since 2004. Price action often found support or resistance at this level. Keep in mind this level, because we will be talking about it later.
Another interesting picture is a butterfly on a monthly chart with the nearest target around 1.050 area. Also take a note that 1.27 ABCD target is also in this area
Monthly2
Weekly
If you remember, on the previous week we’ve discussed the possibility not only downward momentum trade with 1.2450 target, but also a possibility of shorter-term upward momentum trade. I was not sure about the last one, because the thrust up has sharply eight up bars – the minimum required amount. But now looks like this trade has started - market has reached 0.618 support and turned to the upside. So, what does it mean? It means that we should reach 1.3050 area with high probability and this is our context for lower time frames, and this context is up. The additional confirmation has come from yesterday’s close – market has closed above monthly pivot point. Will market will go further than 1.3050? Who knows… But currently there is enough information for next week.
That’s being said, I expect that market should reach 1.3050 area at near term. This fact gives us upward context for the next week.
Daily
Daily chart is particular important for next week. As you remember, our finish target, based on weekly chart is major 0.618 resistance at 1.3048. At the same time, on daily chart we have intermediate strong resistance, that can be used twofold. If you’re already have long positions – you will be able to take chips off the table, if you’re flat and weren’t be in time to enter long – you will have another chance to enter, because I expect that market should bounce from there. This is 1.2935-1.2957 area. In includes Agreement of 1.618% expansion target and Fib. resistance. Also there is a weekly pivot resistance 1 a bit higher – at 1.2976.
Daily chart also confirms the upside potential. First of all – daily trend turns bullish, price action confirms that. Second, market has reached 100% expansion from ABC move and risen above it. This is a sign of strength. And, finally, as I’ve said – market has closed above monthly pivot point. We have no overbought/oversold currently, so I would like to be a Buyer.
Let’s discuss potential levels to enter long on daily chart#2
As you remember, during the previous week, I’ve told that current price action could be a reverse H&S pattern. Although, I’ve expected to see the left shoulder, market has shown the complex double head. Anyway, will it be H&S or not, personally, I’ll be watching for 1.2752-1.2780 Fib. Confluence supports as a possible enter. I like to see some symmetry in market price action and this level is perfect from this point of view. Other levels, that also worthy to mention here are: 1.28-1.2810 combination of weekly pivot point and Fib. support and last gasp for bulls – 1.2702-1.2705 combination of weekly pivot support 1 and deep Fib. support.
I think that there two areas that are suitable for enter long on the next week – 1.28-1.2807 and 1.2752-1.2780. Personally, I like the second one for now, because still think that this can be a H&S reverse pattern. And move to this area seems logical.
4-Hour
On this time frame we can see picture in more details, and here are not only single possibility for enter. The nearest area of support – 1.2845-1.2850 Confluence support and previous high. Next strong area – 1.2822 Confluence support. Also, we can see that around 1.2775 area – another Fib support that gives us tight confluence compare to daily one – 1.2776-1.2779. For now it’s very difficult to say, from which area is better to enter long. Look for price action – if market will show thrust from level, intraday trend will turn bullish – probably this is it. But I still think that 1.2775 is a good area.
The technical portion of Sive's analysis owes a great deal to Joe DiNapoli's methods, and uses a number of Joe's proprietary indicators. Please note that Sive's analysis is his own view of the market and is not endorsed by Joe DiNapoli or any related companies.
