Sive Morten
Special Consultant to the FPA
- Messages
- 18,869
Monthly
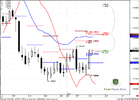
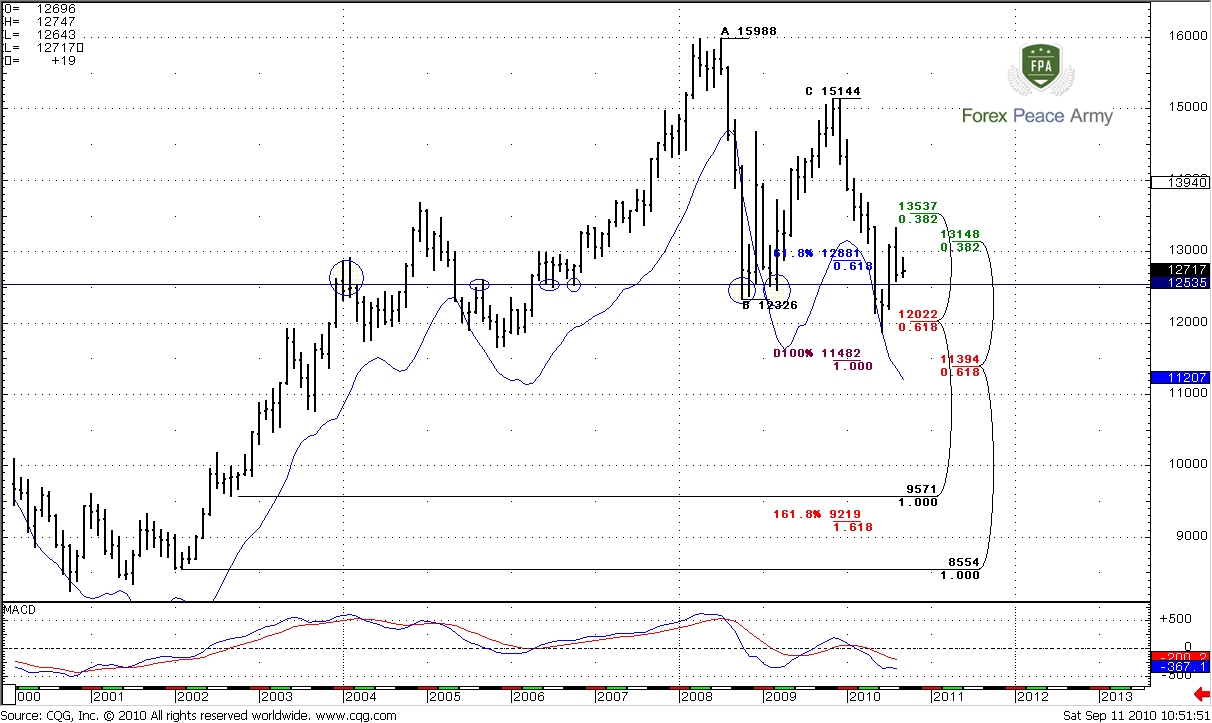
Trend is bearish. The blue line on the chart is DiNapoli Oscillator Predictor that shows level of oversold. Market has reached Fib support at 1.2022 in accordance with oversold (this calls “Stretch” pattern by the way), and shows pull back. I’ve marked 1.2550 area with horizon blue line – look, how often market has found support or resistance around this level.
The next monthly target is Agreement of 100% expansion of ABC pattern and 1.1394 Fib support.
Monthly#1
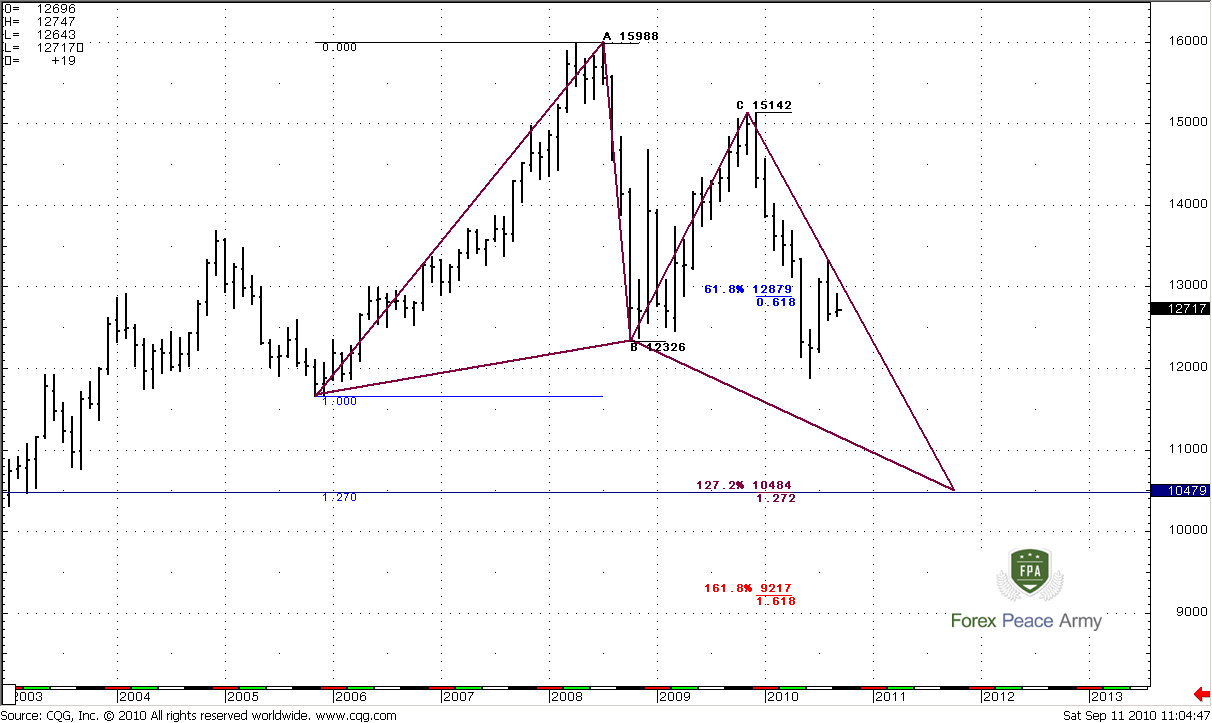
Also we can see perfect 1.27 Butterfly Buy pattern with the target around 1.05. Another interesting moment is that 1.27 expansion of ABC-pattern almost precisely coincides with this level. But we should talk about it in more details if we will get 1.15 target first.
Monthly#2
Weekly
Weekly trend is bullish, no oversold or overbought condition right now on the market. Weekly chart has a lot of interesting stuff that tremendously coincides with monthly levels. So, I offer start with our previous week’s affairs – momentum trades, and then pass to new information that weekly chart can give us.
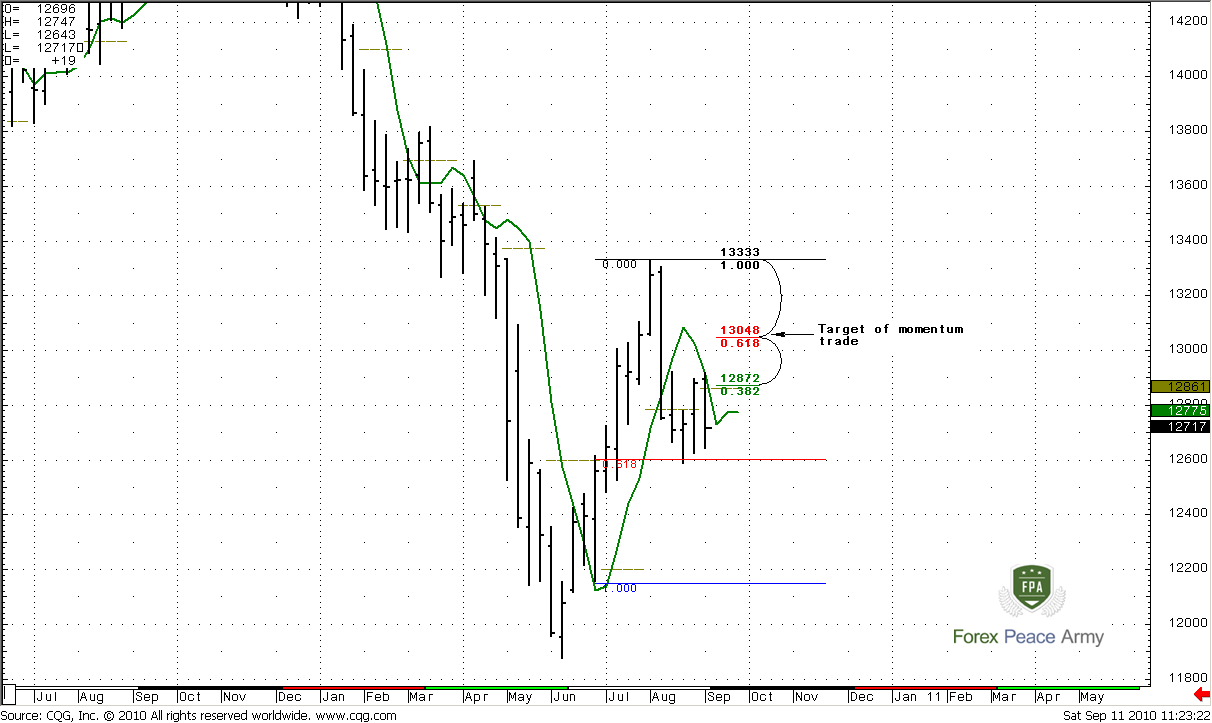
1. Upward momentum trade.
I just want to remind you the context of this trade. Market has shown thrust up with 7 up bars, separation from 3x3 DMA (green line) was good. Although I like to see more than 7 bars, but this could work. Besides, on the weekly time frame, market very often showed momentum trades with 5 or 6 bars. Market has reached Fib support around 1.2605 and started to pull back. The target of this trade – 0.618 retracement of whole move down after thrust – 1.3048. You can clearly see all these levels on the chart. Usually momentum trade should start to work during 1-3 closes below 3x3 and on the previous week was seemed that it has started. But then something has become wrong – market has reached strong resistance with monthly pivot and 3/8 Fib resistance and pulled back. So, for now it’s very difficult to say – will it be finished at 1.3048 or not. But, personally, I will be look for another context if I’ll intend to enter Long.
Weekly#1
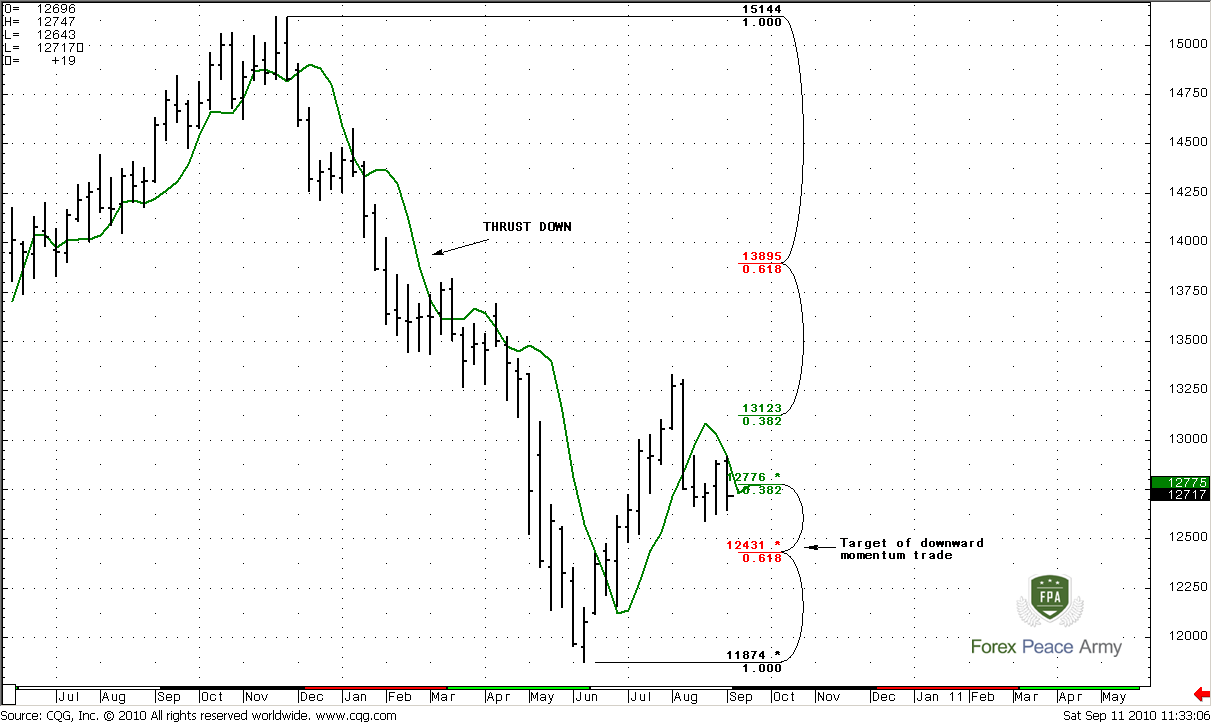
2. Downward momentum trade
Now, as you remember, we also have talked about larger momentum trade, that is to the downside. And context for this trade is a previous huge thrust down. The minimum target of this trade – 5/8 Fib support from the whole up move retracement from this swing down. Look at the picture.
This trade is working still, but also has it’s own defects. First of all, I do not like too deep move after crossing of 3x3 DMA (green line) to the upside. But if we take into consideration the reason for the previous sell-off (EU and Greece problems), then, may be everything will be ok with this trade. Besides, the monthly trend supports the direction of this weekly signal.
Weekly#2
And now I’d like to show you something really exciting…
Weekly#3
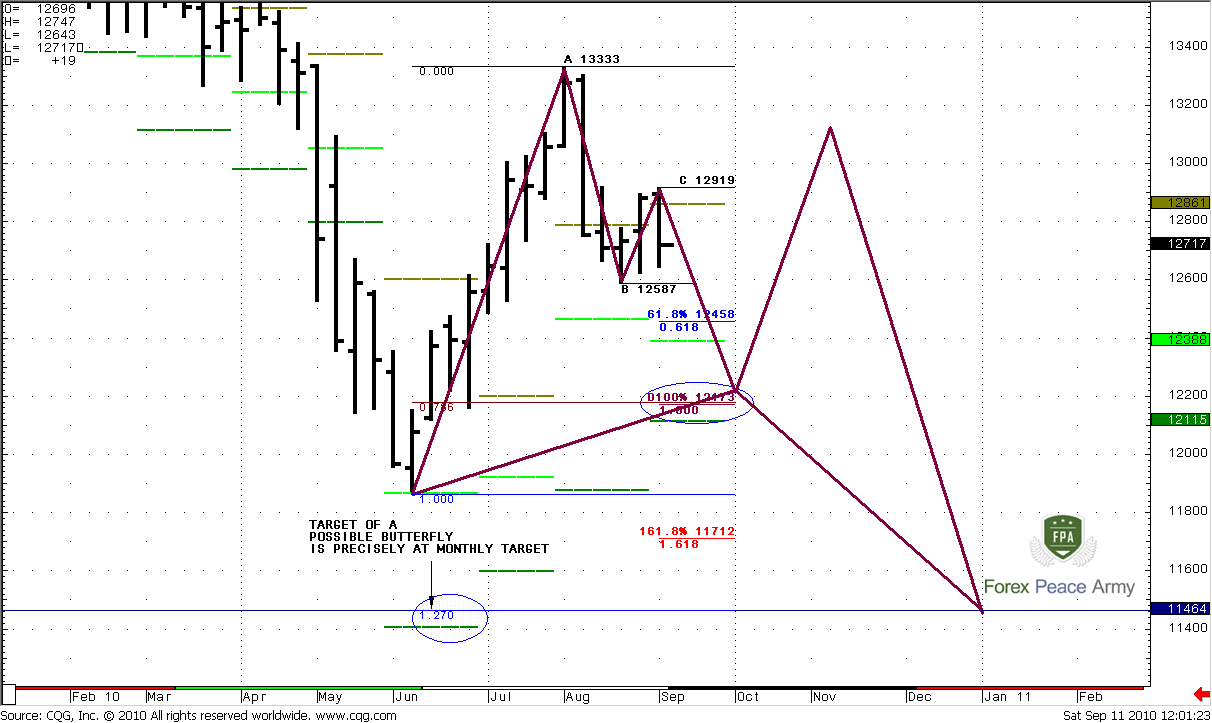
First of all look at this ABCD pattern. The 100% expansion target precisely at 0.786 Fib deep support that is very typical for butterflies patterns. 61.8% expansion target is also at Agreement by the way, with 0.618 Fib support (we’ve talked about this already in daily video).Also look at green dash lines near both of the targets – this is monthly pivot supports 1 and 2. Both levels are very strong supports areas.
And, the most important – the 1.272 target of this butterfly – precisely at monthly Agreement area around 1.14-1.15. But this forecast has some critical points. First, we need, that AB-CD move will not break previous lows. So, the lows around 1.19 should hold. And, second, market should not move higher, than A point around 1.3333. It will be much better if upward retracement will be stopped by 0.786 resistance (almost like I draw it). At the same time, there can happen some secondary changes that will not cancel the butterfly in general. For example, if C-point due to daily move will shift a bit higher, then, probably, market can reach 5/8 support rather then 0.786 during the move down due AB-CD, or something like that.
I think this will be interesting to watch, how this figure will develop…
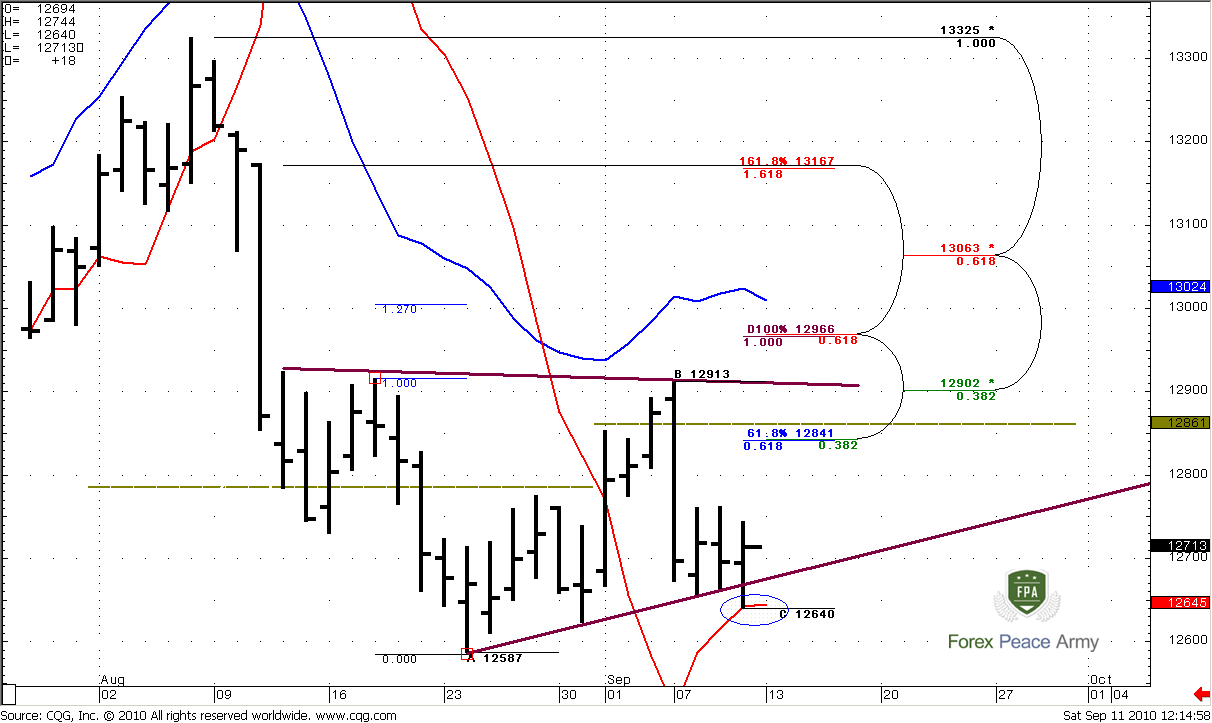
Daily
Daily chart is a bit overload with details, so let’s me explain all these stuff. First of all, I would like to return to our Friday’s conversation about MACDP failure signal. The red line on the chart is MACD Predictor. Now we have a confirmation of trend shifting failure, because market has tried to shift trend to bearish, move below MACDP in the beginning of the day, but close above it and didn’t not confirm bearish trend. (small ellipse on the chart). Simultaneously this was a failure breakout of the trend line. Odds suggest that this kind of price action very often leads to move to previous highs, i.e. to the upside. Also I have to note here, that the appearance of this kind of signal does not tell, that this move should start immediately. Market can form the same signal for some days without strong moves. Anyway, the main question is - how fart this move can be – till the highs just around 1.2760 area or till 1.2913?
For myself I mark two possible targets – 1.2850 – monthly pivot and 61.8% expansion from ABC-bottom pattern and possible triangle upper breakout failure with target of this breakout around 1.2960-1.3030. But, why breakout should fail? Well, because this is a very strong resistance in this area – 100% expansion target from ABC move , that creates an Agreement with Fib resistance level. Also there is a daily overbought area (although it will change after some time) and target of our possible 1.272 daily Butterfly sell pattern, that we’ve talked about on previous week. So, the judgment about realness of possible breakout is up to you, but I think that market’s failure in this area is more probable.
Also, take note of 1.2760 area. I do not have it on the chart, but this is a weekly pivot point for the next week. It coincides with the nearest previous high around 1.2763. If market will not be able to break above it, then, possibly market will intend to take only this high…
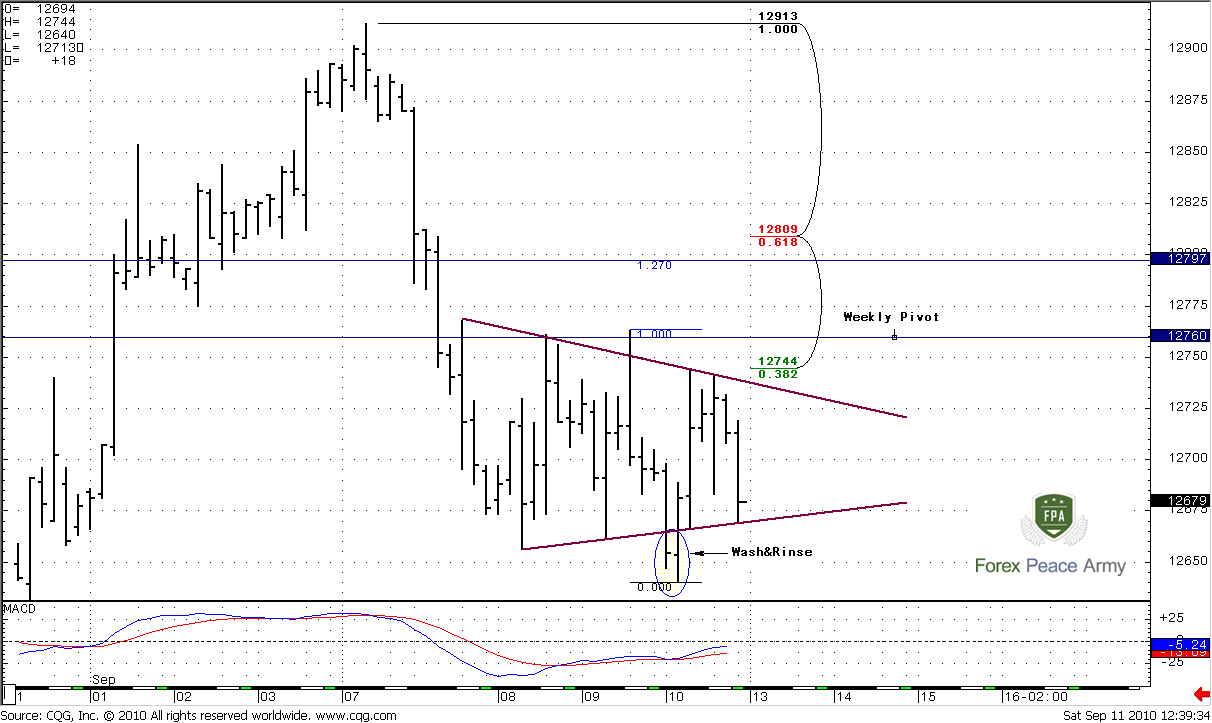
4-Hour
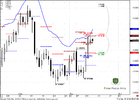
Here there are very few clear signs. Although trend is bullish market does not show any sign of thrust yet and just stays in triangle consolidation. There are two bearish signs as I see them. First – market has reached only 3/8 Fib resistance and didn’t rise more. Second – after Wash and Rinse pattern market couldn’t break triangle to the upside, and just stays in the range.
From the bullish point of you – wash and rinse is a positive sign still. Second if market will hold in triangle, we can receive a Butterfly sell pattern with the target around 1.28. (I didn’t draw wings to keep chart clear).
Personally, I think that we should to wait a bit. I would like to see some signs of thrust up, to get some confidence in possibility of up move. The moment that pivot point is just above the triangle can help us. If market will strongly pass through it, then, possibly upward move will become a reality.
The technical portion of Sive's analysis owes a great deal to Joe DiNapoli's methods, and uses a number of Joe's proprietary indicators. Please note that Sive's analysis is his own view of the market and is not endorsed by Joe DiNapoli or any related companies.
Trend is bearish. The blue line on the chart is DiNapoli Oscillator Predictor that shows level of oversold. Market has reached Fib support at 1.2022 in accordance with oversold (this calls “Stretch” pattern by the way), and shows pull back. I’ve marked 1.2550 area with horizon blue line – look, how often market has found support or resistance around this level.
The next monthly target is Agreement of 100% expansion of ABC pattern and 1.1394 Fib support.
Monthly#1
Also we can see perfect 1.27 Butterfly Buy pattern with the target around 1.05. Another interesting moment is that 1.27 expansion of ABC-pattern almost precisely coincides with this level. But we should talk about it in more details if we will get 1.15 target first.
Monthly#2
Weekly
Weekly trend is bullish, no oversold or overbought condition right now on the market. Weekly chart has a lot of interesting stuff that tremendously coincides with monthly levels. So, I offer start with our previous week’s affairs – momentum trades, and then pass to new information that weekly chart can give us.
1. Upward momentum trade.
I just want to remind you the context of this trade. Market has shown thrust up with 7 up bars, separation from 3x3 DMA (green line) was good. Although I like to see more than 7 bars, but this could work. Besides, on the weekly time frame, market very often showed momentum trades with 5 or 6 bars. Market has reached Fib support around 1.2605 and started to pull back. The target of this trade – 0.618 retracement of whole move down after thrust – 1.3048. You can clearly see all these levels on the chart. Usually momentum trade should start to work during 1-3 closes below 3x3 and on the previous week was seemed that it has started. But then something has become wrong – market has reached strong resistance with monthly pivot and 3/8 Fib resistance and pulled back. So, for now it’s very difficult to say – will it be finished at 1.3048 or not. But, personally, I will be look for another context if I’ll intend to enter Long.
Weekly#1
2. Downward momentum trade
Now, as you remember, we also have talked about larger momentum trade, that is to the downside. And context for this trade is a previous huge thrust down. The minimum target of this trade – 5/8 Fib support from the whole up move retracement from this swing down. Look at the picture.
This trade is working still, but also has it’s own defects. First of all, I do not like too deep move after crossing of 3x3 DMA (green line) to the upside. But if we take into consideration the reason for the previous sell-off (EU and Greece problems), then, may be everything will be ok with this trade. Besides, the monthly trend supports the direction of this weekly signal.
Weekly#2
And now I’d like to show you something really exciting…
Weekly#3
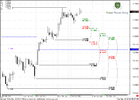
First of all look at this ABCD pattern. The 100% expansion target precisely at 0.786 Fib deep support that is very typical for butterflies patterns. 61.8% expansion target is also at Agreement by the way, with 0.618 Fib support (we’ve talked about this already in daily video).Also look at green dash lines near both of the targets – this is monthly pivot supports 1 and 2. Both levels are very strong supports areas.
And, the most important – the 1.272 target of this butterfly – precisely at monthly Agreement area around 1.14-1.15. But this forecast has some critical points. First, we need, that AB-CD move will not break previous lows. So, the lows around 1.19 should hold. And, second, market should not move higher, than A point around 1.3333. It will be much better if upward retracement will be stopped by 0.786 resistance (almost like I draw it). At the same time, there can happen some secondary changes that will not cancel the butterfly in general. For example, if C-point due to daily move will shift a bit higher, then, probably, market can reach 5/8 support rather then 0.786 during the move down due AB-CD, or something like that.
I think this will be interesting to watch, how this figure will develop…
Daily
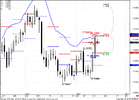
Daily chart is a bit overload with details, so let’s me explain all these stuff. First of all, I would like to return to our Friday’s conversation about MACDP failure signal. The red line on the chart is MACD Predictor. Now we have a confirmation of trend shifting failure, because market has tried to shift trend to bearish, move below MACDP in the beginning of the day, but close above it and didn’t not confirm bearish trend. (small ellipse on the chart). Simultaneously this was a failure breakout of the trend line. Odds suggest that this kind of price action very often leads to move to previous highs, i.e. to the upside. Also I have to note here, that the appearance of this kind of signal does not tell, that this move should start immediately. Market can form the same signal for some days without strong moves. Anyway, the main question is - how fart this move can be – till the highs just around 1.2760 area or till 1.2913?
For myself I mark two possible targets – 1.2850 – monthly pivot and 61.8% expansion from ABC-bottom pattern and possible triangle upper breakout failure with target of this breakout around 1.2960-1.3030. But, why breakout should fail? Well, because this is a very strong resistance in this area – 100% expansion target from ABC move , that creates an Agreement with Fib resistance level. Also there is a daily overbought area (although it will change after some time) and target of our possible 1.272 daily Butterfly sell pattern, that we’ve talked about on previous week. So, the judgment about realness of possible breakout is up to you, but I think that market’s failure in this area is more probable.
Also, take note of 1.2760 area. I do not have it on the chart, but this is a weekly pivot point for the next week. It coincides with the nearest previous high around 1.2763. If market will not be able to break above it, then, possibly market will intend to take only this high…
4-Hour
Here there are very few clear signs. Although trend is bullish market does not show any sign of thrust yet and just stays in triangle consolidation. There are two bearish signs as I see them. First – market has reached only 3/8 Fib resistance and didn’t rise more. Second – after Wash and Rinse pattern market couldn’t break triangle to the upside, and just stays in the range.
From the bullish point of you – wash and rinse is a positive sign still. Second if market will hold in triangle, we can receive a Butterfly sell pattern with the target around 1.28. (I didn’t draw wings to keep chart clear).
Personally, I think that we should to wait a bit. I would like to see some signs of thrust up, to get some confidence in possibility of up move. The moment that pivot point is just above the triangle can help us. If market will strongly pass through it, then, possibly upward move will become a reality.
The technical portion of Sive's analysis owes a great deal to Joe DiNapoli's methods, and uses a number of Joe's proprietary indicators. Please note that Sive's analysis is his own view of the market and is not endorsed by Joe DiNapoli or any related companies.
")