Forex Free Signals Daily From Centreforex

Eur/Jpy : 20/04/2015 Technical Analysis Report From CentreForex
Our Preference: Sell below 128.60 for the target of 127.00 levels.
Alternative Scenario: Nill
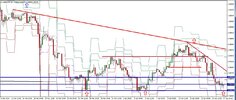
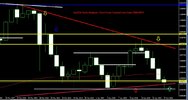
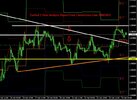
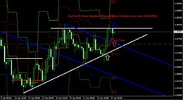
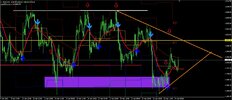
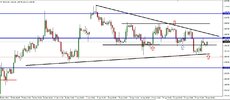
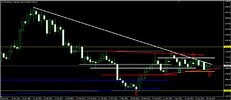
EurJpy 1 Hour Analysis Report From CentreForex.Com 20040215.jpgEurJpy 4 Hour Analysis Report From CentreForex.Com 20040215.jpgEurJpy Daily Analysis Chart From CentreForex.Com 20042015.jpg
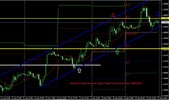
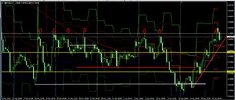
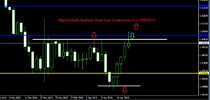
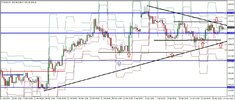
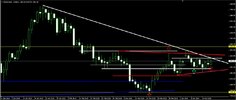
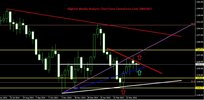
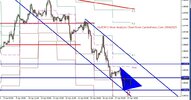
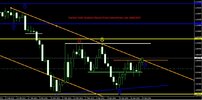
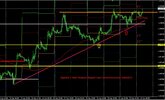
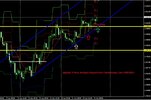
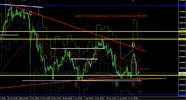
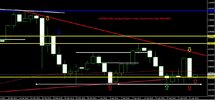
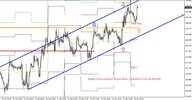
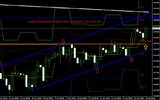
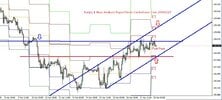
Technical Commentary :- In Daily chart :- EurJpy was trading in the range bound pattern between key support level 127 and key resistance level 130 levels and after 2nd testing the key support level 127 its came back higher and last week its closed on higher side :- We have shown in image.
In 4 hour chart and In 1 hour chart Eur/Jpy was trading in the equidistant channel lines and trading below key resistance levels 128.60 so we can except sideways movements, so we can buy on intraday support levels : - We have shown in image.
 
Eur/Usd : 20/04/2015 Technical Analysis Report From Centreforex
Our Preference: Sell below 1.0820 levels for the target of 1.0700.
Alternative Scenario: Nill
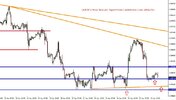
EurUsd 1 Hour Analysis Chart From CentreForex.Com 20042015.jpgEurUsd 4 Hour Analysis Chart From CentreForex.Com 20042015.jpgEurUsd Daily Analysis Chart From CentreForex.Com 20042015.jpgEurUsd Weekly Analysis Chart From CentreForex.Com 20042015.jpg
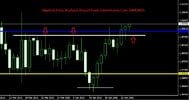
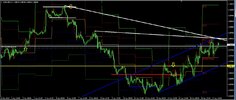
Technical Commentary: In Weekly chart :- Last week EurUsd was closed on higher side and EurUsd was trading in the sideways movements with range bound pattern between key resistance level 1.1000 and key support level 1.0500.
In Daily chart :- Eur/Usd was trading in the equidistant channel lines now its trading near upper channel line so we can sell below upper channel line keep stoploss above intraday resistance levels : - We have shown in attached image.
In 4 hour chart and In 1 hour chart :- Eur/Usd was trading in the equidistant channel lines and its trading below the key resistance level and its trading below upper trend line, so we can sell below upper channel line and key resistance level 1.0820:- We have shown in attached image.
 
Gbp/Usd : 20/04/2015 Technical Analysis Report From Centreforex
Our Preference: Sell Below 1.4980 for the target of 1.4850 & 1.4730 levels.
Alternative Scenario: Nill.
GbpUsd 1 Hour Analysis Chart From CentreForex.Com 20042015.jpgGbpUsd 4 Hour Analysis Chart From CentreForex.Com 20042015.jpgGbpUsd Daily Analysis Chart From CentreForex.Com 20042015.jpg
Technical Commentary: In Daily chart:- GbpUsd was trading in the range bound pattern between key resistance level 1.5000 and key support level 1.4700 and now it was trading below key resistance level and yesterday it was closed on lower side and its closed like as inverse hammer pattern so we can sell near key resistance level and we can wait upto next support levels :- which we have shown in attached image.
In 4 hours chart :- GbpUsd was trading in the range bound pattern between key resistance level 1.5000 and key support level 1.4700 and now it was trading with lower trend line and In 1 hour chart :- Gbp/Usd was trading in the equidistant channel lines and its trading in the range bound pattern between the major key resistance level and key support levels :- which we have shown in attached image.
 
Xau/Usd : 20/04/2015 Technical Analysis Report From Centreforex
Our Preference: Buy above 1200 levels for the target 1209,1213 and 1218 levels with stoploss below yesterday low.
Alternative Scenario: Nill
Gold 1 Hour Analysis Chart From CentreForex.Com 20042015.jpgGold 4 Hour Analysis Chart From CentreForex.Com 20042015.jpgGold Daily Analysis Chart From CentreForex.Com 20042015.jpgGold Daily Analysis Chart From CentreForex.Com 20042015.jpgGold Weekly Analysis Chart From CentreForex.Com 20042015.jpg
Technical Commentary :- In weekly chart, Gold was closed on higher side and closed like hammer pattern and closed above the key resistance level of 1200 ounces and its was trading in the triangle pattern, this week we can except to break off on higher side so we can buy above 1198 levels with tight stoploss.
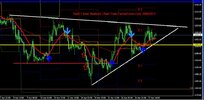
In Daily chart :- Gold was trading in the triangle pattern If upper trend line breaks means we can see further move towards on higher side.
In 4 hour chart and In 1 hour chart :- Gold was trading in the triangle pattern and its was trading in the range bound pattern between key resistance level and key support level, so we can buy above lower support line 1200 levels :- we have shown in above image.
 
Usd/Chf : 20/04/2015 Technical Analysis Report From Centreforex
Our Preference: Buy above 0.9500 levels for the target of 0.9600 and 0.9720 levels.
Alternative Scenario: Nill
UsdChf 1 Hour Analysis Chart From CentreForex.Com 20042015.jpgUsdChf 4 Hour Analysis Chart From CentreForex.Com 20042015.jpgUsdChf Daily Analysis Chart From CentreForex.Com 20042015.jpg
Technical Commentary : In Daily chart :- UsdChf was trading in the triangle pattern and now it was trading near lower trend line and yesterday Usd Chf was closed on higher side as like hammer pattern so we can buy above the key support levels 0.9500 levels with stoploss below 0.9460 levels :- we have shown in above image.
In 4 Hour chart : UsdChf was trading in the range bound pattern and UsdChf was bouncing back from 3rd lower testing of 0.9500 so its confirming for buying zone levels :- we have shown in above image.
In1 Hour chart : UsdChf was trading in the equidistant channel lines with range bound pattern and triangle pattern :- we have shown in above image.
 
Eur/Usd : 24/04/2015 Technical Analysis Report From Centreforex
Our Preference: Buy above 1.0780 levels for the target of 1.0890.
Alternative Scenario: Sell Below 1.0760 with stoploss of 1.0830.
EurUsd 1 Hour Analysis Report From CentreForex.Com 24042015.jpgEurUsd 4 Hour Analysis Report From CentreForex.Com 24042015.jpgEurUsd Daily Analysis Report From CentreForex.Com 24042015.jpg
Technical Commentary: In Daily chart :- Eur/Usd was trading in the equidistant channel lines now its trading near upper channel line and EurUsd broken last week high so we can buy near key support level 1.0800 with tight stoploss of 1.0740 : - We have shown in attached image.
In 4 hour chart :- Eur/Usd was broken the equidistant channel line on upper side and its trading with lower trend line,In 1 hour chart :- EurUsd was broken the upper trend line and key resistance level 1.0780 so we can buy near intraday key support level 1.0780 for the target of 1.0890:- We have shown in attached image.
 
Gbp/Usd : 24/04/2015 Technical Analysis Report From Centreforex
Our Preference: Buy above 1.5030 for the target of 1.5100 & 1.5200 levels.
Alternative Scenario: Nill.
GbpUsd 1 Hour Analysis Report From CentreForex.Com 24042015.jpgGbpUsd 4 Hour Analysis Report From CentreForex.Com 24042015.jpgGbpUsd Daily Analysis Report From CentreForex.Com 24042015.jpg
Technical Commentary: In Daily chart:- GbpUsd was broken the range bound pattern on higher side and its broken the key resistance level 1.5000 level and now its was trading with lower trend line :- which we have shown in attached image.
In 4 hours chart :- GbpUsd was trading in the equidistant channel lines and now its trading near lower trend line and trading near key support level of 1.5000 ,In 1 hour chart :- Gbp/Usd was moving with lower trend line and yesterday its broken major key resistance level 1.5000 so we can buy above 1.5000 levels :- which we have shown in attached image.
 
Xau/Usd : 24/04/2015 Technical Analysis Report From Centreforex
Our Preference: Buy above 1188 levels for the target 1200 and 1205 levels with stoploss below yesterday low.
Alternative Scenario: Nill
Gold 1 Hour Analysis Report From CentreForex.Com 24042015.jpgGold 4 Hours Analysis Report From CentreForex.Com 24042015.jpgGold Daily Analysis Report From CentreForex.Com 24042015.jpg
Technical Commentary :- In Daily chart :- Gold was trading in the triangle pattern and range bound pattern between key resistance level and key support level and now its was trading near lower trend line so we can buy above lower trend line level 1190 and If upper trend line breaks means we can see further move towards on higher side.
In 4 hour chart and In 1 hour chart :- Gold was trading in the triangle pattern and its was trading above the key support levels so we can buy above lower support line 1190 levels :- we have shown in above image.
 
Usd/Chf : 24/04/2015 Technical Analysis Report From Centreforex
Our Preference: Buy above 0.9500 levels for the target of 0.9600 and 0.9720 levels.
Alternative Scenario: Nill
UsdChf 1 HoursAnalysis Report From CentreForex.Com 24042015.jpgUsdChf 4 HoursAnalysis Report From CentreForex.Com 24042015.jpgUsdChf Daily Analysis Report From CentreForex.Com 24042015.jpg
Technical Commentary : In Daily Chart :- UsdChf was trading in the triangle pattern and now it was trading near lower trend line and yesterday Usd Chf was closed as Engulfing pattern and UsdChf was bouncing back from 3rd lower testing of 0.9500, so we can buy above the key support levels 0.9500 level with stoploss below 0.9440 level :- we have shown in above image.
In 4 hour chart and In 1 hour chart UsdChf was trading in the triangle pattern and trading above key support level 0.9500 and UsdChf was trading in the range bound pattern so its confirming for buying zone levels so we can buy near lower trend line with tight stoploss :- we have shown in above image.
 
Eur/Jpy : 24/04/2015 Technical Analysis Report From CentreForex
Our Preference: Buy Above 129 for the target of 130 Levels
Alternative Scenario: Nill
EurJpy 1 Hour Analysis Report From CentreForex.Com 24042015.jpgEurJpy 4 Hour Analysis Report From CentreForex.Com 24042015.jpgEurJpy Daily Analysis Report From CentreForex.Com 24042015.jpg
Technical Commentary :- In Daily chart :- EurJpy was broken the triangle pattern on upper trend line of higher side and it was trading in the range bound pattern between key support level 127 and key resistance level 130 levels , so we can buy near key support level and its tested back higher from 3rd testing the key support level and last week closeing also on higher side :- We have shown in image.
In 4 hour chart and In 1 hour chart Eur/Jpy was trading in the equidistant channel lines and trading below key resistance levels 128.60 so we can except sideways movements, so we can buy on intraday support levels : - We have shown in image.
 
Back
Top