Forex Free Signals Daily From Centreforex

Xau/Usd : 02/09/2015 Technical Analysis Report From Centreforex

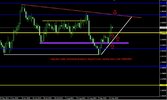
Our Preference: Sell Below 1145 levels for the target 1130 & 1120 levels.

Alternative Scenario: Nill

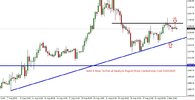
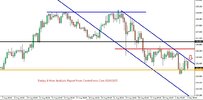
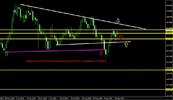
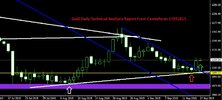
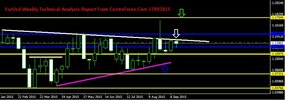
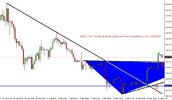
Technical Commentary :- In Daily chart :- Gold was trading in the triangle pattern and trading below the key support level 1160, we can sell near intraday resistance levels,

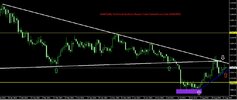
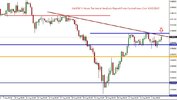
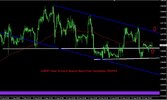
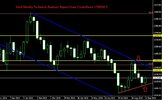
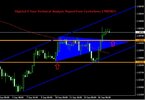
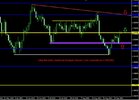
In 4 hour chart :- Gold was moving with lower trend line and now it was trading near resistance 1143 levels so we can sell near intraday resistance :- which we have shown in attached image.

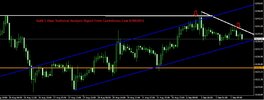
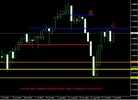
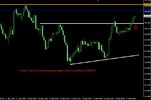
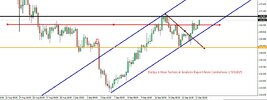
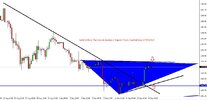
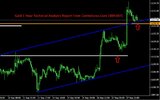
In 1 hour chart :- Gold was trading with equidistant channel lines and its was trading with upper trend line so we can sell near upper trend line upto next key support levels.
 

Attachments

  • Gold 1 Hour Technical Analysis Report From CentreForex.Com 02092015.jpg
    Gold 1 Hour Technical Analysis Report From CentreForex.Com 02092015.jpg
    90.9 KB · Views: 1
  • Gold 4 Hour Technical Analysis Report From CentreForex.Com 02092015.jpg
    Gold 4 Hour Technical Analysis Report From CentreForex.Com 02092015.jpg
    84.6 KB · Views: 1
  • Gold Daily Technical Analysis Report From CentreForex.Com 02092015.jpg
    Gold Daily Technical Analysis Report From CentreForex.Com 02092015.jpg
    115.1 KB · Views: 0
Usd/Chf : 02/09/2015 Technical Analysis Report From Centreforex

Our Preference: Sell below 0.9700 levels for the target of 0.9580 levels.

Alternative Scenario: Nill

Technical Commentary : In Daily Chart :- Usd/Chf was trading below the key resistance 0.9680 levels,

Now 0.9680 level is the key resistance level and its was the 4 days high :- we have shown in above image.

In 4 hour chart :- Usd/chf was trading below the upper trend line and trading below the major key resistance level.

In 1 hour chart :- Usd/Chf was trading in the range bound pattern between key resistance and key support level :- we have shown in above image.
 

Attachments

  • UsdChf 1 Hours Technical Analysis Report From CentreForex.Com 02092015.jpg
    UsdChf 1 Hours Technical Analysis Report From CentreForex.Com 02092015.jpg
    87 KB · Views: 1
  • UsdChf 4 Hours Technical Analysis Report From CentreForex.Com 02092015.jpg
    UsdChf 4 Hours Technical Analysis Report From CentreForex.Com 02092015.jpg
    90.4 KB · Views: 1
  • UsdChf Daily Technical Analysis Report From CentreForex.Com 02092015.jpg
    UsdChf Daily Technical Analysis Report From CentreForex.Com 02092015.jpg
    75.1 KB · Views: 0
Eur/Jpy : 02/09/2015 Technical Analysis Report From CentreForex

Our Preference: Sell below 135.50 for the target of 134.50 Levels

Alternative Scenario: Nill

Technical Commentary :- In Daily chart :- Yesterday EurJpy was closed on lower with broken of key support 135.50 level, so we can except upto next support level :- We have shown in image.

In 4 hour chart:-Eur/Jpy was trading in the equidistance channel lines and trading near upper tend line :- We have shown in above image.

In 1 hour chart :- EurJpy was trading in the triangle pattern and trading below intraday lower trend line, so we can except on selling side upto next support level.
 

Attachments

  • EurJpy 1 Hour Technical Analysis Report From CentreForex.Com 02092015.jpg
    EurJpy 1 Hour Technical Analysis Report From CentreForex.Com 02092015.jpg
    56.8 KB · Views: 2
  • EurJpy 4 Hour Analysis Report From CentreForex.Com 02092015.jpg
    EurJpy 4 Hour Analysis Report From CentreForex.Com 02092015.jpg
    89.9 KB · Views: 1
Eur/Jpy : 17/09/2015 Technical Analysis Report From CentreForex

Our Preference: Buy above 136.00 for the target of 136.80 Levels

Alternative Scenario: Nill

Technical Commentary :- In Daily chart :- EurJpy was trading in the range bound pattern between key resistance level and key support levels :- We have shown in image.

In 4 hour chart :- Eur/Jpy was trading in the equidistant channel lines and trading above the key resistance levels so we can buy near key support levels :- We have shown in above image.

In 1 hour chart :- EurJpy was moving with strong lower trend line and trading above the key resistance levels, so we can except on buying side upto next resistance level.
 

Attachments

  • EurJpy 1 Hour Technical Analysis Report From Centreforex 17092015.jpg
    EurJpy 1 Hour Technical Analysis Report From Centreforex 17092015.jpg
    75.2 KB · Views: 1
  • EurJpy 4 Hour Technical Analysis Report From Centreforex 17092015.jpg
    EurJpy 4 Hour Technical Analysis Report From Centreforex 17092015.jpg
    98.7 KB · Views: 1
  • EurJpy Daily Hour Technical Analysis Report From Centreforex 17092015.jpg
    EurJpy Daily Hour Technical Analysis Report From Centreforex 17092015.jpg
    95.6 KB · Views: 1
Usd/Chf : 17/09/2015 Technical Analysis Report From Centreforex

Our Preference: Sell below 0.9720 levels for the target of 0.9650 levels.

Alternative Scenario: Nill

Technical Commentary : In Daily Chart :- Yesterday Usd/Chf was closed on higher side and its closed above key resistance level 0.9700 and it was trading in sideways movement with key resistance level and key support level :- we have shown in above image.

In 4 hour chart :- Usd/chf was trading above the key support level and with side ways movement so we can except consolidation range pattern.

In 1 hour chart:- Usd/Chf was trading in the equidistant channel and trading near key support levels of lower trend line :- we have shown in above image.
 

Attachments

  • UsdChf 1 Hour Technical Analysis Report From Centreforex 17092015.jpg
    UsdChf 1 Hour Technical Analysis Report From Centreforex 17092015.jpg
    101.4 KB · Views: 0
  • UsdChf 4 Hour Technical Analysis Report From Centreforex 17092015.jpg
    UsdChf 4 Hour Technical Analysis Report From Centreforex 17092015.jpg
    90.9 KB · Views: 0
  • UsdChf Daily Technical Analysis Report From Centreforex 17092015.jpg
    UsdChf Daily Technical Analysis Report From Centreforex 17092015.jpg
    114.7 KB · Views: 2
Xau/Usd : 17/09/2015 Technical Analysis Report From Centreforex

Our Preference: Buy Above 1115 levels for the target 1127 & 1132 levels.

Alternative Scenario: Nill

Technical Commentary :- In Daily chart :- Gold was broken the triangle pattern on upper side and its moving towards upper side, after testing the lower trend line and its was bounced back and its was closed on higher side so its confirming for the buying zone :- which we have shown in attached image.

In 4 hour chart :- Gold was broken the upper trend line and now its moving with new triangle pattern so we can buy near intraday support levels :- which we have shown in attached image.

In 1 hour chart :- Gold was trading in the new equidistant channel lines with strong support levels, so we can buy near intraday support levels upto next key support levels.
 

Attachments

  • Gold 1 Hour Technical Analysis Report From Centreforex 17092015.jpg
    Gold 1 Hour Technical Analysis Report From Centreforex 17092015.jpg
    70.2 KB · Views: 1
  • Gold 4 Hour Technical Analysis Report From Centreforex 17092015.jpg
    Gold 4 Hour Technical Analysis Report From Centreforex 17092015.jpg
    87.8 KB · Views: 1
  • Gold Daily Technical Analysis Report From Centreforex 17092015.jpg
    Gold Daily Technical Analysis Report From Centreforex 17092015.jpg
    67.4 KB · Views: 0
  • Gold Weekly Technical Analysis Report From Centreforex 17092015.jpg
    Gold Weekly Technical Analysis Report From Centreforex 17092015.jpg
    75.3 KB · Views: 0
Gbp/Usd : 17/09/2015 Technical Analysis Report From Centreforex

Our Preference: Buy Above 1.5450 for the target 1.5650 levels.

Alternative Scenario: Nill

Technical Commentary: In Daily Chart :- YesterdayGbp/Usd was tested key support level and bounced back from key support level and closed on higher level and trading near the key resistance levels :- which we have shown in attached image.

In 4 hours chart :- GbpUsd was trading in the equidistant channel lines and its broken the triangle pattern on upper side,so its confirming for the buying zone :- which we have shown in attached image.

In 1 Hour Chart :- GbpUsdwas tested key support level and lower trend line now its was trading above the key resistance level so we can buy above the key resistance level 1.5500:- which we have shown in attached image.
 

Attachments

  • GbpUsd 1 Hour Technical Analysis Report From Centreforex 17092015.jpg
    GbpUsd 1 Hour Technical Analysis Report From Centreforex 17092015.jpg
    98 KB · Views: 1
  • GbpUsd 4 Hour Technical Analysis Report From Centreforex 17092015.jpg
    GbpUsd 4 Hour Technical Analysis Report From Centreforex 17092015.jpg
    57.9 KB · Views: 0
  • GbpUsd Daily Technical Analysis Report From Centreforex 17092015.jpg
    GbpUsd Daily Technical Analysis Report From Centreforex 17092015.jpg
    84.7 KB · Views: 1
Eur/Usd : 17/09/2015 Technical Analysis Report From Centreforex

Our Preference: Buy Above 1.1280 levels for the target of 1.1360 levels.

Alternative Scenario: Nill

Technical Commentary: In Daily chart :- Eur Usd was trading in the triangle pattern and YesterdayEur/Usd was bounced back from the key support level and closed as hammer pattern so we can except next key resistance levels :- which we have shown in attached image.

In 4 hour chart :- EurUsd was trading in the sideways movement and its trading with lower trend lines, so we can buy off from key support level upto next resistance levels:- which we have shown in attached image.

1 hour chart :- Eur/Usd was trading with upper trend line and lower trend line and moving with sideways movement so we can except buy off from key support levels :- which we have shown in attached image.
 

Attachments

  • EurUsd 1 Hour Technical Analysis Report From CentreForex.Com 17092015.jpg
    EurUsd 1 Hour Technical Analysis Report From CentreForex.Com 17092015.jpg
    94.7 KB · Views: 0
  • EurUsd 4 Hour Technical Analysis Report From CentreForex.Com 17092015.jpg
    EurUsd 4 Hour Technical Analysis Report From CentreForex.Com 17092015.jpg
    87.7 KB · Views: 1
  • EurUsd Daily Technical Analysis Report From CentreForex.Com 17092015.jpg
    EurUsd Daily Technical Analysis Report From CentreForex.Com 17092015.jpg
    114.2 KB · Views: 1
  • EurUsd Weekly Technical Analysis Report From CentreForex.Com 17092015.jpg
    EurUsd Weekly Technical Analysis Report From CentreForex.Com 17092015.jpg
    64.8 KB · Views: 1
Xau/Usd : 18/09/2015 Technical Analysis Report From Centreforex

Our Preference: Buy Above 1124 levels for the target 1132 & 1138 levels.

Alternative Scenario: Nill

Technical Commentary :- In Daily chart :- Gold was trading in the long term triangle pattern, yesterday gold was broken the key resistance level 1120 and it was moving with strong lower trend line so its confirming for the buying zone :- which we have shown in attached image.

In 4 hour chart :- Gold was broken the triangle pattern on upper side of upper trend line so this upper trend line acting as now key support level so we can buy near intraday key support levels :- which we have shown in attached image.

In 1 hour chart :- Gold was broken the equidistant channel lines on upper side and key resistance level so we can buy near intraday support levels upto next key support levels
 

Attachments

  • Gold 1 Hour Technical Analysis Report From CentreForex.Com 18092015.jpg
    Gold 1 Hour Technical Analysis Report From CentreForex.Com 18092015.jpg
    59.9 KB · Views: 1
  • Gold 4 Hour Technical Analysis Report From CentreForex.Com 18092015.jpg
    Gold 4 Hour Technical Analysis Report From CentreForex.Com 18092015.jpg
    91 KB · Views: 1
  • Gold Daily Technical Analysis Report From CentreForex.Com 18092015.jpg
    Gold Daily Technical Analysis Report From CentreForex.Com 18092015.jpg
    95.3 KB · Views: 1
Gbp/Usd : 18/09/2015 Technical Analysis Report From Centreforex

Our Preference: Buy Above 1.5550 for the target 1.5650 levels.

Alternative Scenario: Nill

Technical Commentary: In Daily Chart :- Yesterday Gbp/Usd was broken the key resistance 1.5500 levels now this key resistance level is acting as key support level and its moving with lower trend line so its confirming for the buying trend so we can buy near key support levels :- which we have shown in attached image.

In 4 hours chart :- GbpUsd was trading in the equidistant channel lines and its moving with new lower trend line.

In 1 Hour Chart :- GbpUsd was broken the key resistance level and now its moving with new intraday lower trend line so we can buy near lower trend line and we can except upto next resistance levels :- which we have shown in attached image.
 

Attachments

  • GbpUsd 1 Hour Technical Analysis Report From CentreForex.Com 18092015.jpg
    GbpUsd 1 Hour Technical Analysis Report From CentreForex.Com 18092015.jpg
    90.2 KB · Views: 0
  • GbpUsd 4 Hour Technical Analysis Report From CentreForex.Com 18092015.jpg
    GbpUsd 4 Hour Technical Analysis Report From CentreForex.Com 18092015.jpg
    61.1 KB · Views: 1
  • GbpUsd Daily Technical Analysis Report From CentreForex.Com 18092015.jpg
    GbpUsd Daily Technical Analysis Report From CentreForex.Com 18092015.jpg
    94.5 KB · Views: 1
Back
Top