FOREX PRO WEEKLY February 02-06, 2014

Sive Morten

Special Consultant to the FPA
Messages
18,760
Guys, we have technical problems with uploading charts on server, so, I will put them here as attachments. Sorry for any inconvenience.

Fundamentals
dollar traded mixed on Friday after weaker-than-expected headline U.S. fourth-quarter gross domestic product data, which included the fastest pace of consumer spending since 2006 and left intact market expectations of long-term greenback gains.

U.S. economic activity in the fourth quarter rose 2.6 percent, below economists' consensus forecast of 3 percent and nearly half of the third quarter's 5 percent rate.
While the U.S. Federal Reserve is still expected to begin raising interest rates later this year, the contrast with loosening monetary policies elsewhere in the world is becoming even more stark.

"That monetary divergence continues to dominate foreign exchange markets. The fundamental case for dollar strength is still in place as a long-term theme," said Brian Daingerfield, currency strategist at the Royal Bank of Scotland in Stamford, Connecticut.

The U.S. dollar index advanced for a seventh straight month in January, marking the longest streak of monthly gains since the greenback was floated as a fiat currency in 1971. On the day however, the index was off 0.10 percent.

Market positioning against the euro has built up over the last six months in expectation that the European Central Bank would embark on aggressive monetary easing policies. That scenario played out last week when the ECB announced a 1 trillion-euro quantitative easing plan.

While that ultimately justifies selling pressure on the euro, the unwinding of short-euro positions is creating some buying of the currency, at least in the short term.

"The long-term position for the euro is decisively lower, but we seem to be consolidating short-euro positions here before the downtrend resumes," Daingerfield said.

In contrast to the U.S. economy's growth, albeit slightly lower in the first look at fourth-quarter activity, Canada's economy shrank unexpectedly in November by 0.2 percent, prompting market talk that the Bank of Canada will cut interest rates in March for the second time in six weeks.

"The data in hand do support the Bank of Canada's very bearish interpretation of the impact of lower oil (prices) on the Canadian economy," said Bill Adams, an economist at PNC Financial Services Group.

Currently guys, GBP shows some interesting action and this weekly research we dedicate to Cable.
CFTC data shows that open interest that has dropped significantly on Scotland voting – now was restored at almost previous levels. Open interest mostly has grown on short positions. Picture of speculative positions looks obvious – solid increasing of shorts while longs stand anemic. At the same time, if you will take a look at commercial positions (hedgers) you will see interesting detail. While there is no surprise in solid part on commercial longs – they just a mirror of speculative shorts, even by chart shape, we see increasing of commercial shorts, but non-commercial longs (speculative bulls) stand flat or even decrease. It could be a sign that bearish sentiment becomes softer. May be it will not lead to reversal, but retracement is possible. It seems that market is tired a bit from endless drop.

Open interest:
View attachment cftc_gbp_oi_20_01_15.bmp
Shorts:
View attachment cftc_gbp_shorts_20_01_15.bmp
Longs:
View attachment cftc_gbp_longs_20_01_15.bmp

Technicals
Monthly
Right in the beginning of our weekly research I would like to show you monthly chart and analysis that we’ve made in December 2013 in our Forex Military School Course, where we were learning Elliot Waves technique.

https://www.forexpeacearmy.com/forex-forum/forex-military-school-complete-forex-education-pro-banker/30110-chapter-16-part-v-trading-elliot-waves-page-7-a.html

Our long term analysis suggests first appearing of new high on 4th wave at ~1.76 level and then starting of last 5th wave down. First condition was accomplished and we’ve got new high, but it was a bit lower – not 1.76 but 1.72. This was and is all time support-resistance area. Now we stand in final part of our journey. According to our 2013 analysis market should reach lows at 1.35 area. Let’s see what additional information we have right now.
Trend is bearish here, but GBP is not at oversold. Right now market has reached strong support area – Yearly Pivot support 1 and 5/8 major monthly Fib level. This is an area where market has stopped last time. Monthly chart give us just single AB-CD pattern with nearest target at 0.618 extension – 1.3088. Still, here we have another one non-Fib orienteer – lower border of current consolidation. If we will treat it as sideways action then lower border will stand ~1.42-1.43 area. But first we need to get over current support level and see what market could give us here.
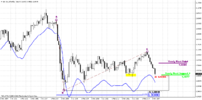
gbp_m_02_02_15.png

Weekly
Here guys we see nothing special – no patterns, divergences etc. Here it is even useless to plot January monthly pivots since cable has passed through all of them. So, I’ve drawn new - February pivots here…
Still weekly chart tells us that market is oversold at monthly strong support and this could be treated as weekly bullish DiNapoli “Stretch” pattern. Second is – we have perfect thrust down that could become a source of multiple patterns and setups in the future, if upward retracement will happen.
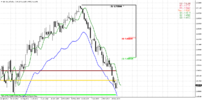
gbp_w_02_02_15.png
 
...Continuation

Daily
Daily trend stands bullish, but upside action mostly is held by overbought. Here we do not have clear patterns yet, but we have bullish divergence. On coming week market will open around WPP. Also take a look – February PP coincides with WPR1 and overbought. This probably will be nearest destination point on coming week.
gbp_d_02_02_15.png

4-Hour
As we’ve discussed previously our primary object by far stands on 4-hour chart. We’ve made suggestion that it might be 1.27 reverse H&S pattern and market still keeps the chances to create it. Right shoulder has slightly deeper bottom compares to expected 1.5050 level, but this does not cancel this pattern yet. The reason for this a bit lower bottom is pattern that we have on hourly chart. If this H&S will finally be formed – the minimum target will stand around 1.5260 area that in fact stands just slightly higher than our daily resistance level.
gbp_4h_02_02_15.png

Hourly
Here guys, the reason, why market has moved slightly lower than 1.5050 area. Initially it has stopped right at this level, but after that has turned to creating of butterfly “buy” pattern. So, by creating of this pattern market has finished preparation to reversal. Now GBP either will start upside action or fail and we will understand it based on this small butterfly. It is interesting that this butterfly also could shift to H&S pattern and we will get some kind of nested H&S.
If this butterfly will fail – we will get bearish domino effect, chain reaction of failings. After this butterfly market will move below 4-hour right shoulder and it will lead to failure of 4-hour H&S. This in turn, will erase chance on upside retracement, etc…
So, solution here is simple – watch for 1.5025 level for long entry. If market will fail here – then upward action will not happen, probably.
gbp_1h_02_02_15.png


Conclusion:

Bears control market right now and in long-term perspective downward action probably will continue. But existing of solid support on weekly chart, shy deviation in hedgers’ position and patterns on intraday chart tell that upside retracement for 200-300 pips looks not impossible.


The technical portion of Sive's analysis owes a great deal to Joe DiNapoli's methods, and uses a number of Joe's proprietary indicators. Please note that Sive's analysis is his own view of the market and is not endorsed by Joe DiNapoli or any related companies.
 
FX Daily Update, Tue 03, February 2015

Good morning,


Reuters reports Australian dollar skidded more than one U.S. cent to a six-year low on Tuesday and plunged more than two percent against the yen after the Reserve Bank of Australia slashed interest rates to a record low.

Australia's central bank cut its cash rate a quarter point to 2.25 percent at its policy meeting, to spur a sluggish economy and keep downward pressure on its currency. A Reuters poll of 29 analysts had found 20 expected no change this week.

"The surprise rate cut relative to consensus has seen the Aussie tumble across the board," said Sue Trinh, senior currency strategist at RBC Capital Markets in Hong Kong.

Moreover, she said, Australian rate futures also rallied, showing the market is "now fully priced for a back-to-back rate cut, for another one in March," which is also keeping downward pressure on the Aussie as investors position for the possibility of even lower rates ahead.

The Canadian dollar continued to get a lift against its U.S. counterpart as recently slumping crude oil prices staged a rebound.

Investors took profits on bearish positions as oil prices continued to rise strongly, fuelling talk that a seven-month rout has ended.

The dollar remained in familiar ranges against the yen and the euro. It has spent much of the past two weeks oscillating between 117.00 and 119.00 yen and shows little sign of re-testing December's eight-year peak of 121.86.

The euro edged down about 0.1 percent to $1.1328 , after finding a floor at an 11-year trough of $1.1098. It has held to a $1.1262-$1.1384 range over the past few sessions.


So, as we can see news stream has not brought any drastical news, except, may be Australian rate cut. Today we again will take a look at GBP, because all other majors do not show any interesting - EUR stands anemic, CAD and JPY although are look promising - have not formed yet any patterns.

So, recent action on GBP makes us think that chances on success of H&S pattern have decreased, especially due recent reaction of GBP around our 1.5025 area. Shortly speaking market shows action that absolutely does not correspond to normal behavior of right shoulder.
On daily chart recent action mostly reminds bearish dynamic pressure that suggests another leg down. Still, it will not cancel totally the perspective of retracement yet.
gbp_d_03_02_15.png


On 4-hour chart we see multiple bearish grabbers and inability of GBP to pass through WPP and that was among our primary conditions of bullish sentiment. Still, if you will calculate extensions - you'll see that we could get 3-Drive Buy pattern instead of H&S here and reversal point will move to 1.4875. Although bearish pressure is growing here - H&S has not failed yet and still has chances to start upward action. These chances now look not as strong as they were on weekend...
gbp_4h_03_02_15.png


Another moment why we start to doubt immediate upward perspectives is reaction of the market on our entry point around 1.5025 area. Recall that we've discussed here another H&S pattern and when market initially has reached this level - reaction was nice, upward action has started. But later market has stopped, dropped right back down and this H&S has failed. This inability of GBP finally to start move up - makes us doubt that this move should start right here. That's why next level that we will be watch is 1.4875 - 3-Drive potential reversal point.
Still, right now H&S has not failed totally and some shy chances exist that GBP still could rebound.
gbp_1h_03_02_15.png
 
Last edited:
Good morning,


Recent Reuters news:
dollar nursed broad losses on Wednesday, having suffered its biggest one-day fall in over a year as it came under pressure from many fronts amid oil-fuelled gains by commodity currencies.

Buyers snapped up commodity currencies as the oil market extended its recovery and copper prices also surged.

Elsewhere in the market, the euro recovered on hopes that Greece may yet secure a new debt deal.

In a development that supported the battered euro, Greek Prime Minister Alexis Tsipras sought to reassure international partners that Athens did not want to create divisions in Europe with its call for a new debt accord and said he was open to listening to alternative proposals.

Yet, there was still plenty of uncertainty whether Tsipras will be successful, suggesting the rally in the euro was more about positioning rather than any change in fundamentals, traders said.

Commodity currencies remained in the spotlight with crude oil up about 19 percent over the past four sessions, while copper saw its biggest one-day gain since July 2013. Oil's recovery helped spur a global rally in risk assets.

"It feels a little strange seeing crude oil and equities move in tandem, as higher oil under normal circumstances would slow economic growth. But we just have to go with the flow, and brace for 'risk on' when oil goes up," said Bart Wakabayashi, head of forex at State Street in Tokyo.

"Currencies appear to be at the whim of the oil market. For now oil has become an indicator of risk appetite," he said.

The Australian dollar hovered around 78 U.S. cents , staging an impressive turnaround from a slump to a six year trough of $0.7627.

The short-covering rally followed the Aussie's slump on Tuesday, when the Reserve Bank of Australia (RBA) cut interest rates to a record low 2.25 percent.

The Canadian dollar jumped for a second session to two-week highs of C$1.2353 per U.S. dollar . It last traded at C$1.2428.

Sterling climbed to $1.5198 , pulling further away from a near 19-month low of $1.4952 set last month. The British currency had posted its best session in nearly 10 months on Tuesday.

Against the yen, the dollar fared better as U.S. Treasury yields jumped and a rally by Tokyo shares lessened the allure of the safe-haven Japanese currency. The greenback was rose 0.3 percent to 117.95 , having recovered from a low of 116.87.

Traders said the dollar's recent rally to multi-year highs against the yen and euro could falter as doubts emerge over whether the Federal Reserve will raise interest rates this year.

"When most central banks across developed and emerging economies are in easing mode, the assumption that the Federal Reserve will raise rates this year is starting to look questionable," said David Absolon, Investment Director at Heartwood Investment Management.

"For Fed policymakers, the external environment and the actions of other central banks are becoming increasingly hard to ignore," he wrote in a note to clients.


Today we will take a look at EUR, since recent surprising statement from A. Tsipras that Greece will ready to talk on Gov. Debt restructuring has brought some relief on markets. This has let EUR and GBP to show solid upward action. BTW, guys, our GBP setup has survived due this statement and GBP indeed has formed our h&S pattern on 4-hour chart. Thus, miracle happens sometimes...
On EUR - market has shown first leg of retracement that we've discussed in recent daily update and has reached area of WPR1 and overbought. Our major attention here stands around possible DRPO "Buy" pattern. In nearest couple of sessions hardly market will continue move up due resistance and more probable is to see some retracement down:
eur_d_04_02_15.png


On hourly chart we see that market has completed our targets - Butterfly "sell" and almost 1.618 AB=CD. Thus, as AB-CD has not been completed totally, we can't exclude possible small leg up to previous top. If you would like to take scalp short trade - better to place stop somewhere above 1.618 target. EUR here could show deep retracement by 2 reasons - it is overbought on daily and previous bearish momentum is still strong.
First solid support is K-support, but there are nice chances that market could return back to WPP and 5/8 Fib support:
eur_1h_04_02_15.png
 
Last edited:
FX Daily Update, Thu 05, February 2015

Good morning,


Reuters reports euro steadied slightly on Thursday, after sliding the previous day when the European Central Bank said it will no longer accept Greek bonds as collateral for its liquidity operations.

The ECB's announcement dealt a blow to Athens, which is seeking debt relief from euro zone lenders, knocking the euro to $1.1304 earlier on Thursday.

The ECB surprised markets late on Wednesday by announcing it would reimpose minimum credit rating requirements for Greek bonds, effectively shifting the burden on to the Greek central bank to finance its lenders.

The decision came after Greece's new finance minister Yanis Varoufakis emerged from a meeting with ECB President Mario Draghi to claim that the ECB would do "whatever it takes" to support member states such as Greece.

"This is a precautionary move by the ECB, but it is important," said CitiFX strategist Richard Cochinos.

Cochinos said the shift in the ECB's program will be seen by markets as indicating that the meeting between Varoufakis and Draghi did not go well.

Some market participants said they viewed worries about Greece as a short-term trading factor rather than a trigger for protracted euro weakness, citing hopes for an eventual compromise between Greece and international lenders.

"I think the market consensus is that Greece will back down in the end," said Masashi Murata, currency strategist for Brown Brothers Harriman in Tokyo.


So, our yesterday target on EUR has been achieved - market as dropped on ECB statement concerning Greece bonds. GBP target is also almost completed.
Thus, today we offer you to take a look at short-term setup on AUD. As Gold rebound up again, Aussie could show short-term upward action. Background has been formed already for this action. We're talking on pretty nice H&S pattern on hourly chart:
aud_1h_05_02_15.png

We do not put big hopes on this pattern, I mean this upward retracement has mostly technical character, since market a bit overextended to the downside.
H&S has nice shape, and it's minimum target stands around WPR1 @ 0.7950. Right now is suitable moment for taking long position, since the bottom of right shoulder already has appeared and current moment provides least risk, compares to other points. Thus, if market will drop below 0.77-0.7720 - then H&S probably will fail, or at least market will drop to head's low. So, let's see how it will turn...
 
Last edited:
FX Daily Update, Fri 06, February 2015

Good morning,


Reuters reports The euro eased versus the dollar on Friday, with the near-term focus on whether U.S. jobs data later in the day will bolster the case for the Federal Reserve to consider raising interest rates around mid-year.

The euro's rise on Thursday was helped by reports that the European Central Bank had agreed to allow Greece's national central bank to grant its banks emergency funding of up to 60 billion euros.

Views that the Swiss National Bank had bought euros to weaken the Swiss franc had also supported the common currency on Thursday.

The euro has seen some sharp swings in recent sessions, having tumbled earlier in the week after the European Central Bank stunned investors by taking a hard-line stance, saying it would not accept Greek bonds as collateral.

Greece's aid deadline with the European Union, the ECB and International Monetary Fund "troika" expires on Feb. 28.

The Greek situation will remain a key factor at least until the Feb. 28 aid deadline. The development is likely to peak next week, giving time for at least one more round of upsets for the market," said Junichi Ishikawa, market analyst at IG Securities in Tokyo.

"For now we can turn away from Greece and focus on U.S. jobs data, which may provide an opportunity to slow the unwinding of dollar-long positions that has been taking place," Ishikawa said.

Another solid U.S. payroll reading, coupled with a possible rebound in wage growth, may revive recently-flagging views that the Federal Reserve might consider raising interest rates as early as mid-year and favour the dollar.

Non-farm payrolls probably increased 234,000 last month after advancing 252,000 in December, according to a Reuters survey of economists. It would be the 12th straight month of job gains above 200,000, the longest streak since 1994.

Callum Henderson, global head of FX research for Standard Chartered Bank in Singapore, said Standard Chartered's baseline expectation is that non-farm payrolls will increase by around 260,000.

The market could show a sharp reaction if the increase in non-farm payrolls turns out to be either less than 200,000, or more than 300,000, Henderson said, adding that such results could lead to "quite a bit of volatility".

The Australian dollar rose 0.4 percent to $0.7827 , gaining a lift after the Reserve Bank of Australia's quarterly statement did not sound as dovish as some had expected.


So, currently markets are waiting for NFP release. Our AUD setup shows normal progress and does not need no comments, GBP setup has hit 1.5350 target and completed. Now we need to wait whether this action will trigger something bigger on weekly chart.
Thus, let's take a look at EUR. Our comments today do not show any trading setup, but mostly interesting from educative point of view. EUR shows solid volatility on uncertainty around Greek debt and short-term liquidity aid from ECB.
Take a look that today overbought stands at 1.1545-1.1550 level on daily chart:
eur_d_06_02_15.png


Recall that on 4-hour chart we have uncompleted 1.618 AB-CD pattern. This target stands precisely at daily overbought, slightly above previous top and at the border of previous consolidation that will be resistance:
eur_4h_06_02_15.png


It means that if market will show leg up - it will probably stop around 1.1550 area. The only exception could be - if NFP will be very bad, say, below 200K. In this case it could show longer upside action.
So, if you thing about taking longs, or you already have them - take this moment in consideration. Think about taking profit around 1.1550. Current shape of the market suggets that appearing of W&R of previous top on hourly chart looks very probable:
Right now market could show some retracement down before upside continuation:
eur_1h_06_02_15.png
 
Last edited:
Pls Sive how do we calculate the overbought condition using the detrended oscillator? like that of the monthly and weekly chat on the GBPUSD, pls sive show us how to achieve those values using the extreme lows......thanks
 
Cable 4h. chart got several stop grabbers. Now after SG done the path for 1.5270 initially is clear IMO.:
03-02-2015 10-22-45.jpg
 
Interesting setup in Euro! 1h. chart below-161.8% btfly sell in agreement with triangle target(could be flag though). Let us see how price will behave when(if) hits minimal 38.2 butterfly target@ 1.1430(also former top) . Ultimate 161.8 target would give us new low and maybe potential Daily DRPO buy opportunity in the future. Good luck!
04-02-2015 00-14-55.jpg
 
Back
Top