Sive Morten
Special Consultant to the FPA
- Messages
- 18,760
Monthly
As Reuters reports, Euro zone growth numbers on Friday topped forecasts and helped push the euro to a nearly three-week peak against the dollar, which slid for a second straight day on accumulating worries about U.S. economic growth. The dollar index of six major currencies on Friday slid to a low of 80.065, its 2014 bottom so far, and was last at 80.199, down 0.16 percent. U.S. economic data has been dampened by a rough North American winter, disappointing many investors throttling back on dollar investments, according to analyst Joe Manimbo at Western Union Business Solutions in Washington. "Until U.S. growth starts to show more promising potential, the dollar could be at risk for further slippage," Manimbo said in a commentary. "The dollar is having a bad day," said Lane Newman, director of foreign exchange at ING Capital Markets in New York. "A lot of it has to do with positioning involving the euro."
The euro flirted with the $1.37 level, the top of the daily Ichimoku cloud, a technical measure of support and resistance which is significant for chartists. A close above that level could provide support to send the euro even higher. The euro was at $1.3699 in late trade in New York. The single currency rose as high as $1.3715 after slightly stronger-than-expected growth in Germany and France pushed euro zone fourth-quarter GDP up 0.3 percent, above a forecast of 0.2 percent. The data bolstered hopes the European Central Bank was less likely to take anti-deflation action next month and contrasted with a Washington report that U.S. manufacturing output during January marked its biggest monthly drop in 4-1/2 years. The euro zone data is likely to help reduce expectations that the ECB will cut interest rates at next month's meeting, after President Mario Draghi last week declared more information was needed before deciding on any action.
"When you see better growth data the market quite simply thinks there's less chance of deflation and less chance of Draghi taking action, which is currency-supportive," said Jane Foley, senior currency strategist at Rabobank. She said she expects no ECB action next month as Draghi will take "a few months at least" to assess the inflation data.
The Australian dollar was in focus after it dropped one full U.S. cent on Thursday in the wake of surprisingly weak labor data. It rebounded on Friday by 0.6 percent to $0.9033 helped by data showing China's consumer prices rose 2.5 percent in January, broadly in line with expectations. China is Australia's main export market and the Aussie dollar is often used as a liquid proxy for investor bets on the Chinese economy.
B]Technical[/B]
As we didn’t look on cable for a long period, today we will fix this weak point. We’ve talked much about yen in previous 2 week, so that I’m sure that you will be able to follow our trading plan (that is still valid by the way) and continue trading there without my participation for some time. On EUR we have nice bullish moment on long time frame charts, but I see lack of setups for short-term trading. Thus, I’ve decided to dedicate current research to GBP. Besides, here we have some intriguing moment – our long term analysis that we’ve made in Forex Military School in 2011. Here is the chart:
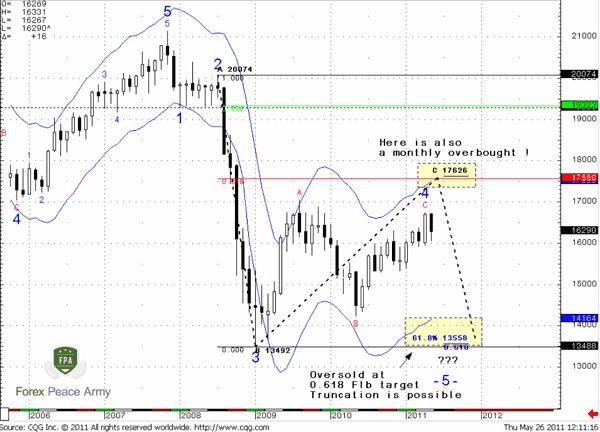 As you can see, we have suggested downward reversal as 5th wave of Elliot waves pattern after upward breakout of initial retracement’s top. Although market has formed more swings on the way to final upward action – this is not very important. The major important thing here is a final move up to final target of retracement before downward reversal. And now we stand precisely at the eve of this action. Better to say that this move already has started, but we still stand in the initial moment of this move.
Now let’s shift to modern chart.

You can see that market has not taken out the top of initial swing up of current retracement and still is approaching to it. At the same time market has passed through minor AB-CD 0.618 extension. It means that next target is 100% extension. Trend holds bullish here. Right now market is forming different patterns that point on the same level. They are AB-CD that is based on initial ABC swing of this retracement and butterfly “sell” that has 1.27 reversal target in the same area – around 1.77-1.7750. This level also will be monthly overbought and major 5/8 Fib resistance. In fact you can get three different Fib levels that will envelop 1.77 area, if you will draw them from different reaction points – I’ve marked them by red circles. But in general this moment does not change overall picture – area around 1.80 will be rock hard resistance.
Second moment is 1.70-1.71 historical support/resistance line. It stands accross the chart as demarcation line. So, conclusion here is bullish context with upside potential 1.77-1.80 area. Also, on monthly chart you can easily see how market forms higher lows, while continues struggle with the same resistance around 1.68-1.70. This also points on growing bullish power and increases probability of upward breakout. To better estimate final target and potential downward reversal point we will have to look for lower time frames, patterns that will be formed there.
After market wil hit upward target area we should turn to downward trend, since previous bearish momentum was unstoppable solid and lead to some downward continuation (as final 5th wave down) as it was pictured on 2011 chart.
Weekly
Weekly picture shows fast upward action with minor retracements. Here we have three important moments. First is – market has moved above MPR1. We do not know yet, whether market will close above it, but right now this is potential sign of upward continuation. Also we see here bullish dynamic pressure. Although trend holds bearish, but market shows strong upward action. And finally, 3 weeks ago market has hit target of Double Bottom pattern, but on recent week has closed above it. Still, it is possible that resistance still works and impacts market. Do not forget that market has moved above 0.618 monthly target. Take a look at price action – after breakout of previous highs around MPP – market has shown minor retracement, just to re-test broken level and turn to upside action again. This is normal bullish development. Market is not at overbought and not at some superb resistance. Thus, weekly chart absolutely does not contradict to monthly analysis. It just is not as bright as monthly one and doesn’t provide any clear patterns here yet.

Daily
On daily chart trend is bullish, recent action looks really impressive. But market right now has reached daily overbought level. Thus, we need to wait some pullback for taking long position. This is first time since September 2013, when market has hit daily overbought level. As market just has re-established upward action and currently stands neither at some strong resistance nor at extension target, we could suggest to types of action. First is creeping with overbought, when market will turn to shy downward bounces on intraday charts. Second is single deeper retracement to some Fib support level. On daily time frame we can take a look at second scenario. Thus, if some solid retracement will happen there are two levels to watch for. First one is a previous top accompanied by MPR1 and new WPP. Slightly lower stands first Fib support level 1.6563. So, we can call this area as 1.6560-1.6630. But as we stand at overbought and we know that WPS1 should hold any downward retracement if upward trend stands intact – second level is more reliable and valuable in current circumstances. This is 1.6470-1.65 area of MPP and WPS1. This is also approximately middle area between Oscillator Predictor bands.

4-hour
This time frame is a major one for short-term trading. As you can see, here we have excellent thrust that is suitable for any DiNapoli directional trade by itself. Market has not quite reached 1.27 extension of previous swing down, that’s why it is possible that prive will reach it first and then could turn to retracement (if any). So, first moment to watch for is a type of green line (3x3 DMA) crossing to estimate what pattern will take place. If price will reach directly First level – previous top, WPP and Fib support, then this will be probably B&B “buy” in this case we can take long position. Still, as we stand at daily overbought – do not hold position higher than previous top, or even choose closer target. For example, regular target of B&B pattern – 5/8 Fib resistance of whole retracement down.
If instead market will show DRPO – two crossing of 3x3 DMA, but will not test Fib support area. This will mean that we could get second scenario – deeper retracement on daily chart. In this case we can try to take scalp short position and later turn to upward action. Since DRPO on 4-hour could become just a triggering pattern for B&B “Buy” on daily. Thus, on coming week we mostly will deal with this thrust and all patterns that could appear around it.

Conclusion:
On long-term charts price has started to show signs of upward continuation and it could point us direction for long period and extended targets.
Meantime, as market has hit overbought on daily we will either take scalp long trades at retracements and exit at previous highs or take long position on daily chart when some solid retracement will happen. For that purpose we need to monitor situation on 4-hour chart. Pattern that will be formed there will point us which scenario is more probable currently.
The technical portion of Sive's analysis owes a great deal to Joe DiNapoli's methods, and uses a number of Joe's proprietary indicators. Please note that Sive's analysis is his own view of the market and is not endorsed by Joe DiNapoli or any related companies.
As Reuters reports, Euro zone growth numbers on Friday topped forecasts and helped push the euro to a nearly three-week peak against the dollar, which slid for a second straight day on accumulating worries about U.S. economic growth. The dollar index of six major currencies on Friday slid to a low of 80.065, its 2014 bottom so far, and was last at 80.199, down 0.16 percent. U.S. economic data has been dampened by a rough North American winter, disappointing many investors throttling back on dollar investments, according to analyst Joe Manimbo at Western Union Business Solutions in Washington. "Until U.S. growth starts to show more promising potential, the dollar could be at risk for further slippage," Manimbo said in a commentary. "The dollar is having a bad day," said Lane Newman, director of foreign exchange at ING Capital Markets in New York. "A lot of it has to do with positioning involving the euro."
The euro flirted with the $1.37 level, the top of the daily Ichimoku cloud, a technical measure of support and resistance which is significant for chartists. A close above that level could provide support to send the euro even higher. The euro was at $1.3699 in late trade in New York. The single currency rose as high as $1.3715 after slightly stronger-than-expected growth in Germany and France pushed euro zone fourth-quarter GDP up 0.3 percent, above a forecast of 0.2 percent. The data bolstered hopes the European Central Bank was less likely to take anti-deflation action next month and contrasted with a Washington report that U.S. manufacturing output during January marked its biggest monthly drop in 4-1/2 years. The euro zone data is likely to help reduce expectations that the ECB will cut interest rates at next month's meeting, after President Mario Draghi last week declared more information was needed before deciding on any action.
"When you see better growth data the market quite simply thinks there's less chance of deflation and less chance of Draghi taking action, which is currency-supportive," said Jane Foley, senior currency strategist at Rabobank. She said she expects no ECB action next month as Draghi will take "a few months at least" to assess the inflation data.
The Australian dollar was in focus after it dropped one full U.S. cent on Thursday in the wake of surprisingly weak labor data. It rebounded on Friday by 0.6 percent to $0.9033 helped by data showing China's consumer prices rose 2.5 percent in January, broadly in line with expectations. China is Australia's main export market and the Aussie dollar is often used as a liquid proxy for investor bets on the Chinese economy.
B]Technical[/B]
As we didn’t look on cable for a long period, today we will fix this weak point. We’ve talked much about yen in previous 2 week, so that I’m sure that you will be able to follow our trading plan (that is still valid by the way) and continue trading there without my participation for some time. On EUR we have nice bullish moment on long time frame charts, but I see lack of setups for short-term trading. Thus, I’ve decided to dedicate current research to GBP. Besides, here we have some intriguing moment – our long term analysis that we’ve made in Forex Military School in 2011. Here is the chart:
Now let’s shift to modern chart.
You can see that market has not taken out the top of initial swing up of current retracement and still is approaching to it. At the same time market has passed through minor AB-CD 0.618 extension. It means that next target is 100% extension. Trend holds bullish here. Right now market is forming different patterns that point on the same level. They are AB-CD that is based on initial ABC swing of this retracement and butterfly “sell” that has 1.27 reversal target in the same area – around 1.77-1.7750. This level also will be monthly overbought and major 5/8 Fib resistance. In fact you can get three different Fib levels that will envelop 1.77 area, if you will draw them from different reaction points – I’ve marked them by red circles. But in general this moment does not change overall picture – area around 1.80 will be rock hard resistance.
Second moment is 1.70-1.71 historical support/resistance line. It stands accross the chart as demarcation line. So, conclusion here is bullish context with upside potential 1.77-1.80 area. Also, on monthly chart you can easily see how market forms higher lows, while continues struggle with the same resistance around 1.68-1.70. This also points on growing bullish power and increases probability of upward breakout. To better estimate final target and potential downward reversal point we will have to look for lower time frames, patterns that will be formed there.
After market wil hit upward target area we should turn to downward trend, since previous bearish momentum was unstoppable solid and lead to some downward continuation (as final 5th wave down) as it was pictured on 2011 chart.
Weekly
Weekly picture shows fast upward action with minor retracements. Here we have three important moments. First is – market has moved above MPR1. We do not know yet, whether market will close above it, but right now this is potential sign of upward continuation. Also we see here bullish dynamic pressure. Although trend holds bearish, but market shows strong upward action. And finally, 3 weeks ago market has hit target of Double Bottom pattern, but on recent week has closed above it. Still, it is possible that resistance still works and impacts market. Do not forget that market has moved above 0.618 monthly target. Take a look at price action – after breakout of previous highs around MPP – market has shown minor retracement, just to re-test broken level and turn to upside action again. This is normal bullish development. Market is not at overbought and not at some superb resistance. Thus, weekly chart absolutely does not contradict to monthly analysis. It just is not as bright as monthly one and doesn’t provide any clear patterns here yet.
Daily
On daily chart trend is bullish, recent action looks really impressive. But market right now has reached daily overbought level. Thus, we need to wait some pullback for taking long position. This is first time since September 2013, when market has hit daily overbought level. As market just has re-established upward action and currently stands neither at some strong resistance nor at extension target, we could suggest to types of action. First is creeping with overbought, when market will turn to shy downward bounces on intraday charts. Second is single deeper retracement to some Fib support level. On daily time frame we can take a look at second scenario. Thus, if some solid retracement will happen there are two levels to watch for. First one is a previous top accompanied by MPR1 and new WPP. Slightly lower stands first Fib support level 1.6563. So, we can call this area as 1.6560-1.6630. But as we stand at overbought and we know that WPS1 should hold any downward retracement if upward trend stands intact – second level is more reliable and valuable in current circumstances. This is 1.6470-1.65 area of MPP and WPS1. This is also approximately middle area between Oscillator Predictor bands.
4-hour
This time frame is a major one for short-term trading. As you can see, here we have excellent thrust that is suitable for any DiNapoli directional trade by itself. Market has not quite reached 1.27 extension of previous swing down, that’s why it is possible that prive will reach it first and then could turn to retracement (if any). So, first moment to watch for is a type of green line (3x3 DMA) crossing to estimate what pattern will take place. If price will reach directly First level – previous top, WPP and Fib support, then this will be probably B&B “buy” in this case we can take long position. Still, as we stand at daily overbought – do not hold position higher than previous top, or even choose closer target. For example, regular target of B&B pattern – 5/8 Fib resistance of whole retracement down.
If instead market will show DRPO – two crossing of 3x3 DMA, but will not test Fib support area. This will mean that we could get second scenario – deeper retracement on daily chart. In this case we can try to take scalp short position and later turn to upward action. Since DRPO on 4-hour could become just a triggering pattern for B&B “Buy” on daily. Thus, on coming week we mostly will deal with this thrust and all patterns that could appear around it.
Conclusion:
On long-term charts price has started to show signs of upward continuation and it could point us direction for long period and extended targets.
Meantime, as market has hit overbought on daily we will either take scalp long trades at retracements and exit at previous highs or take long position on daily chart when some solid retracement will happen. For that purpose we need to monitor situation on 4-hour chart. Pattern that will be formed there will point us which scenario is more probable currently.
The technical portion of Sive's analysis owes a great deal to Joe DiNapoli's methods, and uses a number of Joe's proprietary indicators. Please note that Sive's analysis is his own view of the market and is not endorsed by Joe DiNapoli or any related companies.


