Sive Morten
Special Consultant to the FPA
- Messages
- 18,695
Monthly
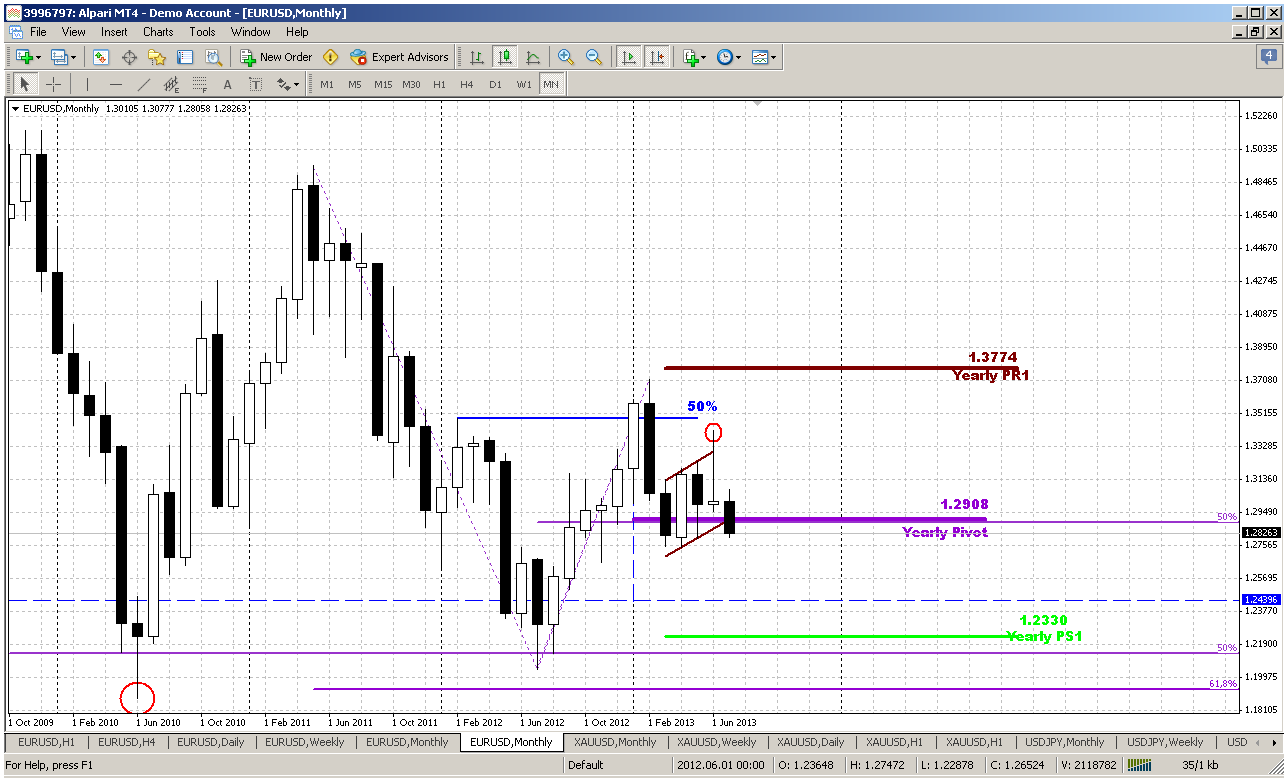
Well, although previous week was short and market was thinner than usual – action down was still significant. Unfortunately we was not as lucky in short term as in long term – market has not given us any sensible retracement up to join bearish party, but on big picture our anaysis works fine.
We said previously since this market’s move is based on fundamental data and mostly was triggered by Fed sentiment changing concerning US economy growth, QE program and inflation – we can’t treat it as occasional and short-term. Probably it will have some lasting impact on medium-term perspectives on EUR. In previous research our conclusion on monthy time frames aproximately sounds as – “it’s all about the flag”. Depending on breakout direction – further action will follow.On previous week we’ve got significant bearish pattern – bullish trap or fake upward flag breakout. By classical school of technical analysis this should lead to oposite real breakout, i.e. downside. And now we see that this is happening – price is breaking out lower flag’s border. What is also significant – market is passing through yearly pivot point and 50% support area.
As situation stands in a row with our expectations yet – minimum target stands the same area around Yearly Pivot support 1 and preavious lows 1.2150-1.23. Potentially this probably will trigger downward action by huge AB=CD pattern that has minor 0.618 target and will challenge 1.1875 lows around all time major 50% support. As you can see, any big thing starts with small one. With this flag breakout failure we have bearish long-term context, I suppose.
But on coming week our major focus will be on weekly and daily time frames.
Weekly
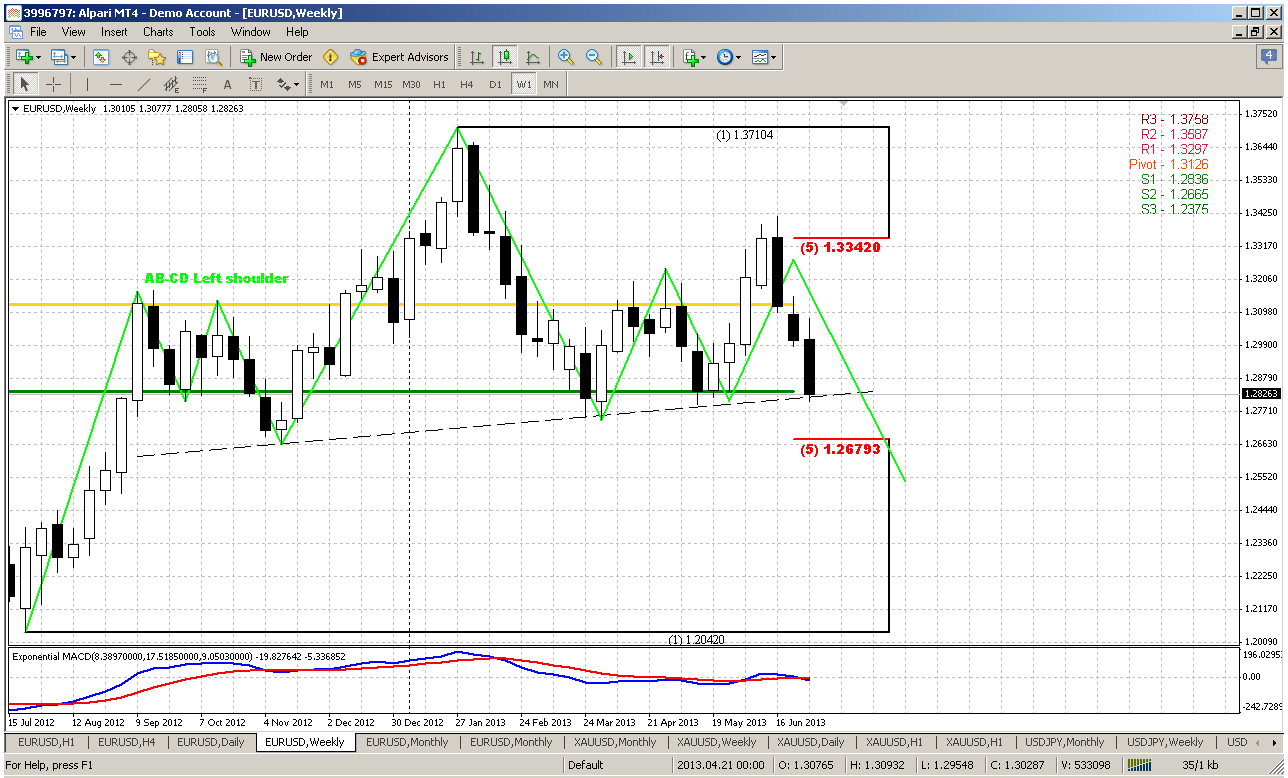
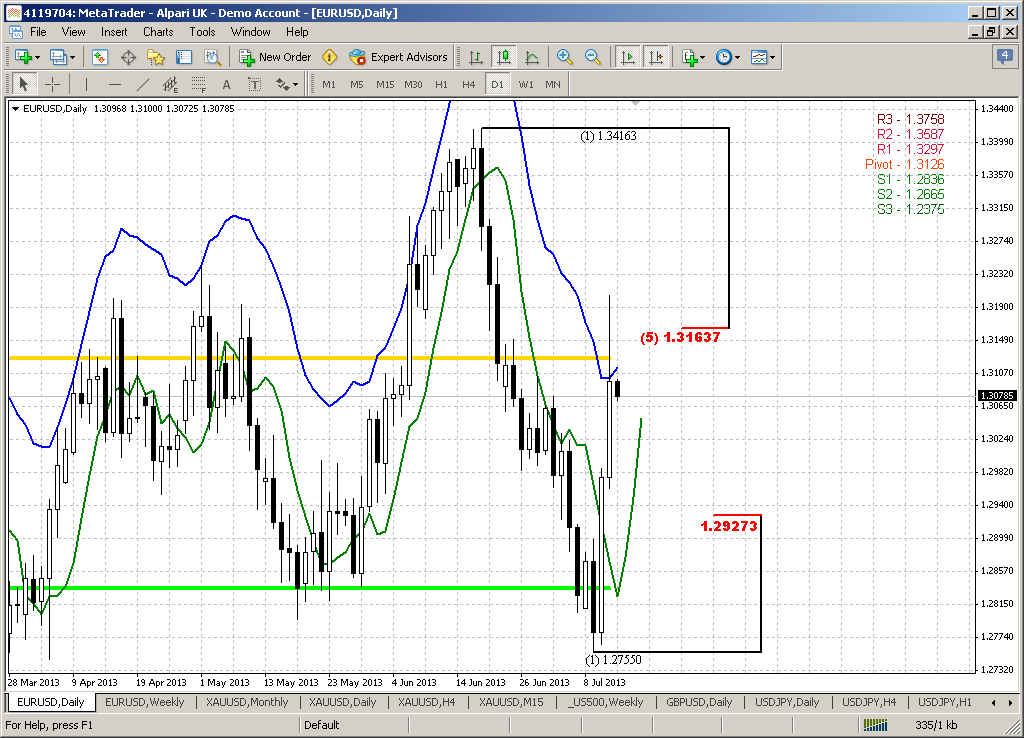
Here downside action stands fully in a row with our expectation and analysis. Trend has turned bearish. Previously we’ve said that nearest target and support area will be around 1.28-1.2830 – this is neckline and target of bearish engulfing pattern on top of right shoulder.
Now you see why this time frame is singificant for us. Here we’ve got very important information about support. 1.28 area is not only the neckline – this is also MPS1 and 0.618 extension target of AB-CD pattern that is based on the head and right shoulder. Thus, the bounce that we’ve waited on passed week, may be will happen on coming one.
H&S pattern per se looks very attractive. The target of this pattern will challenge the lows of 1.18 area as well. This is great assistance and advantage for us, when we know direction of price movement for extended period of time.
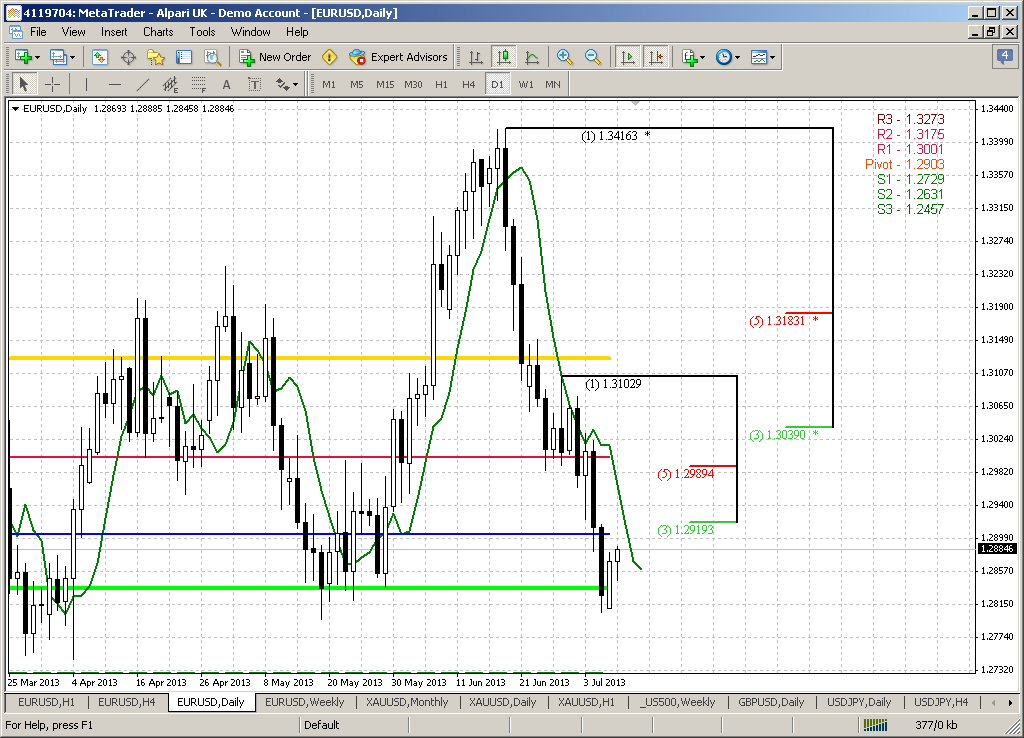
Daily
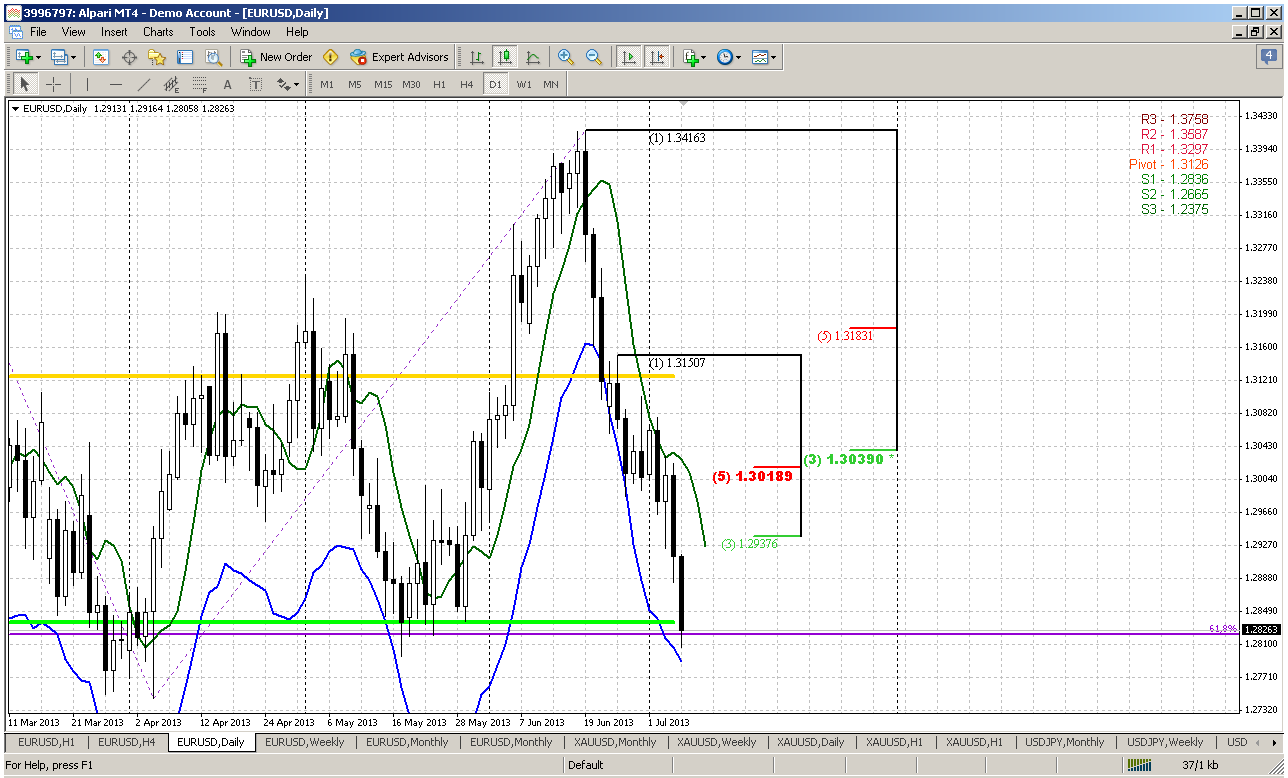
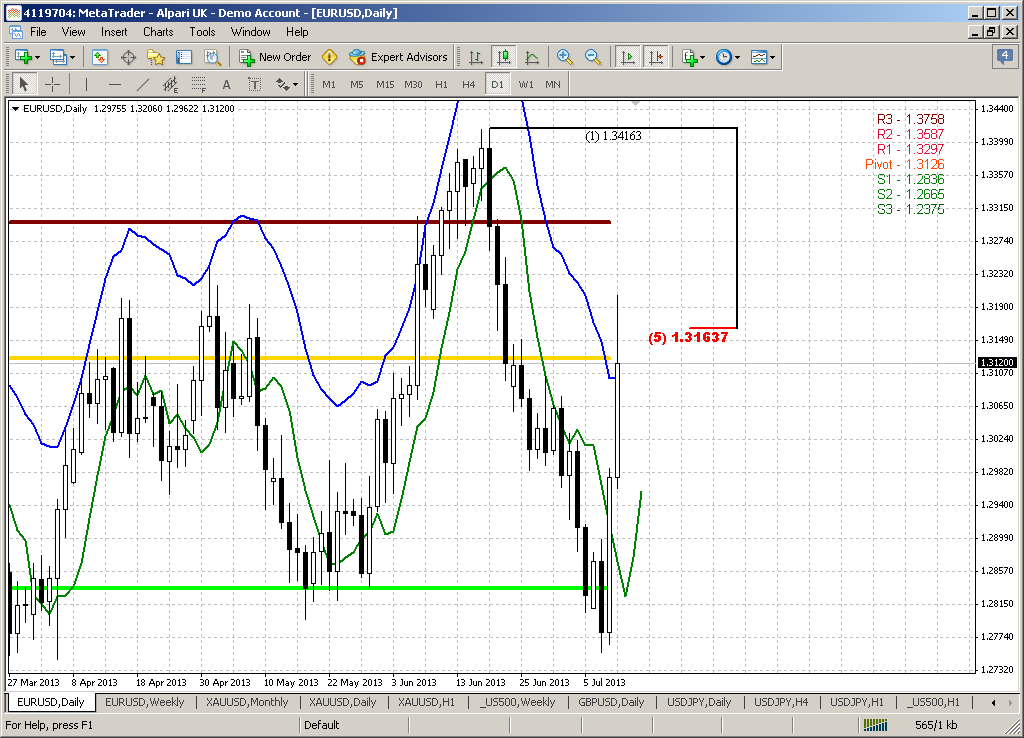
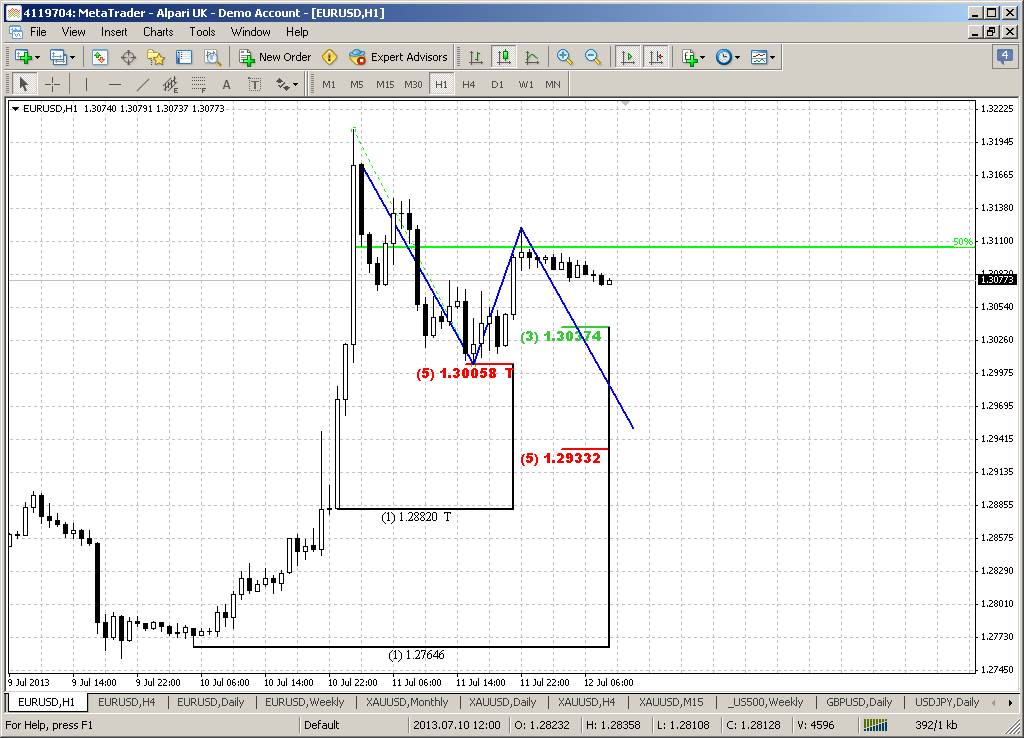
Here, guys, I do not know what will happen on this time. Market has shown V-top shape and failed to give us B&B “Buy” that we would like to get on previous week. Now we have the context for opposite trade – either B&B “Sell” or DRPO “Buy”. Price stands at significant support that includes weekly neckline, MPS1, 0.618 AB-CD target and daily oversold. We have nice thrust down that is suitable for DiNapoli directional trade. As a target of upward bounce is logically suggest 1.3020-1.3040 daily K-resistance area. We do not see any clear patterns yet here, since market just has hit this area. Let’s see what will happen on next week.
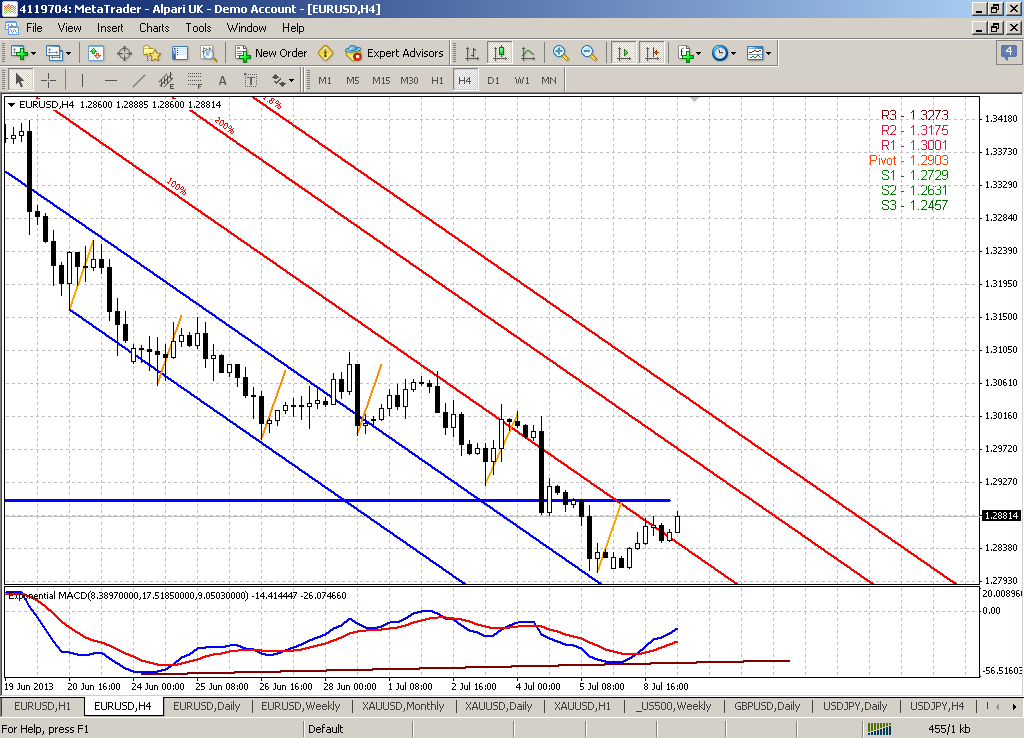
4-hour
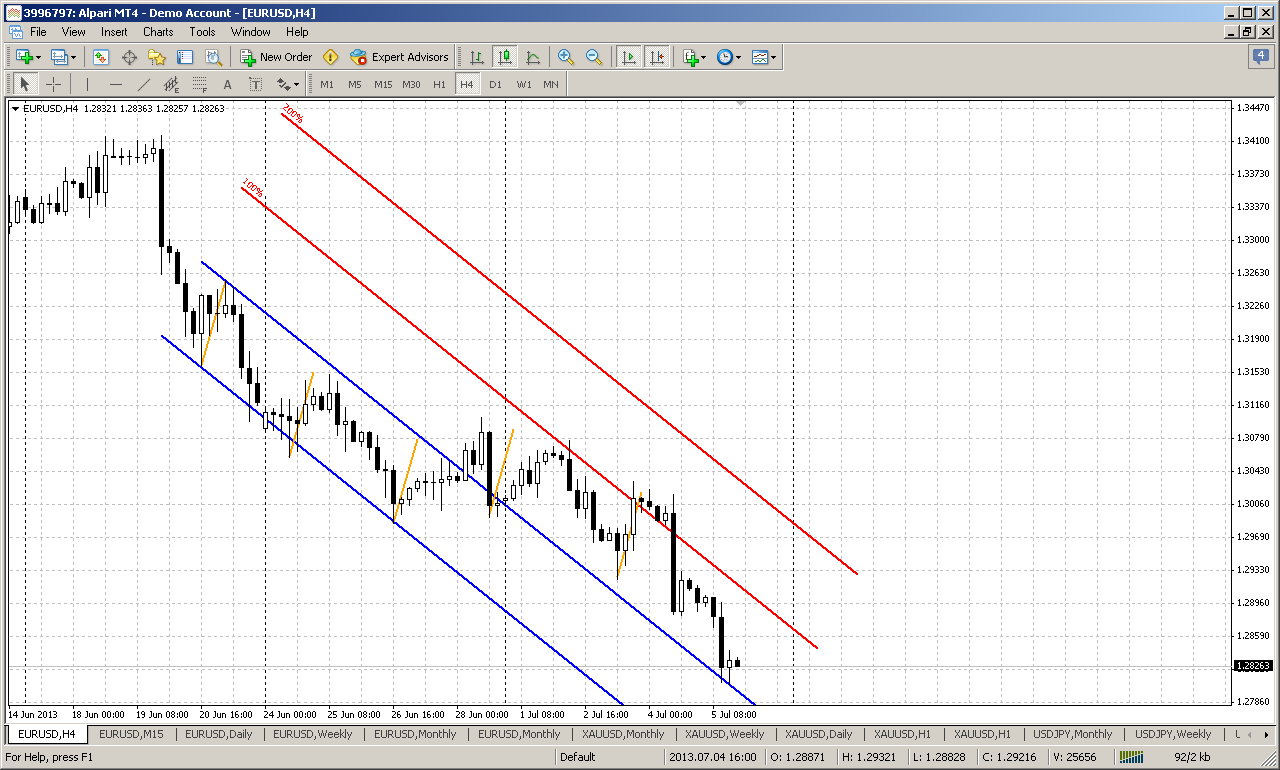
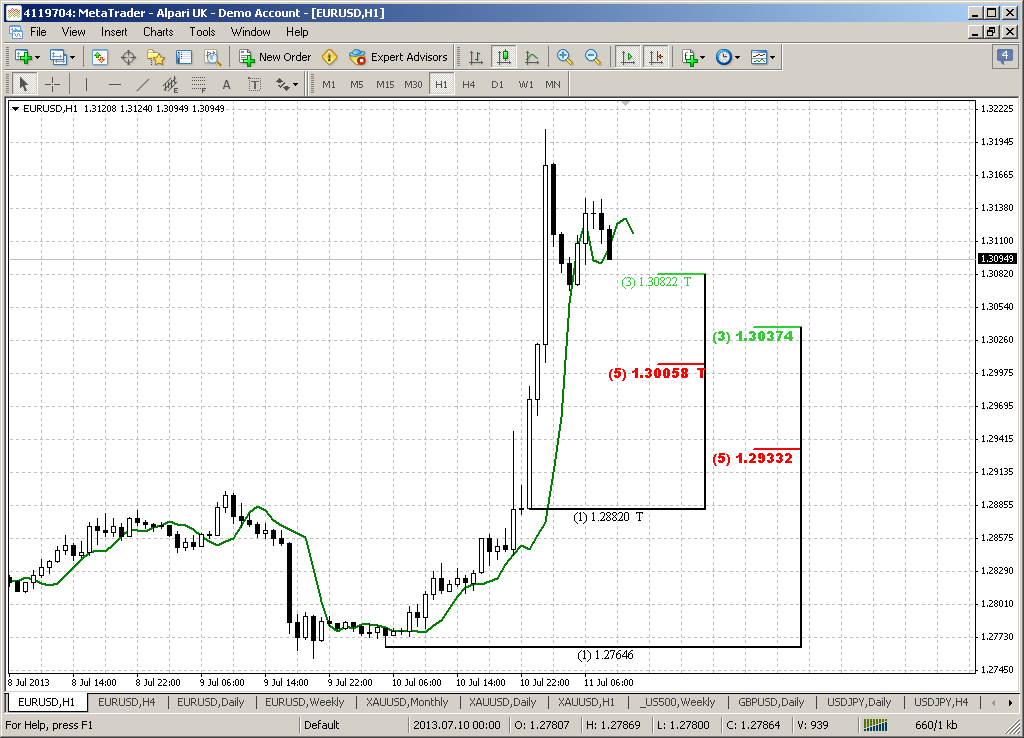
Unfortunately, guys, I do not see any reversal patterns yet – neither on 4-hour chart nor on hourly and lower ones. No Butterflies, 3-Drives, H&S’s – nothing. We do not have even candlestick patterns here. Currently we just one obvious thing – market is drifting inside of Fibonacci channels. Thus, initial channel has shifted to 1.0 extension one and market now stands inside of it. May be it will show jump to 2.0 channel or even 2.618 – I do not know. What I do know is that we need to get at minimum break of lower-lows lower-highs tendency and perfectly, if it will be in a way of some kind of reversal pattern. When and if we will get it – then the time will come to take definite and more active steps. Right now there is no foundation for this.
From the other side, we can’t enter short as well, since we at solid support. We do not know, may be market will continue action as it stands – “30 pips retracement and 1.618 go”, but this is definitely too fast from EUR natural harmonic action. Besides, we should deal with probabilitities. Sometimes strong fundamental factors distort normal action and skew probability. But this should not lead to our loss. Missing entry points – may be, but this is better than loss. That’s the scenario that we are dealing with right now and within past 2 weeks. Let’s what will happen on next week. I have some suspicion that EUR really looks a bit overextended to the downside in short-term.
Conclusion:
Current move down could have significant consecutives in long-term perspectives since it could become a trigger for long-term bear trend continuation and lead EUR to 1.18 area.
Shorter-term analysis points that market has hit our 1.28-1.2830 target of neckline and other kind of supports in this area. Although we do not see any reversal patterns yet, odds suggest the bounce. Daily K-resistance looks like logical target of this bounce. As on previous week, we need this bounce for short entry in medium-term trend but in short-term period this bounce could be used as separate context for trading.
The technical portion of Sive's analysis owes a great deal to Joe DiNapoli's methods, and uses a number of Joe's proprietary indicators. Please note that Sive's analysis is his own view of the market and is not endorsed by Joe DiNapoli or any related companies.
Well, although previous week was short and market was thinner than usual – action down was still significant. Unfortunately we was not as lucky in short term as in long term – market has not given us any sensible retracement up to join bearish party, but on big picture our anaysis works fine.
We said previously since this market’s move is based on fundamental data and mostly was triggered by Fed sentiment changing concerning US economy growth, QE program and inflation – we can’t treat it as occasional and short-term. Probably it will have some lasting impact on medium-term perspectives on EUR. In previous research our conclusion on monthy time frames aproximately sounds as – “it’s all about the flag”. Depending on breakout direction – further action will follow.On previous week we’ve got significant bearish pattern – bullish trap or fake upward flag breakout. By classical school of technical analysis this should lead to oposite real breakout, i.e. downside. And now we see that this is happening – price is breaking out lower flag’s border. What is also significant – market is passing through yearly pivot point and 50% support area.
As situation stands in a row with our expectations yet – minimum target stands the same area around Yearly Pivot support 1 and preavious lows 1.2150-1.23. Potentially this probably will trigger downward action by huge AB=CD pattern that has minor 0.618 target and will challenge 1.1875 lows around all time major 50% support. As you can see, any big thing starts with small one. With this flag breakout failure we have bearish long-term context, I suppose.
But on coming week our major focus will be on weekly and daily time frames.
Weekly
Here downside action stands fully in a row with our expectation and analysis. Trend has turned bearish. Previously we’ve said that nearest target and support area will be around 1.28-1.2830 – this is neckline and target of bearish engulfing pattern on top of right shoulder.
Now you see why this time frame is singificant for us. Here we’ve got very important information about support. 1.28 area is not only the neckline – this is also MPS1 and 0.618 extension target of AB-CD pattern that is based on the head and right shoulder. Thus, the bounce that we’ve waited on passed week, may be will happen on coming one.
H&S pattern per se looks very attractive. The target of this pattern will challenge the lows of 1.18 area as well. This is great assistance and advantage for us, when we know direction of price movement for extended period of time.
Daily
Here, guys, I do not know what will happen on this time. Market has shown V-top shape and failed to give us B&B “Buy” that we would like to get on previous week. Now we have the context for opposite trade – either B&B “Sell” or DRPO “Buy”. Price stands at significant support that includes weekly neckline, MPS1, 0.618 AB-CD target and daily oversold. We have nice thrust down that is suitable for DiNapoli directional trade. As a target of upward bounce is logically suggest 1.3020-1.3040 daily K-resistance area. We do not see any clear patterns yet here, since market just has hit this area. Let’s see what will happen on next week.
4-hour
Unfortunately, guys, I do not see any reversal patterns yet – neither on 4-hour chart nor on hourly and lower ones. No Butterflies, 3-Drives, H&S’s – nothing. We do not have even candlestick patterns here. Currently we just one obvious thing – market is drifting inside of Fibonacci channels. Thus, initial channel has shifted to 1.0 extension one and market now stands inside of it. May be it will show jump to 2.0 channel or even 2.618 – I do not know. What I do know is that we need to get at minimum break of lower-lows lower-highs tendency and perfectly, if it will be in a way of some kind of reversal pattern. When and if we will get it – then the time will come to take definite and more active steps. Right now there is no foundation for this.
From the other side, we can’t enter short as well, since we at solid support. We do not know, may be market will continue action as it stands – “30 pips retracement and 1.618 go”, but this is definitely too fast from EUR natural harmonic action. Besides, we should deal with probabilitities. Sometimes strong fundamental factors distort normal action and skew probability. But this should not lead to our loss. Missing entry points – may be, but this is better than loss. That’s the scenario that we are dealing with right now and within past 2 weeks. Let’s what will happen on next week. I have some suspicion that EUR really looks a bit overextended to the downside in short-term.
Conclusion:
Current move down could have significant consecutives in long-term perspectives since it could become a trigger for long-term bear trend continuation and lead EUR to 1.18 area.
Shorter-term analysis points that market has hit our 1.28-1.2830 target of neckline and other kind of supports in this area. Although we do not see any reversal patterns yet, odds suggest the bounce. Daily K-resistance looks like logical target of this bounce. As on previous week, we need this bounce for short entry in medium-term trend but in short-term period this bounce could be used as separate context for trading.
The technical portion of Sive's analysis owes a great deal to Joe DiNapoli's methods, and uses a number of Joe's proprietary indicators. Please note that Sive's analysis is his own view of the market and is not endorsed by Joe DiNapoli or any related companies.

")