Sive Morten
Special Consultant to the FPA
- Messages
- 18,673
Fundamentals
(Reuters) - The dollar slipped against a basket of major currencies on Friday after Federal Reserve Chair Janet Yellen said that raising interest rates this month would be appropriate as long as the economy continues to improve as expected.
Yellen's remarks follow hawkish comments in recent days from a slew of Fed speakers and cement a likely rate hike at the Fed's next meeting on March 15.
Analysts said the rate increase had largely been priced in before Yellen's comments, sending the dollar lower on Friday afternoon as some investors took profits.
"There's a lot of positive news now priced into the market, and I think we'll probably see some profit-taking, so I think we'll probably see the dollar weaken from here," said Douglas Borthwick, managing director at Chapdelaine Foreign Exchange in New York.
Yellen also said rates are likely to rise faster this year as the economy for the first time in her tenure appears clear of any imminent hurdles at home or abroad.
"Yellen's comments have caught up with market expectations, in that she's looking for three rate moves this year," Borthwick said.
The dollar index, which measures the greenback against a basket of six major currencies, was down 0.7 percent. It is up about 0.4 percent this week and on Thursday, hit a seven-week high of 102.26.
Futures traders now are pricing in an 86 percent chance of a Fed hike in March, up from 35 percent on Tuesday, according to the CME Group's FedWatch Tool.
Against the Japanese yen the greenback was down 0.24 percent.
The euro rebounded from recent weakness to rise 0.93 percent against the dollar after a poll showed French far-right candidate Marine Le Pen's chances in the country's presidential election dimming.
The political race, however, has not been the main driver for the euro's recent weakness, said Shaun Osborne, chief FX strategist at Scotiabank in Toronto.
"That's more about the shift in relative yields and monetary stance given the move in short-term rates in the U.S.," he said.
U.S. two-year Treasury yields hit their highest in more than 7-1/2 years on Thursday.
Rate hike expectations also weighed on the New Zealand dollar, which was on pace for its worst week in eleven against the greenback. On Friday, the kiwi dollar was down 0.41 percent.
Although as we see, situation has changed a bit and now March rate hike stands on the table instead of June, but Fathom brings some other interesting thoughts on perspectives of rate hike through the year:
FOMC to hold fire for now
by Fathom Consulting
According to the Minutes of the Federal Open Market Committee’s latest meeting, participants accept the need to raise the fed funds rate again “fairly soon”. That is more likely to mean June than next month, in our view.

Even though we expect US GDP and inflation to rise a lot faster than consensus this year, we anticipate just two 25 basis point increases in the fed funds rate in 2017. We saw nothing in last Wednesday’s Minutes that led us to question that view.
Indeed, we think that the Fed will let the economy run a little hot, rather than tightening interest rates aggressively this year. If we are right, then investors and the FOMC will reassess the prospects for monetary policy further ahead, bidding up the dollar and Treasury yields later this year.
Admittedly, this outlook is subject to greater-than-usual political uncertainty. Not only will the scale and timing of Mr Trump’s promised fiscal splurge have a significant effect on the economy, but the new administration is now responsible for filling three FOMC board seats this year following Daniel Tarullo’s resignation.
COT Data
(Reuters) - Speculators reduced bullish bets on the U.S. dollar in the latest week, pushing net longs to their
lowest since early October, according to Commodity Futures Trading Commission data released on Friday and calculations by Reuters.
The value of the dollar's net long position totaled $13.01 billion in the week ended Feb. 28, from $15.02 billion the previous week.
Analysts said this week's decline in net long dollar positioning could be temporary in the wake of stronger signals by the Federal Reserve that it may raise rates this month. On Friday, Fed Chair Janet Yellen gave her strongest signal yet that the U.S. central bank could nudge rates higher when it meets this month.
Several of Yellen's colleagues at the Fed have also been signaling a move in March the past several weeks.
"The (dollar) bulls are finally listening to the cohesiveness of Fed officials who have been saying all along (doves and hawks) that conditions are prime for tightening," said Kathy Lien, managing director of FX strategy at BK Asset Management in New York.
The dollar fell on Friday in the wake of Yellen's remarks, but that is more due to profit-taking since traders before the Fed chair's remarks wagered that she would strike a hawkish tone.
According to Fed fund futures date, the odds of a rate hike this month sits at 90 percent, compared with 40 percent the week before.
On EUR CFTC chart does not bring some crucial information as it is dated on 28th of February and doesn't include Friday's collapse of USD. Still, in the beginning of the week it shows that new longs have been opened, as net short position has contracted while open interest has increased:

Technical
Monthly
Despite strong rally on Friday - monthly chart is too large for it and our monthly analysis mostly stands intact. February close doesn't bring us bullish grabber, so let's see what we will get in March. While market actively was pricing-in March rate hike during last week, as soon as it has got a confirmation by Yellen aknowledgement in her speech - investors have turn to profit taking. It means that current rally has mostly technical reason and doesn't not indicate any changes in force balance.
We know that fundamental background mostly looks bearish for EUR - potentially more hawkish Fed policy, ECB QE prolongation, coming elections in many EU countries, bringing more uncertainty. After GB, separatistic sentiment start to appear in other countries of EU, as Italy, France, Netherlands, Spain that are not satisfied with Brussels domination in governing EU.
Speaking on big picture, On a way down, guys, EUR has passed through all major Fib levels. Last one was at 1.12 area and now we do not have any other ones below current market. Also price has dropped below 1.27 extension of this big butterfly. Thus, on monthly chart the only logical destination point stands at parity - 1.618 butterfly extension, chanell trend line support and YPS1.
Besides, right now EUR is testing YPP, but unsuccessfully yet.
Also take a look at different behavior near low border of channel. Previously when market has touched it - it shows immediate upside pullback, it was V-shape reversal. Right now behavior is absolutely different, price just hangs on the border and shows no upside action. Any tight consolidation near trendline could become a sign of coming breakout.
Thus, based on monthly chart we could make two major conclusions. First is - real bullish trend could be re-established only if EUR will erase reversal candle and overcome its top above 1.16. Our next target on Monthly chart is parity - 1.618 Butterfly extension, YPS1 and trendline support.
In general guys, we think that steps that already have been announced by ECB and Fed should be enough to push EUR right to parity during "price-in" process, when market will "anticipate" them. But this picture is not static, it's dynamic. And iti will depend on real action from Fed, Trump administration and ECB.

Concerning bullish perspectives... they exist here, but they stand at even larger picture:

Picture shows classical action. Take a look that since 1999 - EUR was forming upside reversal swing that lasts till Dec 2007. Now market stands in deep retracement - this is typical action as new upside reversal swing has been formed. Based on this picture EUR is approaching to area where this retracement should over and it could get chance to starts extension leg of bull trend that could lead EUR as far as to 1.76-1.82 area. Also you could recognize here some signs of reverse H&S pattern. That's why on big weekly picture we also have made a suggestion on big H&S pattern with head around parity....
Weekly
As market shows strong reaction on Fed promising of rate increase, let's talk on bullish perspectives that could be based on this event. Actually we're coming to 2-week doom&gloom. First is NFP release, second - Fed decision. Besides, second week could turn to real nightmare, if NFP will show poor numbers...
So, let's see what could happen. Right now on a way up EUR has reached 1.0830 - 3/8 major resistance, tested YPP and now we're watching whether price will form AB-CD upside action or retracement will be limited by just single leg up. Honestly speaking, here, even reaching of 5/8 resistance is acceptable. It means that if our daily H&S pattern will work and EUR will reach 1.10 area - this will not erase yet long-term bearish picture. Besides, 1.08-1.09 range is rather strong, since it's weekly K-resistance, that also is Agreement and includes YPP. Hardly profit taking process that we see right now will be sufficient to break it through.
It means that upside retracement could just re-test 1.0830 level and complete minor 0.618 AB-CD target.
On a way down our final destination stands the same - 1.618 point coincides with 1.618 butterfly target around 0.97-1.0 area. Although we have multiple targets inside 1.0-1.05 area, ther are all minor ones.
Finally, butterfly could become part of large reverse H&S pattern, that we have discussed above. But whether it will be formed or not will depend on fundamental factors, D. Trump ficsal policy, US economy data and Fed reaction. Thus, we have more or less single road to parity, but later, around it we will get a crossroads...If there will be something bearish that wasn't priced in yet - EUR could drop even further. If not - H&S will start to form...
That's being said, on coming week we probably will work mostly with upside retracement continuation:

Daily
Although we've talked on minor upside retracement on Friday, we do not expect so explicit comments from Yellen on rate change. Thus, recent rally signficantly has changed intraday picture and bring new life to our H&S pattern.
So, lows of right shoulder have survived due Fed surprise comments. And this is the miracle that saves bulls, at least by far. It seems that this is last chance of upside action that we've mentioned previously.
Trend has turned bullish here. Our major analysis will stand on intraday charts. Here, despite of rally, we do not see something really new, as our patterns are still the same. As overbought level stands around 1.07 area, we mostly are interested with upside targets that stand below it. That's why currently we will not talk on reaching neckline, 1.083 level etc... Let's focus on objects that could be reached during coming week:

Intraday
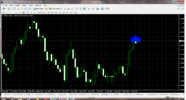
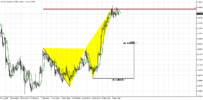
So we have two different patterns, and they have approximately the same target around 1.0720 area. First one stands on 4-hour chart and we've mentioned it in our video on Friday - this is upside butterfly. But on Friday it was unclear what reason could form it. As you can see it has 1.27 extension around daily overbought area and 1.07 Fib resistance.
Right now market just returned back to 3/8 Fib resistance and MPP. And here we should not drop to euphoria but control breakout of our flag consolidation. Here EUR should not return too deep back inside it.

On hourly chart we have 2 patterns. First one is double bottom, but as it has mostly the same target as butterfly - it is not very interesting on Monday. But second one - is potential reverse H&S. Take a look that our butterfly that we've traded recently has become a left shoulder this is very typical.
Thus, let's focus on this H&S pattern. It suggests appearing of right shoulder, when EUR could test new WPP around 1.0580 area. And it brings closer targets. First one will stand around WPR1 @ 1.0670. If market indeed will start upside action, later we will turn to more extended targets of 4-hour butterfly and Double bottom patterns:

Conclusion:
Despite changing of short-term sentiment, we do not think that it brings some real hazard to long-term bearish tendency yet. Thus, right now it is better to treat it as retracement as fundamental background slightly has changed.
Most part of the week we probably will deal with this upward reaction on Yellen speech. Major day will be Friday, as NFP release could bring frustration to investors if numbers will be poor. And it is very difficult to forecast how this will impact on March Fed meeting results.
The technical portion of Sive's analysis owes a great deal to Joe DiNapoli's methods, and uses a number of Joe's proprietary indicators. Please note that Sive's analysis is his own view of the market and is not endorsed by Joe DiNapoli or any related companies.
(Reuters) - The dollar slipped against a basket of major currencies on Friday after Federal Reserve Chair Janet Yellen said that raising interest rates this month would be appropriate as long as the economy continues to improve as expected.
Yellen's remarks follow hawkish comments in recent days from a slew of Fed speakers and cement a likely rate hike at the Fed's next meeting on March 15.
Analysts said the rate increase had largely been priced in before Yellen's comments, sending the dollar lower on Friday afternoon as some investors took profits.
"There's a lot of positive news now priced into the market, and I think we'll probably see some profit-taking, so I think we'll probably see the dollar weaken from here," said Douglas Borthwick, managing director at Chapdelaine Foreign Exchange in New York.
Yellen also said rates are likely to rise faster this year as the economy for the first time in her tenure appears clear of any imminent hurdles at home or abroad.
"Yellen's comments have caught up with market expectations, in that she's looking for three rate moves this year," Borthwick said.
The dollar index, which measures the greenback against a basket of six major currencies, was down 0.7 percent. It is up about 0.4 percent this week and on Thursday, hit a seven-week high of 102.26.
Futures traders now are pricing in an 86 percent chance of a Fed hike in March, up from 35 percent on Tuesday, according to the CME Group's FedWatch Tool.
Against the Japanese yen the greenback was down 0.24 percent.
The euro rebounded from recent weakness to rise 0.93 percent against the dollar after a poll showed French far-right candidate Marine Le Pen's chances in the country's presidential election dimming.
The political race, however, has not been the main driver for the euro's recent weakness, said Shaun Osborne, chief FX strategist at Scotiabank in Toronto.
"That's more about the shift in relative yields and monetary stance given the move in short-term rates in the U.S.," he said.
U.S. two-year Treasury yields hit their highest in more than 7-1/2 years on Thursday.
Rate hike expectations also weighed on the New Zealand dollar, which was on pace for its worst week in eleven against the greenback. On Friday, the kiwi dollar was down 0.41 percent.
Although as we see, situation has changed a bit and now March rate hike stands on the table instead of June, but Fathom brings some other interesting thoughts on perspectives of rate hike through the year:
FOMC to hold fire for now
by Fathom Consulting
According to the Minutes of the Federal Open Market Committee’s latest meeting, participants accept the need to raise the fed funds rate again “fairly soon”. That is more likely to mean June than next month, in our view.
Even though we expect US GDP and inflation to rise a lot faster than consensus this year, we anticipate just two 25 basis point increases in the fed funds rate in 2017. We saw nothing in last Wednesday’s Minutes that led us to question that view.
Indeed, we think that the Fed will let the economy run a little hot, rather than tightening interest rates aggressively this year. If we are right, then investors and the FOMC will reassess the prospects for monetary policy further ahead, bidding up the dollar and Treasury yields later this year.
Admittedly, this outlook is subject to greater-than-usual political uncertainty. Not only will the scale and timing of Mr Trump’s promised fiscal splurge have a significant effect on the economy, but the new administration is now responsible for filling three FOMC board seats this year following Daniel Tarullo’s resignation.
COT Data
(Reuters) - Speculators reduced bullish bets on the U.S. dollar in the latest week, pushing net longs to their
lowest since early October, according to Commodity Futures Trading Commission data released on Friday and calculations by Reuters.
The value of the dollar's net long position totaled $13.01 billion in the week ended Feb. 28, from $15.02 billion the previous week.
Analysts said this week's decline in net long dollar positioning could be temporary in the wake of stronger signals by the Federal Reserve that it may raise rates this month. On Friday, Fed Chair Janet Yellen gave her strongest signal yet that the U.S. central bank could nudge rates higher when it meets this month.
Several of Yellen's colleagues at the Fed have also been signaling a move in March the past several weeks.
"The (dollar) bulls are finally listening to the cohesiveness of Fed officials who have been saying all along (doves and hawks) that conditions are prime for tightening," said Kathy Lien, managing director of FX strategy at BK Asset Management in New York.
The dollar fell on Friday in the wake of Yellen's remarks, but that is more due to profit-taking since traders before the Fed chair's remarks wagered that she would strike a hawkish tone.
According to Fed fund futures date, the odds of a rate hike this month sits at 90 percent, compared with 40 percent the week before.
On EUR CFTC chart does not bring some crucial information as it is dated on 28th of February and doesn't include Friday's collapse of USD. Still, in the beginning of the week it shows that new longs have been opened, as net short position has contracted while open interest has increased:
Technical
Monthly
Despite strong rally on Friday - monthly chart is too large for it and our monthly analysis mostly stands intact. February close doesn't bring us bullish grabber, so let's see what we will get in March. While market actively was pricing-in March rate hike during last week, as soon as it has got a confirmation by Yellen aknowledgement in her speech - investors have turn to profit taking. It means that current rally has mostly technical reason and doesn't not indicate any changes in force balance.
We know that fundamental background mostly looks bearish for EUR - potentially more hawkish Fed policy, ECB QE prolongation, coming elections in many EU countries, bringing more uncertainty. After GB, separatistic sentiment start to appear in other countries of EU, as Italy, France, Netherlands, Spain that are not satisfied with Brussels domination in governing EU.
Speaking on big picture, On a way down, guys, EUR has passed through all major Fib levels. Last one was at 1.12 area and now we do not have any other ones below current market. Also price has dropped below 1.27 extension of this big butterfly. Thus, on monthly chart the only logical destination point stands at parity - 1.618 butterfly extension, chanell trend line support and YPS1.
Besides, right now EUR is testing YPP, but unsuccessfully yet.
Also take a look at different behavior near low border of channel. Previously when market has touched it - it shows immediate upside pullback, it was V-shape reversal. Right now behavior is absolutely different, price just hangs on the border and shows no upside action. Any tight consolidation near trendline could become a sign of coming breakout.
Thus, based on monthly chart we could make two major conclusions. First is - real bullish trend could be re-established only if EUR will erase reversal candle and overcome its top above 1.16. Our next target on Monthly chart is parity - 1.618 Butterfly extension, YPS1 and trendline support.
In general guys, we think that steps that already have been announced by ECB and Fed should be enough to push EUR right to parity during "price-in" process, when market will "anticipate" them. But this picture is not static, it's dynamic. And iti will depend on real action from Fed, Trump administration and ECB.
Concerning bullish perspectives... they exist here, but they stand at even larger picture:
Picture shows classical action. Take a look that since 1999 - EUR was forming upside reversal swing that lasts till Dec 2007. Now market stands in deep retracement - this is typical action as new upside reversal swing has been formed. Based on this picture EUR is approaching to area where this retracement should over and it could get chance to starts extension leg of bull trend that could lead EUR as far as to 1.76-1.82 area. Also you could recognize here some signs of reverse H&S pattern. That's why on big weekly picture we also have made a suggestion on big H&S pattern with head around parity....
Weekly
As market shows strong reaction on Fed promising of rate increase, let's talk on bullish perspectives that could be based on this event. Actually we're coming to 2-week doom&gloom. First is NFP release, second - Fed decision. Besides, second week could turn to real nightmare, if NFP will show poor numbers...
So, let's see what could happen. Right now on a way up EUR has reached 1.0830 - 3/8 major resistance, tested YPP and now we're watching whether price will form AB-CD upside action or retracement will be limited by just single leg up. Honestly speaking, here, even reaching of 5/8 resistance is acceptable. It means that if our daily H&S pattern will work and EUR will reach 1.10 area - this will not erase yet long-term bearish picture. Besides, 1.08-1.09 range is rather strong, since it's weekly K-resistance, that also is Agreement and includes YPP. Hardly profit taking process that we see right now will be sufficient to break it through.
It means that upside retracement could just re-test 1.0830 level and complete minor 0.618 AB-CD target.
On a way down our final destination stands the same - 1.618 point coincides with 1.618 butterfly target around 0.97-1.0 area. Although we have multiple targets inside 1.0-1.05 area, ther are all minor ones.
Finally, butterfly could become part of large reverse H&S pattern, that we have discussed above. But whether it will be formed or not will depend on fundamental factors, D. Trump ficsal policy, US economy data and Fed reaction. Thus, we have more or less single road to parity, but later, around it we will get a crossroads...If there will be something bearish that wasn't priced in yet - EUR could drop even further. If not - H&S will start to form...
That's being said, on coming week we probably will work mostly with upside retracement continuation:
Daily
Although we've talked on minor upside retracement on Friday, we do not expect so explicit comments from Yellen on rate change. Thus, recent rally signficantly has changed intraday picture and bring new life to our H&S pattern.
So, lows of right shoulder have survived due Fed surprise comments. And this is the miracle that saves bulls, at least by far. It seems that this is last chance of upside action that we've mentioned previously.
Trend has turned bullish here. Our major analysis will stand on intraday charts. Here, despite of rally, we do not see something really new, as our patterns are still the same. As overbought level stands around 1.07 area, we mostly are interested with upside targets that stand below it. That's why currently we will not talk on reaching neckline, 1.083 level etc... Let's focus on objects that could be reached during coming week:
Intraday
So we have two different patterns, and they have approximately the same target around 1.0720 area. First one stands on 4-hour chart and we've mentioned it in our video on Friday - this is upside butterfly. But on Friday it was unclear what reason could form it. As you can see it has 1.27 extension around daily overbought area and 1.07 Fib resistance.
Right now market just returned back to 3/8 Fib resistance and MPP. And here we should not drop to euphoria but control breakout of our flag consolidation. Here EUR should not return too deep back inside it.
On hourly chart we have 2 patterns. First one is double bottom, but as it has mostly the same target as butterfly - it is not very interesting on Monday. But second one - is potential reverse H&S. Take a look that our butterfly that we've traded recently has become a left shoulder this is very typical.
Thus, let's focus on this H&S pattern. It suggests appearing of right shoulder, when EUR could test new WPP around 1.0580 area. And it brings closer targets. First one will stand around WPR1 @ 1.0670. If market indeed will start upside action, later we will turn to more extended targets of 4-hour butterfly and Double bottom patterns:
Conclusion:
Despite changing of short-term sentiment, we do not think that it brings some real hazard to long-term bearish tendency yet. Thus, right now it is better to treat it as retracement as fundamental background slightly has changed.
Most part of the week we probably will deal with this upward reaction on Yellen speech. Major day will be Friday, as NFP release could bring frustration to investors if numbers will be poor. And it is very difficult to forecast how this will impact on March Fed meeting results.
The technical portion of Sive's analysis owes a great deal to Joe DiNapoli's methods, and uses a number of Joe's proprietary indicators. Please note that Sive's analysis is his own view of the market and is not endorsed by Joe DiNapoli or any related companies.