- Forex, Gold, BTC Market Analysis | Trading Signals
- Sive Morten- Currencies, Gold, Bitcoin Daily Video
You are using an out of date browser. It may not display this or other websites correctly.
You should upgrade or use an alternative browser.
You should upgrade or use an alternative browser.
FOREX PRO Weekly March 11-15, 2013
- Thread starter Sive Morten
- Start date
DevTrader
Private, 1st Class
- Messages
- 56
Market is moving as per our projection and trend already become bullish on hourly and 4 hour chart.so now lets task it to watch where this retracment end.Typical fib level comes around 1.3130-13150.So i m holding my long of yesterday for this target.
Important issue i want to highlight here is about activity in this forum is on bearish side.From last few weeks it is continuing in declining side.I am really surprised to see how u can ignore such a great analysis by Sive morten. He is a great teacher.I hope to see soon those activeness back to this forum.
I even noted one more thing is that since starting gold daily analysis ,downtrend also started in EUR/USD forum.
Let's hope for the best and I am sure FPA has also note this point.
frankiebgood
Private
- Messages
- 23
thanks sive, you saved my donkey a few times.
Sive Morten
Special Consultant to the FPA
- Messages
- 18,763
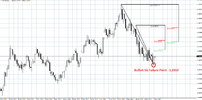
Possibly we can see a B&B Buy from 1.2956, along with a reverse H&S/double bottom/bullish engulfing on 4 hr tf. (With one broker it looks like a H&S, with another it looks like a double bottom, with another it looks like a bullish engulfing - depending on the time difference due to DST). Do you concur, Sive? Or do we looks at this as already a B&B sell, having reached .618 level from the down bar of yesterday?Regarding yearly pivot point, it has not quite been touched - by 1.5 pips. And as a pivot point, the market will want to actually trade it for a time, not just touch it, is this correct?
Hi Cosmos,
concerning 4-hour chart, actually I see nothing, except downward channel, as I said. No sufficient thurst for any DiNapoli directionals here.
Speaking about yearly pivot - you're absolutely right and we have pretty much time till the end of the year
Market is moving as per our projection and trend already become bullish on hourly and 4 hour chart.so now lets task it to watch where this retracment end.Typical fib level comes around 1.3130-13150.So i m holding my long of yesterday for this target.
Important issue i want to highlight here is about activity in this forum is on bearish side.From last few weeks it is continuing in declining side.I am really surprised to see how u can ignore such a great analysis by Sive morten. He is a great teacher.I hope to see soon those activeness back to this forum.
I even noted one more thing is that since starting gold daily analysis ,downtrend also started in EUR/USD forum.
Let's hope for the best and I am sure FPA has also note this point.
Hi Devang,
that is also curious for me, but this has happened before as well, when we've added JPY and GBP analsyis. Activity in EUR thread has declined.
Hi,
What about the 1.61ext of Wednesdays Pattern? Maybe this is a fake move and the real bounce has not started yet?
Hi Ghandi, when we calculate extensions, we prefer to have B point higher or at least equal to A, while here it stands lower. Sometimes this could be used - mostly when you calculate extension's support/resistance levels, but for target estimation - the former is prefferable.
Hi Cosmos,
concerning 4-hour chart, actually I see nothing, except downward channel, as I said. No sufficient thrust for any DiNapoli directionals here.
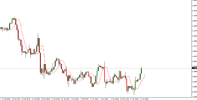
Hi Sive, Here is a screen shot of the 4-hour chart I was referring to. It is one hour behind where it was last week due to the US Daylight Savings Ttime. I had this question anyway regarding the differing chart views during the time changes over the year - do you have any comment on this?
Hi Cosmos,
concerning 4-hour chart, actually I see nothing, except downward channel, as I said. No sufficient thrust for any DiNapoli directionals here.
Hi Sive, Here is a screen shot of the 4-hour chart I was referring to where I thought I saw a double bottom. It is one hour behind where it was last week due to the US Daylight Savings Time. I had this question anyway regarding the differing chart views during the time changes over the year - do you have any comment on this?
Attachments
Last edited:
Sive Morten
Special Consultant to the FPA
- Messages
- 18,763
is it possible for you to share your pivot point indicators like the one that draws color lines at the levels. thanks you can email me directly at rdfrcf at yahoo dot com
Hi,
I've posted somewhere here it previously. Apply "search" tool and just download...
Similar threads
- Replies
- 11
- Views
- 273
- Replies
- 1
- Views
- 72
- Replies
- 8
- Views
- 260
- Replies
- 1
- Views
- 79
- Replies
- 7
- Views
- 232
- Forex, Gold, BTC Market Analysis | Trading Signals
- Sive Morten- Currencies, Gold, Bitcoin Daily Video


