Sive Morten
Special Consultant to the FPA
- Messages
- 18,760
Monthly
In today’s discussion of EUR monthly chart I would like to touch really big picture and extended perspectives. First of all, let’s take a look at US Dollar index quarterly chart. Our old members probably remember our long-term analysis that we’ve made in November of 2011. It was based on Gartley’s “222” Buy on quarterly chart and “D” point of downward AB=CD also has created a bullish stop grabber (unfortunately I can’t plot MACDP on this chart), that suggests taking out tops around 89 level. On previous week many technical analysts have pointed on possible reverse H&S pattern (Lolly Tripathy has posted it on our forum) and in general, as you can see – dollar index strongly holds above lows of 2008 and 2011 and now stands in tight range with small upward angle. Any consolidation usually leads to fast exit. As we can see our setup is still valid. Besides, if market will show action that we’ve suggested, this could lead to appearing of reverse H&S on quarterly chart since 90’s level could be treated as neckline (use your imagination). So, in long term perspective, at least currently, as we do not have reasons to thing opposite, - USD is bullish.
Fundamental rumors after FOMC meeting tell that Fed Reserve feels more and more pressure as it holds QE program. Corporate profits and results do not improve and only blind one do not see buble on stock market and on real estate market. Thus, if even they will not see desirable levels on unemployment (below 6.5%) and inflation (~2%), they do not see positive results of QE either. As time will passing by, Fed will strongly and strongy feel preasure of future risks and hazard on uncontrolled inflation. They probably anyway will have to close QE. They probably already feel this pressure. Thus, stopping of B85$ inflow will lead to buble blow on stock market and this will lead to another financial market crisis. Probably this will not be economy crisis, but mostly financial markets only. Still, this will be period of turmoil and analysis already start to talk about increasing demand for USD in long-term perspective as safe-haven asset for future collapse. May be this jump that we expect to see on USDX will coincide with collapse on stock market, who knows. But technically and fundamentally dollar now looks more bullish rather than bearish.

And now let’s take look at monthly time frame through the prism of quarterly USDX picture. Current reversal or whatever it is, - what is it? At first glance and by looking just at monthly chart we can say – “well, market has hit resistance and Agreement, minor bounce is possible in this case”. Indeed, market has touched 0.618 AB=CD target right at Fib resistance. In this case retracement to 1.32-1.33 area will not be look as curious. Trend holds bullish still. But honestly speaking guys, I’m a bit worring for EUR perspectives here, because something tells me that another picture has more weight right now. And here is how it looks like:
From perspective of quarterly chart, we could get “222” Sell pattern right from rock hard resistance – major 5/8 Fib level+Agreement and Yearly Pivot resistance 1. Take a look at AB-CD itself. CD leg is rather weak, especially it has become slow down even prior minor 0.618 target. This tells that upward momentum is not strong. CD leg itself is rather choppy with a lot of pullbacks. Currently we have October “Shooting star” pattern that simulteniously looks like W&R on previous swing high. This pattern suggests too deep retracement down that will be not acceptable for breakout of previous tops. And finally, we now that Pivot Resistance 1 holds retracement up if downward trend is still valid, right? That is what we see now. If you will draw trend lines, you’ll see that in fact, price action since April 2012 looks like rising wedge pattern. If we’re correct with our view, appearing of “222” Sell will lead price at minimum to 1.1950-1.20 area, it’s minor 0.618 extension. Now you can imagine where we could get if this will be Butterfly “Buy”, that we’ve discussed in previous research, dedicated to EUR. That’s right – 1.10. May be this is too pessimistic issue for EUR, and too far view, but anyway, right now I do not see valuable signs of EUR strength.

Weekly
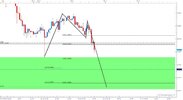
Trend holds bullish here. At the first glance past week’s plunge looks awful, but, guys – it holds harmonic distance! Take a look – swings up are equal to each other, and retracement down are also equal. Although recent swing up lasts 1 week longer, while recent plunge was 1 week faster than previous one...
But overall picture does not wake on long entry. Price action still gives us solid bearish engulfing pattern, that actually engulfs 2 weeks. Next support here is 1.3380-1.3420 weekly K-support that also includes previous peaks.
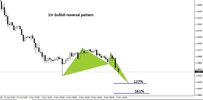
What risks are exist for short-term bearish plan? First is butterfly. Market has not reached yet 1.27 extension around 1.3966 and market still stands at the edge by far, when move up is still possible, at least theoretically. Our forum member Minimax also has posted his analysis on EUR and he thinks that splash up before final downward reversal is still possible. Thus, his fractal and EW analysis also suggests some motion that stands in a row with possible butterfly finalizing. Second risk is stop grabber. On next week market will fluctuate with weekly MACDP. If grabber will be formed, then this will be the pattern that we will have to take into consideration. This also could encrease chances on another upward move. It means that if we want to take short position – we have to do this as closer to 1.3830 area as possible and then monitor breakout of 1.3460-1.3480 level. This kind of action should give us room and chance to loose nothing, even if upward action will follow. Conversely, if we will get downward breakout, then we will be able to focus purely on downward development.

Daily
Daily picture forbids us to take short position right now. Market is strongly oversold, and already in first day of November has tested MPP. Monthly Pivots stand rather tight in November. Now price has entered in previous consolidation range that coincides with daily K-support and MPP+ MPS1. May be this will turn price up for retracement. Next support will be weekly K-area around 1.3380. That’s being said conclusion here is follows. If you trade on daily chart – sit on your hand and wait for upward bounce. If you trade on intraday charts – that situation could become a chance for scalp long trade as soon as market will form any upward reversal pattern there.

4-hour
Well guys, this picture is almost a clone of Friday’s one. Market is going and going... and going. All that we can do here is wait some reversal pattern for making an attempt for scalp buy trade. Thrust is good as on Friday and absolutely suitable for, say, DiNapoli “DRPO Buy” pattern. One of our suggestions stand around possible H&S pattern on daily. Thus, if DRPO will form right now – it’s target of 50% retracement will coincide with the top of left shoulder. From this point of view this will be perfect. Also we have another level around 1.36. It includes WPP and Fib resistance.

Conclusion:
In longer term perspective bearish signs could appear to be stronger than they seem right now and could lead market to serious consequences with ultimate move even to 1.10.
In short-term perspective we can’t enter short, due market deep oversold but also we have not patterns yet for make a scalp long trade. Thus, in the beginning of the week, looks like we have nothing to do but wait…
The technical portion of Sive's analysis owes a great deal to Joe DiNapoli's methods, and uses a number of Joe's proprietary indicators. Please note that Sive's analysis is his own view of the market and is not endorsed by Joe DiNapoli or any related companies.
In today’s discussion of EUR monthly chart I would like to touch really big picture and extended perspectives. First of all, let’s take a look at US Dollar index quarterly chart. Our old members probably remember our long-term analysis that we’ve made in November of 2011. It was based on Gartley’s “222” Buy on quarterly chart and “D” point of downward AB=CD also has created a bullish stop grabber (unfortunately I can’t plot MACDP on this chart), that suggests taking out tops around 89 level. On previous week many technical analysts have pointed on possible reverse H&S pattern (Lolly Tripathy has posted it on our forum) and in general, as you can see – dollar index strongly holds above lows of 2008 and 2011 and now stands in tight range with small upward angle. Any consolidation usually leads to fast exit. As we can see our setup is still valid. Besides, if market will show action that we’ve suggested, this could lead to appearing of reverse H&S on quarterly chart since 90’s level could be treated as neckline (use your imagination). So, in long term perspective, at least currently, as we do not have reasons to thing opposite, - USD is bullish.
Fundamental rumors after FOMC meeting tell that Fed Reserve feels more and more pressure as it holds QE program. Corporate profits and results do not improve and only blind one do not see buble on stock market and on real estate market. Thus, if even they will not see desirable levels on unemployment (below 6.5%) and inflation (~2%), they do not see positive results of QE either. As time will passing by, Fed will strongly and strongy feel preasure of future risks and hazard on uncontrolled inflation. They probably anyway will have to close QE. They probably already feel this pressure. Thus, stopping of B85$ inflow will lead to buble blow on stock market and this will lead to another financial market crisis. Probably this will not be economy crisis, but mostly financial markets only. Still, this will be period of turmoil and analysis already start to talk about increasing demand for USD in long-term perspective as safe-haven asset for future collapse. May be this jump that we expect to see on USDX will coincide with collapse on stock market, who knows. But technically and fundamentally dollar now looks more bullish rather than bearish.

And now let’s take look at monthly time frame through the prism of quarterly USDX picture. Current reversal or whatever it is, - what is it? At first glance and by looking just at monthly chart we can say – “well, market has hit resistance and Agreement, minor bounce is possible in this case”. Indeed, market has touched 0.618 AB=CD target right at Fib resistance. In this case retracement to 1.32-1.33 area will not be look as curious. Trend holds bullish still. But honestly speaking guys, I’m a bit worring for EUR perspectives here, because something tells me that another picture has more weight right now. And here is how it looks like:
From perspective of quarterly chart, we could get “222” Sell pattern right from rock hard resistance – major 5/8 Fib level+Agreement and Yearly Pivot resistance 1. Take a look at AB-CD itself. CD leg is rather weak, especially it has become slow down even prior minor 0.618 target. This tells that upward momentum is not strong. CD leg itself is rather choppy with a lot of pullbacks. Currently we have October “Shooting star” pattern that simulteniously looks like W&R on previous swing high. This pattern suggests too deep retracement down that will be not acceptable for breakout of previous tops. And finally, we now that Pivot Resistance 1 holds retracement up if downward trend is still valid, right? That is what we see now. If you will draw trend lines, you’ll see that in fact, price action since April 2012 looks like rising wedge pattern. If we’re correct with our view, appearing of “222” Sell will lead price at minimum to 1.1950-1.20 area, it’s minor 0.618 extension. Now you can imagine where we could get if this will be Butterfly “Buy”, that we’ve discussed in previous research, dedicated to EUR. That’s right – 1.10. May be this is too pessimistic issue for EUR, and too far view, but anyway, right now I do not see valuable signs of EUR strength.

Weekly
Trend holds bullish here. At the first glance past week’s plunge looks awful, but, guys – it holds harmonic distance! Take a look – swings up are equal to each other, and retracement down are also equal. Although recent swing up lasts 1 week longer, while recent plunge was 1 week faster than previous one...
But overall picture does not wake on long entry. Price action still gives us solid bearish engulfing pattern, that actually engulfs 2 weeks. Next support here is 1.3380-1.3420 weekly K-support that also includes previous peaks.
What risks are exist for short-term bearish plan? First is butterfly. Market has not reached yet 1.27 extension around 1.3966 and market still stands at the edge by far, when move up is still possible, at least theoretically. Our forum member Minimax also has posted his analysis on EUR and he thinks that splash up before final downward reversal is still possible. Thus, his fractal and EW analysis also suggests some motion that stands in a row with possible butterfly finalizing. Second risk is stop grabber. On next week market will fluctuate with weekly MACDP. If grabber will be formed, then this will be the pattern that we will have to take into consideration. This also could encrease chances on another upward move. It means that if we want to take short position – we have to do this as closer to 1.3830 area as possible and then monitor breakout of 1.3460-1.3480 level. This kind of action should give us room and chance to loose nothing, even if upward action will follow. Conversely, if we will get downward breakout, then we will be able to focus purely on downward development.

Daily
Daily picture forbids us to take short position right now. Market is strongly oversold, and already in first day of November has tested MPP. Monthly Pivots stand rather tight in November. Now price has entered in previous consolidation range that coincides with daily K-support and MPP+ MPS1. May be this will turn price up for retracement. Next support will be weekly K-area around 1.3380. That’s being said conclusion here is follows. If you trade on daily chart – sit on your hand and wait for upward bounce. If you trade on intraday charts – that situation could become a chance for scalp long trade as soon as market will form any upward reversal pattern there.

4-hour
Well guys, this picture is almost a clone of Friday’s one. Market is going and going... and going. All that we can do here is wait some reversal pattern for making an attempt for scalp buy trade. Thrust is good as on Friday and absolutely suitable for, say, DiNapoli “DRPO Buy” pattern. One of our suggestions stand around possible H&S pattern on daily. Thus, if DRPO will form right now – it’s target of 50% retracement will coincide with the top of left shoulder. From this point of view this will be perfect. Also we have another level around 1.36. It includes WPP and Fib resistance.

Conclusion:
In longer term perspective bearish signs could appear to be stronger than they seem right now and could lead market to serious consequences with ultimate move even to 1.10.
In short-term perspective we can’t enter short, due market deep oversold but also we have not patterns yet for make a scalp long trade. Thus, in the beginning of the week, looks like we have nothing to do but wait…
The technical portion of Sive's analysis owes a great deal to Joe DiNapoli's methods, and uses a number of Joe's proprietary indicators. Please note that Sive's analysis is his own view of the market and is not endorsed by Joe DiNapoli or any related companies.


