Sive Morten
Special Consultant to the FPA
- Messages
- 18,670
Fundamentals
(Reuters) The euro recovered from a nine-day low against the U.S. dollar on Friday on reduced concerns surrounding Deutsche Bank's health, while the greater calm over Germany's biggest lender pressured the safe-haven yen and Swiss franc.
Deutsche Bank's U.S.-listed shares were last up nearly 15 percent after touching record lows on Thursday. The immediate cause of the Deutsche crisis is a fine, disputed by the bank, of up to $14 billion by the U.S. Department of Justice over its sale of mortgage-backed securities.
An AFP news agency report that the bank was nearing a cut-price settlement of $5.4 billion helped the euro recover after the currency fell to a nine-day low of $1.1153 around the start of the U.S. trading session.
"There seems to be reduced pessimism at least for the outlook for Deutsche," said Shaun Osborne, chief FX strategist, at Scotiabank in Toronto. He said the euro was finding strong demand between $1.1150 and $1.1160.
The euro was on track to gain about 0.8 percent in September to notch its best month in six and rise 1.2 percent for the third quarter after losing 2.4 percent in the second quarter.
The dollar was last up 0.34 percent against the yen at 101.35 yen after hitting a session high of 101.75 yen.
The Japanese currency was still set to gain about 1.8 percent against the dollar for the quarter to notch its third straight quarterly gain. Investors' suspicions that the Bank of Japan had reached a practical limit in stimulus and lost clout in cheapening the yen helped boost the currency over the quarter.
Soothed concerns surrounding Deutsche Bank helped the dollar hit a nine-day high against the safe-haven Swiss franc of 0.9752 franc and reverse Thursday's losses. The dollar was last up 0.49 percent against the franc at 0.9707 after hitting a more than one-month low of 0.9635 on Thursday.
"It is less painful for Deutsche Bank than some people feared," said Axel Merk, president and chief investment officer of Palo Alto, California-based Merk Investments. He cited the greater calm as a key reason for the franc's losses Friday.
The dollar index which measures the greenback against a basket of six major currencies, was last down 0.09 percent at 95.449.
China's yuan was steady against the dollar, and last traded at 6.6745 in the onshore spot market. The yuan will formally become a global reserve currency on Saturday.
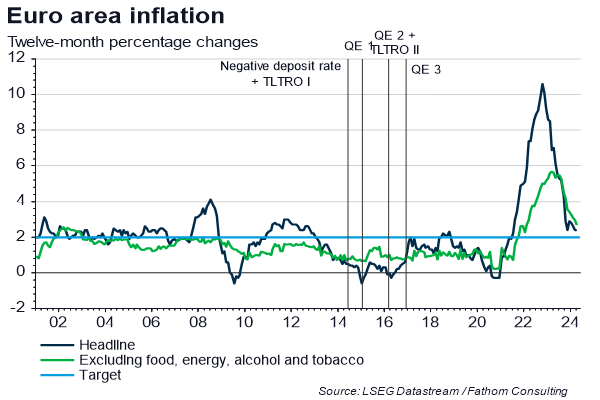
Recent view on EU inflation from Fathom consulting suggests that ECB should act at the end of the year, probably at the same time as Fed will:
Euro area inflation ticks up, but does not change the bigger picture
- Euro area headline consumer price inflation increased to 0.4% in the twelve months to September, up from 0.2% in August, the highest reading since October 2014.
- But more tellingly, core inflation was unchanged at 0.8%, having flatlined since 2014 despite the ECB throwing everything at it, including the kitchen sink.
- Although not as bad as our initial fears, the UK's decision to leave the EU has caused increased uncertainty, which will impact growth and inflation in the currency bloc.
We still see it as inevitable that the ECB will be forced to act before the end of the year, though it will achieve little in our view.
COT Report
Most resent data that was released on Tue shows weak bullish changes. Open interest has increased while net short position has dropped. This tells that traders partially have closed some short and partially have taken new longs.
At the same time these changes are very small, do not have clear tendency and amount of positions' change stands in a row with week-by-week fluctuations. Thus, although theoretically, changes are bullish formally, they have very weak application in real trading by far:

Technical
Monthly
Major picture that we see on the monthly chart is the same - important bearish reversal candle and flag-shaped consolidation within last 3-4 months. This combination doesn't look really bullish for EUR here.
Currently EUR stands at rather strong support area. This is lower border of downward channel and all-time 5/8 Fib support. Here EUR has formed Butterfly "buy" and it has reached first 1.27 extension here. Probably it needs some time to pass through this level and supportive fundamental background of US strength.
EUR is forming typical reversal candle in May. Price has moved above April top and closed below April's lows. It could not get extended continuation, but usually market shows downward continuation within next 1-3 candles.
Sometimes reversal candles lead to collapse, as it was on EUR around 1.40 area. Thrust down has started particularly by reversal candle in March 2014.
Speaking on big scale bearish signs, we have these ones:
EUR was not able to reach YPR1 and returned right back down to YPP. Following this logic next destination could be YPS1 right around parity and 1.618 butterfly target. This is just another destination point that we have here.
Appearing of reversal candle brings nothing good to bulls. Currently we can't precisely forecast the consequences of its appearing, but even minor results will bring some months of downward action inside current 1.04 -1.15 consolidation... Although potential bearish impact could be even stronger.
Finally we have another bearish sign that looks like bearish dynamic pressure. Take a look that although trend holds bullish - market shows inablitity to move up, even from strong support area. Next strong support stands precisely at parity and will become a culmination of downward action, since this level includes support line, YPS1 and butterfly 1.618 target. Brexit results hardly will bring prosperity to EU and probably will become another bearish driving factor for EUR.
Finally expectation of rate hike in US in Dec and continuation in 2017 will make additional pressure on EUR/USD rate in medium-term perspective.
Also take a look at different behavior near low border of channel. Previously when market has touched it - it shows immediate upside pullback, it was V-shape reversal. Right now behavior is absolutely different, price just hangs on the border and shows no upside action. Any tight consolidation near trendline could become a sign of coming breakout.
Thus, based on monthly chart we could make two major conclusions. First is - real bullish trend will be re-established only when EUR will erase reversal candle and overcome its top. Second, if EUR will still keep moderate bearish sentiment, downside potential hardly will be lower than parity, due recent Fed dovish adjustments to its policy for 2017-2018.

Weekly
Last month situation here was mostly "indecision", as market was keeping valid as bullish patterns as some bearish signs that now still exist here. Previously we've talked about it a lot and now I just briefly recall them.
Thus, major support around 1.09 area has not been broken down and this keeps door open for bullish patterns. For example - weekly "222" Buy pattern with 1.16 target.
From the other side, EUR consequently has broken two sloped trend lines. As first line was re-tested after breakout, as second one also has been re-tested 4 weeks ago. In last 4 weeks EUR forms something that reminds bearish dynamic pressure on weekly chart. Trend stands bullish, but price action is not.
Besides overall action from 1.09 low doesn't look like thrust and re-establishing of upside trend. It mostly reminds reaction or respect of some strong support area. From perspectives of AB-CD pattern, this action is too heavy, since EUR even has not reached minor 0.618 extension.
If we suggest that market has formed Double bottom pattern here - current action is also irrational, as EUR has pulled back from neckline and now couldn't return right back up to it.
That's being said, EUR has formed a lot of different hints on patterns in both sides, but all action mostly stands in sideway direction and price doesn't show any meaningful progress neither upside nor downside.
Last week we've got another pattern, but this time it is bullish one. As you can see EUR has formed bullish grabber due drop on Fed statement. This pattern suggests at least 1.1365 top breakout. Invalidation point is the same, our favorite 1.1130 level.
Appearing of this pattern obliges us to not go short, until grabber is valid. Also we have formal reasons even to go long, although I do not like this kind of grabbers, that stand in opposite direction to previous action.
That's being said, on first weekly chart you see the same pattern and it is still valid, since price hasn't dropped below it's low.

But since we've discussed some flaws in so-called "bullish scenario" as well - on next chart I will show you, what could happen, if EUR will drop below 1.11 area and then below 1.09:
Here is one of possible scenarios:

So, as you can see current choice of direction will make impact on long-term perspective and currently EUR stands precisely at red line between them keeping valid patterns for both directions by far. But this will not last forever, especially as we will come closer to Fed December meeting and end of financial year.
Daily
Last two weeks we see stable struggle between bulls and bears in very tight range. Situation was changing every day, although it had no impact on major picture, since no crucial levels were broken. As a result neither side was able to take the lead. Bears were not able to push price through 1.1130 lows, while bulls, despite all efforts, weren't able to push market above at least 1.13 area.
As a result we have almost the same technical picture as last weekend. Again - the bullish grabber and potential patterns that could be formed here. Thus, you probably could recognize possible upside butterflies, but the same patterns could be formed to the downside. This duality is common thing for markets that stand in consolidation and keep valid crucial support and resistance levels.
Still, on Friday EUR was able to move above MPP. Also upside bounce has happened from WPS1 that has held drop down. This sign probably could be treated mostly as bullish in short-term rather than bearish.
On Monday market will open around new October MPP. On daily chart we could make following conclusion. Now shorts yet, longs are possible but taking in consideration the choppiness of action and extreme volatility, stops should be farer, may be even below 1.11-1.1130 area, position value should be reduced. Bullish context is also rather weak and doesn't look fascinating, but at least trend is bullish on weekly and daily charts and bullish grabbers stand on both time frames as well.

4-hour
Here it's time to go back to our triangle pattern that we'are talking about within last 2 weeks as well. It shows only one important detail that we always pay attention to. It's a swings inside triangle. Everything was fine while EUR ping-pong inside of it from border to border. But 5th swing is truncated, i.e. has not reached the bottom of triangle.
Also pay attention how fast upside recovery action was and it has started, as we've said, from WPS1. Also we have small bullish divergence with MACD.
Thus 4-hour chart brings valuable add on to bullish scenario.

Hourly
From perspective of our H&S pattern recent action also difficult to treat as bearish. Take a look, H&S has completed minimal required target as AB=CD based on head and right shoulder. As soon as it was done - fast recovery above neckline and right back to right shoulder's top has followed. This is even more impressive if you will take a look how fast CD leg drop was.
Still despite what bullish signs we have, if you will decide to trade market on long side, your stop probably anyway will be rather far. Recent upside swing simultaneously is truncated swing of triangle and grabber on daily chart. So, for long entry is possible to wait for retracement to one of the Fib levels (may be EUR will choose its favorite 50% again), but initial stop anyway probably will be below the bottom of this swing. Greater volatility forces traders to place farer stops, without no clear information what particular target could be hit. That's why trading whipsawed markets is a tough task.

Conclusion:
Our long-term view mostly bearish for EUR, based on action that it shows around major support and due anticipation of more agressive Fed policy. Bearish view will be valid until market will stand below 1.16 top.
In shorter -term perspective our conclusion stands as follows:
- do not take shorts, until market holds above 1.1130 lows;
- Long position is possible, if you satisfy with background - bullish daily and weekly grabbers, and you're ready to deal with farer stops and whipsaw market.
In general guys, although we have multiple patterns here, but all of them are rather weak, mostly because they are not preceded by strong price action. Such patterns are always weaker.
The technical portion of Sive's analysis owes a great deal to Joe DiNapoli's methods, and uses a number of Joe's proprietary indicators. Please note that Sive's analysis is his own view of the market and is not endorsed by Joe DiNapoli or any related companies.
(Reuters) The euro recovered from a nine-day low against the U.S. dollar on Friday on reduced concerns surrounding Deutsche Bank's health, while the greater calm over Germany's biggest lender pressured the safe-haven yen and Swiss franc.
Deutsche Bank's U.S.-listed shares were last up nearly 15 percent after touching record lows on Thursday. The immediate cause of the Deutsche crisis is a fine, disputed by the bank, of up to $14 billion by the U.S. Department of Justice over its sale of mortgage-backed securities.
An AFP news agency report that the bank was nearing a cut-price settlement of $5.4 billion helped the euro recover after the currency fell to a nine-day low of $1.1153 around the start of the U.S. trading session.
"There seems to be reduced pessimism at least for the outlook for Deutsche," said Shaun Osborne, chief FX strategist, at Scotiabank in Toronto. He said the euro was finding strong demand between $1.1150 and $1.1160.
The euro was on track to gain about 0.8 percent in September to notch its best month in six and rise 1.2 percent for the third quarter after losing 2.4 percent in the second quarter.
The dollar was last up 0.34 percent against the yen at 101.35 yen after hitting a session high of 101.75 yen.
The Japanese currency was still set to gain about 1.8 percent against the dollar for the quarter to notch its third straight quarterly gain. Investors' suspicions that the Bank of Japan had reached a practical limit in stimulus and lost clout in cheapening the yen helped boost the currency over the quarter.
Soothed concerns surrounding Deutsche Bank helped the dollar hit a nine-day high against the safe-haven Swiss franc of 0.9752 franc and reverse Thursday's losses. The dollar was last up 0.49 percent against the franc at 0.9707 after hitting a more than one-month low of 0.9635 on Thursday.
"It is less painful for Deutsche Bank than some people feared," said Axel Merk, president and chief investment officer of Palo Alto, California-based Merk Investments. He cited the greater calm as a key reason for the franc's losses Friday.
The dollar index which measures the greenback against a basket of six major currencies, was last down 0.09 percent at 95.449.
China's yuan was steady against the dollar, and last traded at 6.6745 in the onshore spot market. The yuan will formally become a global reserve currency on Saturday.
Recent view on EU inflation from Fathom consulting suggests that ECB should act at the end of the year, probably at the same time as Fed will:
Euro area inflation ticks up, but does not change the bigger picture
- Euro area headline consumer price inflation increased to 0.4% in the twelve months to September, up from 0.2% in August, the highest reading since October 2014.
- But more tellingly, core inflation was unchanged at 0.8%, having flatlined since 2014 despite the ECB throwing everything at it, including the kitchen sink.
- Although not as bad as our initial fears, the UK's decision to leave the EU has caused increased uncertainty, which will impact growth and inflation in the currency bloc.
We still see it as inevitable that the ECB will be forced to act before the end of the year, though it will achieve little in our view.
COT Report
Most resent data that was released on Tue shows weak bullish changes. Open interest has increased while net short position has dropped. This tells that traders partially have closed some short and partially have taken new longs.
At the same time these changes are very small, do not have clear tendency and amount of positions' change stands in a row with week-by-week fluctuations. Thus, although theoretically, changes are bullish formally, they have very weak application in real trading by far:
Technical
Monthly
Major picture that we see on the monthly chart is the same - important bearish reversal candle and flag-shaped consolidation within last 3-4 months. This combination doesn't look really bullish for EUR here.
Currently EUR stands at rather strong support area. This is lower border of downward channel and all-time 5/8 Fib support. Here EUR has formed Butterfly "buy" and it has reached first 1.27 extension here. Probably it needs some time to pass through this level and supportive fundamental background of US strength.
EUR is forming typical reversal candle in May. Price has moved above April top and closed below April's lows. It could not get extended continuation, but usually market shows downward continuation within next 1-3 candles.
Sometimes reversal candles lead to collapse, as it was on EUR around 1.40 area. Thrust down has started particularly by reversal candle in March 2014.
Speaking on big scale bearish signs, we have these ones:
EUR was not able to reach YPR1 and returned right back down to YPP. Following this logic next destination could be YPS1 right around parity and 1.618 butterfly target. This is just another destination point that we have here.
Appearing of reversal candle brings nothing good to bulls. Currently we can't precisely forecast the consequences of its appearing, but even minor results will bring some months of downward action inside current 1.04 -1.15 consolidation... Although potential bearish impact could be even stronger.
Finally we have another bearish sign that looks like bearish dynamic pressure. Take a look that although trend holds bullish - market shows inablitity to move up, even from strong support area. Next strong support stands precisely at parity and will become a culmination of downward action, since this level includes support line, YPS1 and butterfly 1.618 target. Brexit results hardly will bring prosperity to EU and probably will become another bearish driving factor for EUR.
Finally expectation of rate hike in US in Dec and continuation in 2017 will make additional pressure on EUR/USD rate in medium-term perspective.
Also take a look at different behavior near low border of channel. Previously when market has touched it - it shows immediate upside pullback, it was V-shape reversal. Right now behavior is absolutely different, price just hangs on the border and shows no upside action. Any tight consolidation near trendline could become a sign of coming breakout.
Thus, based on monthly chart we could make two major conclusions. First is - real bullish trend will be re-established only when EUR will erase reversal candle and overcome its top. Second, if EUR will still keep moderate bearish sentiment, downside potential hardly will be lower than parity, due recent Fed dovish adjustments to its policy for 2017-2018.
Weekly
Last month situation here was mostly "indecision", as market was keeping valid as bullish patterns as some bearish signs that now still exist here. Previously we've talked about it a lot and now I just briefly recall them.
Thus, major support around 1.09 area has not been broken down and this keeps door open for bullish patterns. For example - weekly "222" Buy pattern with 1.16 target.
From the other side, EUR consequently has broken two sloped trend lines. As first line was re-tested after breakout, as second one also has been re-tested 4 weeks ago. In last 4 weeks EUR forms something that reminds bearish dynamic pressure on weekly chart. Trend stands bullish, but price action is not.
Besides overall action from 1.09 low doesn't look like thrust and re-establishing of upside trend. It mostly reminds reaction or respect of some strong support area. From perspectives of AB-CD pattern, this action is too heavy, since EUR even has not reached minor 0.618 extension.
If we suggest that market has formed Double bottom pattern here - current action is also irrational, as EUR has pulled back from neckline and now couldn't return right back up to it.
That's being said, EUR has formed a lot of different hints on patterns in both sides, but all action mostly stands in sideway direction and price doesn't show any meaningful progress neither upside nor downside.
Last week we've got another pattern, but this time it is bullish one. As you can see EUR has formed bullish grabber due drop on Fed statement. This pattern suggests at least 1.1365 top breakout. Invalidation point is the same, our favorite 1.1130 level.
Appearing of this pattern obliges us to not go short, until grabber is valid. Also we have formal reasons even to go long, although I do not like this kind of grabbers, that stand in opposite direction to previous action.
That's being said, on first weekly chart you see the same pattern and it is still valid, since price hasn't dropped below it's low.
But since we've discussed some flaws in so-called "bullish scenario" as well - on next chart I will show you, what could happen, if EUR will drop below 1.11 area and then below 1.09:
Here is one of possible scenarios:
So, as you can see current choice of direction will make impact on long-term perspective and currently EUR stands precisely at red line between them keeping valid patterns for both directions by far. But this will not last forever, especially as we will come closer to Fed December meeting and end of financial year.
Daily
Last two weeks we see stable struggle between bulls and bears in very tight range. Situation was changing every day, although it had no impact on major picture, since no crucial levels were broken. As a result neither side was able to take the lead. Bears were not able to push price through 1.1130 lows, while bulls, despite all efforts, weren't able to push market above at least 1.13 area.
As a result we have almost the same technical picture as last weekend. Again - the bullish grabber and potential patterns that could be formed here. Thus, you probably could recognize possible upside butterflies, but the same patterns could be formed to the downside. This duality is common thing for markets that stand in consolidation and keep valid crucial support and resistance levels.
Still, on Friday EUR was able to move above MPP. Also upside bounce has happened from WPS1 that has held drop down. This sign probably could be treated mostly as bullish in short-term rather than bearish.
On Monday market will open around new October MPP. On daily chart we could make following conclusion. Now shorts yet, longs are possible but taking in consideration the choppiness of action and extreme volatility, stops should be farer, may be even below 1.11-1.1130 area, position value should be reduced. Bullish context is also rather weak and doesn't look fascinating, but at least trend is bullish on weekly and daily charts and bullish grabbers stand on both time frames as well.
4-hour
Here it's time to go back to our triangle pattern that we'are talking about within last 2 weeks as well. It shows only one important detail that we always pay attention to. It's a swings inside triangle. Everything was fine while EUR ping-pong inside of it from border to border. But 5th swing is truncated, i.e. has not reached the bottom of triangle.
Also pay attention how fast upside recovery action was and it has started, as we've said, from WPS1. Also we have small bullish divergence with MACD.
Thus 4-hour chart brings valuable add on to bullish scenario.
Hourly
From perspective of our H&S pattern recent action also difficult to treat as bearish. Take a look, H&S has completed minimal required target as AB=CD based on head and right shoulder. As soon as it was done - fast recovery above neckline and right back to right shoulder's top has followed. This is even more impressive if you will take a look how fast CD leg drop was.
Still despite what bullish signs we have, if you will decide to trade market on long side, your stop probably anyway will be rather far. Recent upside swing simultaneously is truncated swing of triangle and grabber on daily chart. So, for long entry is possible to wait for retracement to one of the Fib levels (may be EUR will choose its favorite 50% again), but initial stop anyway probably will be below the bottom of this swing. Greater volatility forces traders to place farer stops, without no clear information what particular target could be hit. That's why trading whipsawed markets is a tough task.
Conclusion:
Our long-term view mostly bearish for EUR, based on action that it shows around major support and due anticipation of more agressive Fed policy. Bearish view will be valid until market will stand below 1.16 top.
In shorter -term perspective our conclusion stands as follows:
- do not take shorts, until market holds above 1.1130 lows;
- Long position is possible, if you satisfy with background - bullish daily and weekly grabbers, and you're ready to deal with farer stops and whipsaw market.
In general guys, although we have multiple patterns here, but all of them are rather weak, mostly because they are not preceded by strong price action. Such patterns are always weaker.
The technical portion of Sive's analysis owes a great deal to Joe DiNapoli's methods, and uses a number of Joe's proprietary indicators. Please note that Sive's analysis is his own view of the market and is not endorsed by Joe DiNapoli or any related companies.