Sive Morten
Special Consultant to the FPA
- Messages
- 18,760
Monthly
Weekly FX Tading Report prepared by Sive Morten exclusively for ForexPeaceArmy.com
According to Reuters news U.S. dollar edged higher against a basket of major currencies on Friday after strong U.S. consumer sentiment data calmed nerves at the end of a week of severe market volatility.
The Thomson Reuters/University of Michigan preliminary October reading on the overall index on consumer sentiment unexpectedly rose to 86.4, the highest since July 2007.
The data eased concerns after worries surrounding the health of the global economy shook stocks, bonds and currencies markets this week. The dollar hit three-week lows against the euro and Swiss franc and a more than one-month low against the yen on Wednesday.
"The market sold aggressively throughout the week, and now is thinking maybe they had taken this too far," said Jose Wynne, global head of FX research at Barclays in New York. He said Barclays still recommended buying the dollar.
He said the strong U.S. data on consumer sentiment was a catalyst for the dollar's move higher, but that currencies broadly could face more volatility as traders await comments from the U.S. Federal Reserve and the European Central Bank on monetary policy.
The dollar gained slightly earlier in the session on greater stability in oil, stocks, and Treasuries markets. Despite Friday's gain, the benchmark U.S. S&P 500 stock index was still on track for its fourth straight weekly decline, its longest streak in more than three years.
"Because we had the recovery in U.S. stocks, we're seeing some of the easing of risk aversion contribute to the strength of the dollar against the yen," said Kathy Lien, managing director at New York's BK Asset Management.
Commerce Department data earlier in the session showing U.S. housing starts and permits rose in September had little impact on the dollar. Traders also shrugged off comments from Federal Reserve Chair Janet Yellen on the growth of U.S. economic inequality.
Recent CFTC report in general shows the same information as week before – no significant jump in long positions. Total open interest has dropped after Scotland referendum and investors has lost interest to GBP that was not re-established yet on initial trading volumes. This information doesn’t confirm that action to 1.67 area could start right now and doesn’t exclude possible lower action to next support.
Non-Commercial Shorts:

Non-Commercial Longs:

Open Interest:

As you know CFTC also prepares “legacy” report, that is a newer version and it shows not just “non-commercial” positions, but “asset-managers/Institutional”. Thus, this chart shows solid increase of short positions within previous 3 weeks – right after Scotland voting.
Asset managers/Institutional shorts:

As on previous week – we warned you on possible deeper drop due to this data (that has happened), and again, we have to express some suspicious on current rally on cable, because market data does not show any solid increase in demand.
Technical
Again – research on GBP.
As we’ve said on previous week, Scotland referendum has made an impact and adjusted normal market’s behavior. Right now USD grow also presses on market. As political turmoil has gone to history market will try to correct the skew that was made by political impact. This in turn, could give us promising setups on different time scales. At the same time we agree that setups that we will discuss today mostly tactical, although they could last for considerable period of time. Also we understand that Scotland’s referendum has changed political sentiment and will lead to changes in domestic political process. The fact that political reasons were existed for referendum and referendum itself has happened – already is negative for Kingdom currency. That’s why we are not count that GBP will return soon at the same top as it was before referendum. You can see big drop in open interest before referendum – that was exit of big players, out from cable. It needs time to bring them back.
First of all take a look at long-term GBP chart. Here is long time 1.70-1.71 natural support/resistance area. Recall that before shadow of referendum has risen upon Great Britain – pound sterling was on nice upward march. BoE was at the eve of rate hiking and this has led to tremendous upside rally. In general market moves north longer than a whole year and has reached 1.70-1.71. This was our major resistance area where we thought that something should happen around and it did:
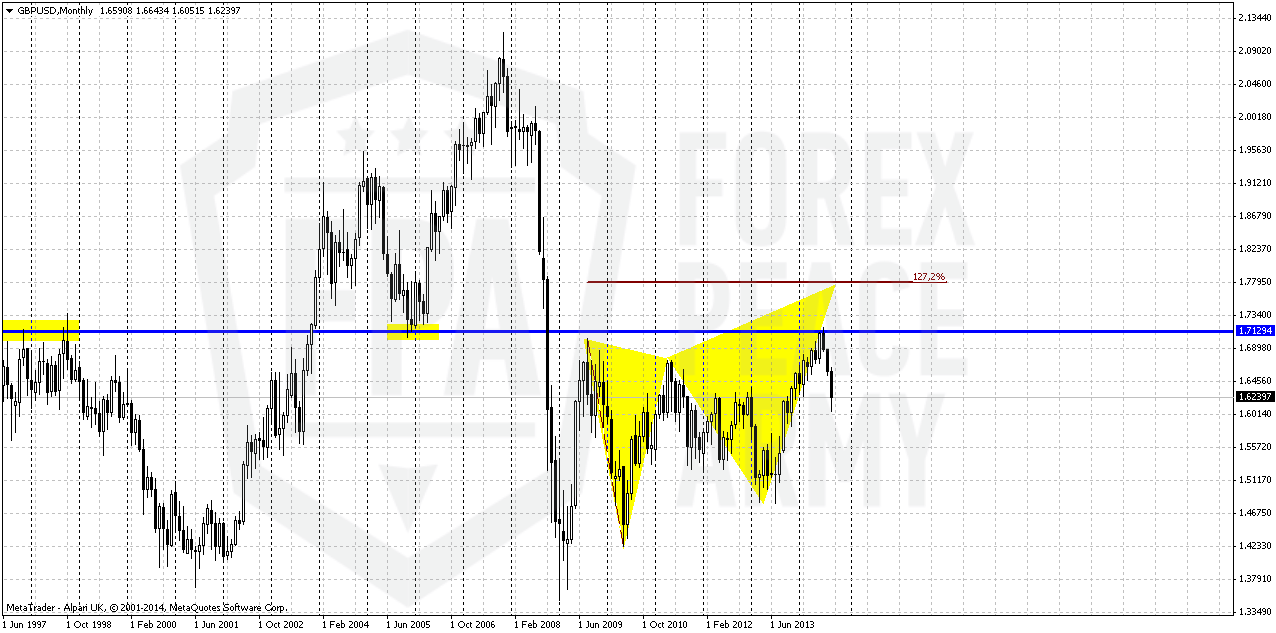
Rumors around Scotland voting have not appeared suddenly but previously they weren’t treated seariously as they should to. On autumn of 2014 public opinion surveys start to show that percent of “Yes” voters are not really small and approaches to 50%. And this has started to worry investors, forced them to leave cable and logically has led to negative impact on GB currency.
As political force was eliminated after voting – we see that market logically should return to previous action and at least return some previous looses. Besides, pure technical view suggests existing of previous upside momentum that has not dissapeared but was temporally muted by political mess. This leads to appearing of monthly DiNapoli B&B “Buy” setup, as it is shown no second chart:

In the beginning of the year market has tested YPR1 and now stands at YPP. So, we have not just 50% Fib support. And by result of previous week we see that YPP has suported market and led it to bounce higher.
According to B&B rules market has to reach some significant Fib support level within 3 periods of closing below 3x3 DMA. Although we previously expected that B&B has chances to start from 3/8 Fib support, but this has not happened. But following to rules – market can start B&B as from 50% Fib level as from 5/8.The major condition - this level has to be reached within 3 periods after 3x3 DMA has been crossed. And you can see that October is a third period. Hence – we know that B&B will start in October, but we do not know from which level – 50% or 5/8. Right now GBP stands at 50% support. As we’ve find out existing of YPP – situation has changed and chances on upward action right from here increases.
The target of this pattern is 5/8 Fib resistance of total move down after thrust up. As you will see later - right now this is 1.6717 area.
Although B&B is very reliable pattern because it is based not on some trader’s view or opinion or some men-invented patterns, but on real market mechanics, sometimes it still could fail. That’s why reaching of strong support and completion of other conditions are not enough to take position. Since this is monthly pattern – upward action should be visible on lower time frames and probably should start from some clear upside reversal pattern on daily chart. Advantage of this one B&B stands also with its political background – there was a “problem” that now is mostly gone, although some consequences probably will remain. Anyway this should let market to return previous positions, at least partially and 5/8 upside retracement looks really as a mite and rather realistic target.
Previously we have been able to verify the need for a reversal pattern. And still we will expect pattern that will let us to step in.
Weekly
On weekly chart trend is bearish. Market is not at oversold anymore. In fact, right now we have simple task – understand from which level B&B will start. Right now here is GBP at MPS1, YPP and 50% support. On previous week we also have got nicely looking bullish hammer pattern. The most important point of this pattern is it’s lows. Until it holds – chances on upward action will exist. As you know, by itself, hammer is reversal pattern and it has appeared on weekly chart. Now support area becomes more and more solid and there are real chances that upside bounce could start somewhere around.

Daily
It seems guys that we stand rather close to the moment of resolving of B&B riddle. Thus, 1.27 Butterfly target has been hit finally last week. We’ve got nicely looking bullish divergence right at rock hard weekly support area. Trend has turned bullish here. Still, as you can see market still follow “2-step forward, 1-step back” pattern, as downward action continues. That’s why we will keep close eye on this trend line down. Breakout through this line could become first bell of coming reversal. Besides, recently market has turned to formation of wedge pattern, as volatility has increased and this also could be sign of possible changes. Pace of downward action has decreased.

4-hour
So, guys, on coming week we will check possible reversal. Since chances on downward continuation still hold and CFTC data does not look impressive for bulls – do not treat picture below as “must happen” scenario. This picture just shows what could happen if reversal really will come. I do not know what do you see guys, on 4-hour chart, but for me H&S pattern seems as most probable. Besides, it is accompanied by butterfly and this pattern very often becomes a part of H&S. There is one thing that I do not like here – is choppy and unstable upside action, although on Friday there were more signs of thrust have appeared.
So, first we need to watch – whether market will reach WPR1 that coinsides with neckline. After that we will wait for retracement down to right shoulder bottom. This will be our major point where we think about taking long position. Simultaneously this will be retracement back in the body of weekly hammer.
Alternative scenario is 3-Drive “buy” pattern but it suggests failure of weekly hammer and deeper downward action to next weekly support area. This scenario is also probable due some reasons as we’ve said above – but we’ve discussed it in details on previous week.

1-hour
On hourly chart 1.618 AB=CD target coincides with neckline of our potential H&S pattern and WPR1. At the same time market is forming something, that looks like bullish dynamic pressure. Trend has turned bearish, but price continues to creep higher and forms higher lows. Usually this leads to upside breakout. Besides price here stands above 100% AB-CD target. If this upside action will fail – this could mean that market could turn to creation of 3-Drive “buy” pattern instead of H&S.

Conclusion:
So, we are tempted by appetite setup on monthly chart of GBP that looks promising, at least right now. Since this pattern is forming on big picture – it could lasts for weeks and particularly by this reason it looks attractive. Currently we’ve estimated the target of this pattern at 1.6717
In shorter-term perspective we will be watch for two major moments – breakout of downward line and breaking of downside tendency. Second – some clear reversal pattern. Right now H&S or 3-Drive look as most probable to get. Which one will prevail will depend on action around 1.5960 area. If market will fail to hold there and above WPS1 – we will see deeper downward action.
The technical portion of Sive's analysis owes a great deal to Joe DiNapoli's methods, and uses a number of Joe's proprietary indicators. Please note that Sive's analysis is his own view of the market and is not endorsed by Joe DiNapoli or any related companies.
Weekly FX Tading Report prepared by Sive Morten exclusively for ForexPeaceArmy.com
According to Reuters news U.S. dollar edged higher against a basket of major currencies on Friday after strong U.S. consumer sentiment data calmed nerves at the end of a week of severe market volatility.
The Thomson Reuters/University of Michigan preliminary October reading on the overall index on consumer sentiment unexpectedly rose to 86.4, the highest since July 2007.
The data eased concerns after worries surrounding the health of the global economy shook stocks, bonds and currencies markets this week. The dollar hit three-week lows against the euro and Swiss franc and a more than one-month low against the yen on Wednesday.
"The market sold aggressively throughout the week, and now is thinking maybe they had taken this too far," said Jose Wynne, global head of FX research at Barclays in New York. He said Barclays still recommended buying the dollar.
He said the strong U.S. data on consumer sentiment was a catalyst for the dollar's move higher, but that currencies broadly could face more volatility as traders await comments from the U.S. Federal Reserve and the European Central Bank on monetary policy.
The dollar gained slightly earlier in the session on greater stability in oil, stocks, and Treasuries markets. Despite Friday's gain, the benchmark U.S. S&P 500 stock index was still on track for its fourth straight weekly decline, its longest streak in more than three years.
"Because we had the recovery in U.S. stocks, we're seeing some of the easing of risk aversion contribute to the strength of the dollar against the yen," said Kathy Lien, managing director at New York's BK Asset Management.
Commerce Department data earlier in the session showing U.S. housing starts and permits rose in September had little impact on the dollar. Traders also shrugged off comments from Federal Reserve Chair Janet Yellen on the growth of U.S. economic inequality.
Recent CFTC report in general shows the same information as week before – no significant jump in long positions. Total open interest has dropped after Scotland referendum and investors has lost interest to GBP that was not re-established yet on initial trading volumes. This information doesn’t confirm that action to 1.67 area could start right now and doesn’t exclude possible lower action to next support.
Non-Commercial Shorts:
Non-Commercial Longs:
Open Interest:
As you know CFTC also prepares “legacy” report, that is a newer version and it shows not just “non-commercial” positions, but “asset-managers/Institutional”. Thus, this chart shows solid increase of short positions within previous 3 weeks – right after Scotland voting.
Asset managers/Institutional shorts:
As on previous week – we warned you on possible deeper drop due to this data (that has happened), and again, we have to express some suspicious on current rally on cable, because market data does not show any solid increase in demand.
Technical
Again – research on GBP.
As we’ve said on previous week, Scotland referendum has made an impact and adjusted normal market’s behavior. Right now USD grow also presses on market. As political turmoil has gone to history market will try to correct the skew that was made by political impact. This in turn, could give us promising setups on different time scales. At the same time we agree that setups that we will discuss today mostly tactical, although they could last for considerable period of time. Also we understand that Scotland’s referendum has changed political sentiment and will lead to changes in domestic political process. The fact that political reasons were existed for referendum and referendum itself has happened – already is negative for Kingdom currency. That’s why we are not count that GBP will return soon at the same top as it was before referendum. You can see big drop in open interest before referendum – that was exit of big players, out from cable. It needs time to bring them back.
First of all take a look at long-term GBP chart. Here is long time 1.70-1.71 natural support/resistance area. Recall that before shadow of referendum has risen upon Great Britain – pound sterling was on nice upward march. BoE was at the eve of rate hiking and this has led to tremendous upside rally. In general market moves north longer than a whole year and has reached 1.70-1.71. This was our major resistance area where we thought that something should happen around and it did:
Rumors around Scotland voting have not appeared suddenly but previously they weren’t treated seariously as they should to. On autumn of 2014 public opinion surveys start to show that percent of “Yes” voters are not really small and approaches to 50%. And this has started to worry investors, forced them to leave cable and logically has led to negative impact on GB currency.
As political force was eliminated after voting – we see that market logically should return to previous action and at least return some previous looses. Besides, pure technical view suggests existing of previous upside momentum that has not dissapeared but was temporally muted by political mess. This leads to appearing of monthly DiNapoli B&B “Buy” setup, as it is shown no second chart:
In the beginning of the year market has tested YPR1 and now stands at YPP. So, we have not just 50% Fib support. And by result of previous week we see that YPP has suported market and led it to bounce higher.
According to B&B rules market has to reach some significant Fib support level within 3 periods of closing below 3x3 DMA. Although we previously expected that B&B has chances to start from 3/8 Fib support, but this has not happened. But following to rules – market can start B&B as from 50% Fib level as from 5/8.The major condition - this level has to be reached within 3 periods after 3x3 DMA has been crossed. And you can see that October is a third period. Hence – we know that B&B will start in October, but we do not know from which level – 50% or 5/8. Right now GBP stands at 50% support. As we’ve find out existing of YPP – situation has changed and chances on upward action right from here increases.
The target of this pattern is 5/8 Fib resistance of total move down after thrust up. As you will see later - right now this is 1.6717 area.
Although B&B is very reliable pattern because it is based not on some trader’s view or opinion or some men-invented patterns, but on real market mechanics, sometimes it still could fail. That’s why reaching of strong support and completion of other conditions are not enough to take position. Since this is monthly pattern – upward action should be visible on lower time frames and probably should start from some clear upside reversal pattern on daily chart. Advantage of this one B&B stands also with its political background – there was a “problem” that now is mostly gone, although some consequences probably will remain. Anyway this should let market to return previous positions, at least partially and 5/8 upside retracement looks really as a mite and rather realistic target.
Previously we have been able to verify the need for a reversal pattern. And still we will expect pattern that will let us to step in.
Weekly
On weekly chart trend is bearish. Market is not at oversold anymore. In fact, right now we have simple task – understand from which level B&B will start. Right now here is GBP at MPS1, YPP and 50% support. On previous week we also have got nicely looking bullish hammer pattern. The most important point of this pattern is it’s lows. Until it holds – chances on upward action will exist. As you know, by itself, hammer is reversal pattern and it has appeared on weekly chart. Now support area becomes more and more solid and there are real chances that upside bounce could start somewhere around.
Daily
It seems guys that we stand rather close to the moment of resolving of B&B riddle. Thus, 1.27 Butterfly target has been hit finally last week. We’ve got nicely looking bullish divergence right at rock hard weekly support area. Trend has turned bullish here. Still, as you can see market still follow “2-step forward, 1-step back” pattern, as downward action continues. That’s why we will keep close eye on this trend line down. Breakout through this line could become first bell of coming reversal. Besides, recently market has turned to formation of wedge pattern, as volatility has increased and this also could be sign of possible changes. Pace of downward action has decreased.
4-hour
So, guys, on coming week we will check possible reversal. Since chances on downward continuation still hold and CFTC data does not look impressive for bulls – do not treat picture below as “must happen” scenario. This picture just shows what could happen if reversal really will come. I do not know what do you see guys, on 4-hour chart, but for me H&S pattern seems as most probable. Besides, it is accompanied by butterfly and this pattern very often becomes a part of H&S. There is one thing that I do not like here – is choppy and unstable upside action, although on Friday there were more signs of thrust have appeared.
So, first we need to watch – whether market will reach WPR1 that coinsides with neckline. After that we will wait for retracement down to right shoulder bottom. This will be our major point where we think about taking long position. Simultaneously this will be retracement back in the body of weekly hammer.
Alternative scenario is 3-Drive “buy” pattern but it suggests failure of weekly hammer and deeper downward action to next weekly support area. This scenario is also probable due some reasons as we’ve said above – but we’ve discussed it in details on previous week.
1-hour
On hourly chart 1.618 AB=CD target coincides with neckline of our potential H&S pattern and WPR1. At the same time market is forming something, that looks like bullish dynamic pressure. Trend has turned bearish, but price continues to creep higher and forms higher lows. Usually this leads to upside breakout. Besides price here stands above 100% AB-CD target. If this upside action will fail – this could mean that market could turn to creation of 3-Drive “buy” pattern instead of H&S.
Conclusion:
So, we are tempted by appetite setup on monthly chart of GBP that looks promising, at least right now. Since this pattern is forming on big picture – it could lasts for weeks and particularly by this reason it looks attractive. Currently we’ve estimated the target of this pattern at 1.6717
In shorter-term perspective we will be watch for two major moments – breakout of downward line and breaking of downside tendency. Second – some clear reversal pattern. Right now H&S or 3-Drive look as most probable to get. Which one will prevail will depend on action around 1.5960 area. If market will fail to hold there and above WPS1 – we will see deeper downward action.
The technical portion of Sive's analysis owes a great deal to Joe DiNapoli's methods, and uses a number of Joe's proprietary indicators. Please note that Sive's analysis is his own view of the market and is not endorsed by Joe DiNapoli or any related companies.


")


