FOREX PRO Weekly September 17-21, 2012

yes the damn builders in!!
Asif

Hi Buddy,
welcome back (I've started to think already, where are you dissapear?)

In Russia we say: Refurbishment is not just a process - it's a state of mind :)

Here is imossible to finish refurbishment as you've planed...
 
Hi Buddy,
welcome back (I've started to think already, where are you dissapear?)

In Russia we say: Refurbishment is not just a process - it's a state of mind :)

Here is imossible to finish refurbishment as you've planed...

Hi Sive :)

I think in Cyprus its the same lol as was to be finished a few months ago..
Sive as always your and Felixs services are so valuable to traders new and old...

Been great work but as you have said from a while the Euro is entering some choppy indecision so waiting for some clear trend direction..

Lots of best wishes to you and your Family and Felix. :))
 
Hey Sive,

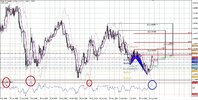
I've got a problem with my weekly chart. Please refer to your first post of this thread, the weekly TF picture that you posted. As you can see, market has hit OB on your weekly chart but please refer to my attachment below. As you can see, my DOSC is still quite a ways from OB. The values I used were the three tops: 969.66, 786.00, 717.15.

I added all three values and divided them and then took 90% of it and got 741.

As you can see, the strong up move from last week got as high as 556.459 (blue circle). This is not even close to the 741 that I got, yet on your chart it shows weekly OB.

Am I missing something? Did I take the wrong three tops? How come your weekly chart says market is at weekly overbought while my chart does not?

Thanks a lot, Sive. I greatly appreciate your daily analysis and definitely appreciate the time you take to answer my questions.

Cheers!

weeklyob.jpg
 
Last edited:
Hi Sive,
What are the chances to obtain the custom Dosc that you have ploted on your MT4 platform? I know it belongs to one of the forumers Kamuta,if I am not mistaken! If is it for sale I would like to purchase it, as I am not a programmer. Thanks!
Hey Sive,

I've got a problem with my weekly chart. Please refer to your first post of this thread, the weekly TF picture that you posted. As you can see, market has hit OB on your weekly chart but please refer to my attachment below. As you can see, my DOSC is still quite a ways from OB. The values I used were the three tops: 969.66, 786.00, 717.15.

I added all three values and divided them and then took 90% of it and got 741.

As you can see, the strong up move from last week got as high as 556.459 (blue circle). This is not even close to the 741 that I got, yet on your chart it shows weekly OB.

Am I missing something? Did I take the wrong three tops? How come your weekly chart says market is at weekly overbought while my chart does not?

Thanks a lot, Sive. I greatly appreciate your daily analysis and definitely appreciate the time you take to answer my questions.

Cheers!

View attachment 6655
 
Last edited:
Hey Sive,

I've got a problem with my weekly chart. Please refer to your first post of this thread, the weekly TF picture that you posted. As you can see, market has hit OB on your weekly chart but please refer to my attachment below. As you can see, my DOSC is still quite a ways from OB. The values I used were the three tops: 969.66, 786.00, 717.15.

I added all three values and divided them and then took 90% of it and got 741.

As you can see, the strong up move from last week got as high as 556.459 (blue circle). This is not even close to the 741 that I got, yet on your chart it shows weekly OB.

Am I missing something? Did I take the wrong three tops? How come your weekly chart says market is at weekly overbought while my chart does not?

Thanks a lot, Sive. I greatly appreciate your daily analysis and definitely appreciate the time you take to answer my questions.

Cheers!

Hi Beekay,
the difference in number of periods. My Oscillator predictor uses 135 periods, while you apply DOSC to much longer time. So, if I will change number of periods to, say, 500, then, probably I also will not get overbought.
When you apply DOSC, you should not take 3 all-time peaks or bottoms, but 3 highest/lowest peaks/bottoms within some predifined period. Usually this is 4-5 months. Volatility is a subject to change so, it is not quite correct to apply the same value all the time.

Hi Sive,
What are the chances to obtain the custom Dosc that you have ploted on your MT4 platform? I know it belongs to one of the forumers Kamuta,if I am not mistaken! If is it for sale I would like to purchase it, as I am not a programmer. Thanks!

His nick is Kamuta. It does not belong to him, he just can program it. Custom Dosc calls Oscillator predictor, and unfortunately it is forbidden to distribute it at any way, since it is protected by copyright law and was invented by DiNapoli. As well as MACD Predictor.
 
Thanks Sive!Thanks for today`s analysis as well! So we have 3 options on daily- BnB buy,DRPO sell and SG buy!I put my chips on bullish side to play Butterfly sell later on! Will see! Cheers!

BTW we have a nice AB=CD today
 
Hi Ochills,

1. Most common exhausting pattern is a wedge in different forms, 3-Drive pattern, wedge at extension of butterfly, H&S patterns and other.
Much better if this pattern appear near significant Fib level. Also it could be accompanied by divergence, for instance.

2.Well, It is not strongly depends on me, since I'm not a programmer. But I know that work on this project is under way. Do not worry, I suppose there will be loud announce of starting this

3. Indeed, it's not obvious to use it :). On Monday you have to use "-1" parameter but on Tuesday shift it to "0". The same is for Monthly Pivot. If month ends in weekend, then to calculate Pivot for nearest working day you have to use "-1" as well.
HEre is easy way to check the number - plot 1x1 DMA on weekly at HLC/3. This is in fact number of WPP. IT shoud have the same number as indicator shows.


Thanks Commander in pips. I deeply appreciate your help and for answering all questions posted on this forum.
thanks God bless you and your family including all FPA members.
 
guys, i found a nice resource: online TV show with chat so ppl can interact with each other the TV hosts who are all veteran traders, trading live and showing and explaining their charts live. it's fun. check it out:

TFL-TV | Honest market analysis and commentary.

click on the 1st youtube video and it'll take you to the current live show
Thanks for that, looks like another great resource to run along side Sive..

Anyone else participating in the chat?

Sorry to hi-jack Sives thread...its probably annoying for him...apologies..
 
Back
Top