Sive Morten
Special Consultant to the FPA
- Messages
- 18,760
Fundamentals
Gold prices were slightly lower on Friday, paring losses on safe-haven buying as equity markets slid after Ukraine said its forces had engaged a Russian armored column on Ukrainian soil in what appeared to be a major military escalation. Investors bought bullion and U.S. Treasuries after Ukraine said its forces had attacked and partly destroyed a Russian armored column that crossed into Ukrainian territory. Moscow said its forces had not crossed into Ukraine, and accused Kiev of trying to sabotage deliveries of aid.
"The news definitely helps gold reverse higher and shows that gold is very susceptible to geopolitical tensions," said Phillip Streible, senior commodities broker at RJ O'Brien. "When these developments cool, you will see the gold market come right back down."
Earlier in the session, bullion was down more than 1 percent because of weak physical demand, gains in U.S. equities and weak U.S. producer inflation data. But stocks fell after the news from Ukraine, while benchmark 10-year U.S. Treasury bond prices rose.
Technical support could further lift prices after gold breached its 50- and 100-day moving averages following Friday's rally.
In gold investment news, hedge fund Paulson & Co maintained its stake in the world's biggest gold-backed exchange-traded fund, SPDR Gold Trust, in the second quarter, while Soros Fund Management LLC sharply boosted its investment in gold mining stocks.
Among other precious metals, silver was down 1.4 percent at $19.52 an ounce. The silver market entered a new era in benchmarking on Friday after a regulatory drive for more transparency in price setting brought the 117-year-old silver 'fix' to an end.
 CFTC data currently very is important. Most recent data shows solid increase in net long position as well as jump in open interest. Of cause, we do not know, may be this was just due fake information on Russian military forces destruction or this is just single episode - anyway we need to get some graduality in this tendency. But even this single moment shows that new money comes on market on previous week and this is also support factor for our medium term bullish analysis.
Monthly
As we’ve mentioned previously price should pass solid distance to change situation drastically. it could change only if market will move above 1400 area. On current week reason for rally again was suspicious, as we’ve pointed the reason above. Gold right now has tired to wait and catches any more or less valuable news to show action. Still, it is possible that there are some features under curtain that we do not see right now. Because usually solid surge in Open interest and Net long position hardly happens occasionally or just on rumor of geopolitical event that was fastly belied.
Since currently August mostly is an inside month for July our former analysis is still working. Although investors have not got hawkish hints from Fed and recent NFP data was slightly lower than analysts poll, major factors are still valid - good economy data, that right now is confirmed by US companies earning reports, weak physical demand – all these moments prevent gold appreciation. At the same time there are two factors that could support gold soon – seasonal trend, geopolitical tensions. And in general, guys, current level are not bad in general for partial long-term purchases. This thought is confirmed by Soros fund that has increased investing in gold shares. Besides, US data is a subject to change. Currently it looks good, let’s see on Fed minutes and Jackson Hole meeting. But appearing of signs of inflation could add fuel to gold.
Bearish grabber pattern is important, but June, and especially July has blocked gradual downward action and white candles break the bearish harmony of recent action. Next upside important level is 1360 – Yearly pivot point. If market will move above it – this could be an indication that gold will continue move higher and this really could become a breaking moment on gold market. Otherwise, grabber will be valid and potentially could lead price back at least to 1180 lows again.
That’s being said, situation on the monthly chart does not suggest yet taking long-term positions on gold. Still, fundamental picture is moderately bearish in long-term. Possible sanctions from EU and US could hurt their own economies (especially EU). Many analysts already have started to talk about it. It means that economies will start to loose upside momentum and inflation will remain anemic. In such situations investors mostly invest in interest-bear assets, such as bonds. Inflation also will be depressed and this is negative sign for gold. At the same time we do not want to say that situation is cloudless for bears, absolutely not. Especially due to the pattern that we’ve got on weekly chart…

Weekly
Although monthly picture is moderately bearish and market needs to exceed 1400 to change it, but in medium-term perspective market mostly bullish, at least due patterns that we have on weekly chart. In general analysis is the same and has become even stronger since we’ve got another bullish grabber. Thus we have 3 weekly grabbers in a row.
Weekly chart is a goldmine of potential patterns. Minimum target of grabbers stands above 1350 area, very close to YPP ~ 1360. Trend is bullish here as on monthly chart. Possible success of grabber has very important meaning for strategic picture. Recall that previously we’ve discussed weekly bearish AB=CD and 1250 lows is 0.618 target. Recent upward move to 1345 area could be treated as retracement and then market re-established downward action. But if right now grabbers will work – market will have to return right back up again and this contradicts to normal bearish development. This could really shift medium term sentiment to bullish. To keep bearish setup – price should erase grabbers and move below its lows.
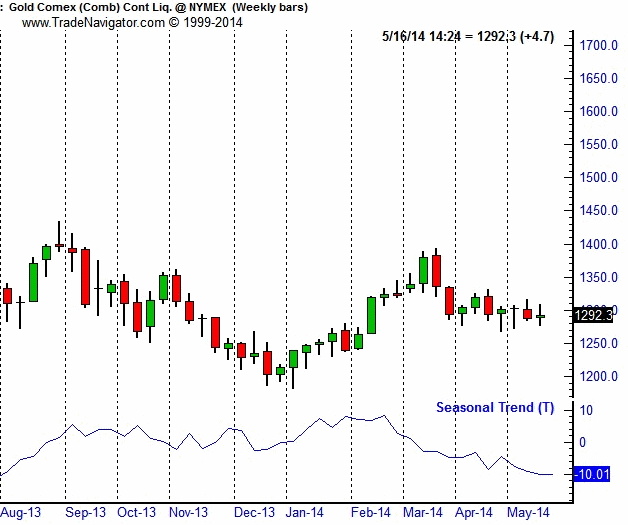
Second bullish moment here – gold has tested and moved above MPP and still holds above it. So, conclusion here is until grabbers’ lows hold – it is unsafe to take bearish position. Besides, seasonal trend will shift bullish at the end of August and will last till the late February of 2015:

Thus if you’re bearish - it is better to wait when market will done with grabbers. Others could try to ride on grabbers.
And finally, just to finish with this picture... Since action above 1350 area will mean probably erasion of weekly bearish patterns and context – market could not just stop on minor target. For example, appearing of butterfly here with ~1430$ destination point is not absolutely impossible thing.

Daily
The major conclusion that could make here is that price has accomplished what we’ve expected – deep retracement inside the body of weekly grabbers. Situation on gold market still stands clear as on previous week. As market most part of week has spent in tight range nothing has changed significantly.
I do not want to say that it will be simple to trade it, but, at least we have clarity in short-term perspective. We’ve estimated that’s a bit early, or, even unsafe to enter short. Hence, we can either enter long or do nothing. If we will enter long – we just need only recent swing up on daily chart, because this is a swing of our weekly grabbers. If market will erase this swing – it will erase grabbers also and our trading context will disappear as well, right? Consequently, we need just watch for most recent lows as invalidation point and try to take long position as close to them as possible.
Previously we’ve mentioned some concerns on existed downward AB-CD patterns that were not completed properly. But right now minor (4-hour) AB-CD has been erased, since price has moved above C point. Daily AB-CD still exists, and this will be our task – it would be nice if price will take out top in red square on chart. In this case all our concerns will be resolved. On daily chart trend is bullish as well.
So currently market has accomplished all requirements. Recall that in the beginning of the week situation was so that market is ready move up immediately. But when once, then twice gold has shown inability to move higher – we’ve come to conclusion on possible deeper retracement that has happened on Friday. Thus, right now we can try to take long position if you would like to take part in weekly grabbers trading.

4-hour
Here, on 4-hour chart we will take a look at broader picture. First is take a look that market still has touched our 5/8 Fib support as we’ve said “Gold likes to show deep retracements”. By this action it gives oportunity to take long position. Also market has hit 4-hour oversold. But this moment is important by another reason either.
Take a look at this chart. Precise 5/8 retracement lets us think about possible H&S pattern, right? Even more, current low becomes very significant point, since if market will break it down – H&S will fail. Double Bottom is also possible here, but action before “head” of the pattern tells that H&S is still prefferable.

1-hour
In general it would better to take a look at 30-min or even 15-min chart here, but in this case we will miss very important detail – bearish grabber that suggests downward retraceent. Since plunge down was solid and it still a bit confuses me – market probably will show deep retracement and this could give us AB=CD down to Agreement with 1300 Fib support. On lower charts you probably could find even some butterfly Buy that will have destination point around the same 1300 area.

Conclusion:
Situation on gold market remains sophisticated. Despite some obviously bearish moments, such as bullish USD sentiment, lack of physical demand, gold does not show real downward acceleration and we could see that gold troubles downward action. Definitely that there are some reasons for that and they probably are not limited by just geopolitical tensions. Technically we also see these signs, since we’ve got 3 weekly bullish grabbers in a row. Their minimum target achievement will not be able to vanish bearish setup totally, but it could become the starting point for something bigger. Thus, although we acknowledge existing of bearish situation on monthly, we simultaneously see some inner process that could trigger at least deep upside retracement in medium-term or potentially even shift long-term sentiment to bullish.
In this situation it is better to work on definite patterns, such as grabber that we’ve got on weekly chart.
In short term perspective situation is relatively clear. Market has completed all our conditions for long entry and it is no sense to wait more – either weekly bullish patterns will start to work or they will fail. Thus, we could think about long entry around 1300 area with stop below weekly grabbers’ lows.
The technical portion of Sive's analysis owes a great deal to Joe DiNapoli's methods, and uses a number of Joe's proprietary indicators. Please note that Sive's analysis is his own view of the market and is not endorsed by Joe DiNapoli or any related companies.
Gold prices were slightly lower on Friday, paring losses on safe-haven buying as equity markets slid after Ukraine said its forces had engaged a Russian armored column on Ukrainian soil in what appeared to be a major military escalation. Investors bought bullion and U.S. Treasuries after Ukraine said its forces had attacked and partly destroyed a Russian armored column that crossed into Ukrainian territory. Moscow said its forces had not crossed into Ukraine, and accused Kiev of trying to sabotage deliveries of aid.
"The news definitely helps gold reverse higher and shows that gold is very susceptible to geopolitical tensions," said Phillip Streible, senior commodities broker at RJ O'Brien. "When these developments cool, you will see the gold market come right back down."
Earlier in the session, bullion was down more than 1 percent because of weak physical demand, gains in U.S. equities and weak U.S. producer inflation data. But stocks fell after the news from Ukraine, while benchmark 10-year U.S. Treasury bond prices rose.
Technical support could further lift prices after gold breached its 50- and 100-day moving averages following Friday's rally.
In gold investment news, hedge fund Paulson & Co maintained its stake in the world's biggest gold-backed exchange-traded fund, SPDR Gold Trust, in the second quarter, while Soros Fund Management LLC sharply boosted its investment in gold mining stocks.
Among other precious metals, silver was down 1.4 percent at $19.52 an ounce. The silver market entered a new era in benchmarking on Friday after a regulatory drive for more transparency in price setting brought the 117-year-old silver 'fix' to an end.

Monthly
As we’ve mentioned previously price should pass solid distance to change situation drastically. it could change only if market will move above 1400 area. On current week reason for rally again was suspicious, as we’ve pointed the reason above. Gold right now has tired to wait and catches any more or less valuable news to show action. Still, it is possible that there are some features under curtain that we do not see right now. Because usually solid surge in Open interest and Net long position hardly happens occasionally or just on rumor of geopolitical event that was fastly belied.
Since currently August mostly is an inside month for July our former analysis is still working. Although investors have not got hawkish hints from Fed and recent NFP data was slightly lower than analysts poll, major factors are still valid - good economy data, that right now is confirmed by US companies earning reports, weak physical demand – all these moments prevent gold appreciation. At the same time there are two factors that could support gold soon – seasonal trend, geopolitical tensions. And in general, guys, current level are not bad in general for partial long-term purchases. This thought is confirmed by Soros fund that has increased investing in gold shares. Besides, US data is a subject to change. Currently it looks good, let’s see on Fed minutes and Jackson Hole meeting. But appearing of signs of inflation could add fuel to gold.
Bearish grabber pattern is important, but June, and especially July has blocked gradual downward action and white candles break the bearish harmony of recent action. Next upside important level is 1360 – Yearly pivot point. If market will move above it – this could be an indication that gold will continue move higher and this really could become a breaking moment on gold market. Otherwise, grabber will be valid and potentially could lead price back at least to 1180 lows again.
That’s being said, situation on the monthly chart does not suggest yet taking long-term positions on gold. Still, fundamental picture is moderately bearish in long-term. Possible sanctions from EU and US could hurt their own economies (especially EU). Many analysts already have started to talk about it. It means that economies will start to loose upside momentum and inflation will remain anemic. In such situations investors mostly invest in interest-bear assets, such as bonds. Inflation also will be depressed and this is negative sign for gold. At the same time we do not want to say that situation is cloudless for bears, absolutely not. Especially due to the pattern that we’ve got on weekly chart…

Weekly
Although monthly picture is moderately bearish and market needs to exceed 1400 to change it, but in medium-term perspective market mostly bullish, at least due patterns that we have on weekly chart. In general analysis is the same and has become even stronger since we’ve got another bullish grabber. Thus we have 3 weekly grabbers in a row.
Weekly chart is a goldmine of potential patterns. Minimum target of grabbers stands above 1350 area, very close to YPP ~ 1360. Trend is bullish here as on monthly chart. Possible success of grabber has very important meaning for strategic picture. Recall that previously we’ve discussed weekly bearish AB=CD and 1250 lows is 0.618 target. Recent upward move to 1345 area could be treated as retracement and then market re-established downward action. But if right now grabbers will work – market will have to return right back up again and this contradicts to normal bearish development. This could really shift medium term sentiment to bullish. To keep bearish setup – price should erase grabbers and move below its lows.
Second bullish moment here – gold has tested and moved above MPP and still holds above it. So, conclusion here is until grabbers’ lows hold – it is unsafe to take bearish position. Besides, seasonal trend will shift bullish at the end of August and will last till the late February of 2015:

Thus if you’re bearish - it is better to wait when market will done with grabbers. Others could try to ride on grabbers.
And finally, just to finish with this picture... Since action above 1350 area will mean probably erasion of weekly bearish patterns and context – market could not just stop on minor target. For example, appearing of butterfly here with ~1430$ destination point is not absolutely impossible thing.

Daily
The major conclusion that could make here is that price has accomplished what we’ve expected – deep retracement inside the body of weekly grabbers. Situation on gold market still stands clear as on previous week. As market most part of week has spent in tight range nothing has changed significantly.
I do not want to say that it will be simple to trade it, but, at least we have clarity in short-term perspective. We’ve estimated that’s a bit early, or, even unsafe to enter short. Hence, we can either enter long or do nothing. If we will enter long – we just need only recent swing up on daily chart, because this is a swing of our weekly grabbers. If market will erase this swing – it will erase grabbers also and our trading context will disappear as well, right? Consequently, we need just watch for most recent lows as invalidation point and try to take long position as close to them as possible.
Previously we’ve mentioned some concerns on existed downward AB-CD patterns that were not completed properly. But right now minor (4-hour) AB-CD has been erased, since price has moved above C point. Daily AB-CD still exists, and this will be our task – it would be nice if price will take out top in red square on chart. In this case all our concerns will be resolved. On daily chart trend is bullish as well.
So currently market has accomplished all requirements. Recall that in the beginning of the week situation was so that market is ready move up immediately. But when once, then twice gold has shown inability to move higher – we’ve come to conclusion on possible deeper retracement that has happened on Friday. Thus, right now we can try to take long position if you would like to take part in weekly grabbers trading.

4-hour
Here, on 4-hour chart we will take a look at broader picture. First is take a look that market still has touched our 5/8 Fib support as we’ve said “Gold likes to show deep retracements”. By this action it gives oportunity to take long position. Also market has hit 4-hour oversold. But this moment is important by another reason either.
Take a look at this chart. Precise 5/8 retracement lets us think about possible H&S pattern, right? Even more, current low becomes very significant point, since if market will break it down – H&S will fail. Double Bottom is also possible here, but action before “head” of the pattern tells that H&S is still prefferable.

1-hour
In general it would better to take a look at 30-min or even 15-min chart here, but in this case we will miss very important detail – bearish grabber that suggests downward retraceent. Since plunge down was solid and it still a bit confuses me – market probably will show deep retracement and this could give us AB=CD down to Agreement with 1300 Fib support. On lower charts you probably could find even some butterfly Buy that will have destination point around the same 1300 area.

Conclusion:
Situation on gold market remains sophisticated. Despite some obviously bearish moments, such as bullish USD sentiment, lack of physical demand, gold does not show real downward acceleration and we could see that gold troubles downward action. Definitely that there are some reasons for that and they probably are not limited by just geopolitical tensions. Technically we also see these signs, since we’ve got 3 weekly bullish grabbers in a row. Their minimum target achievement will not be able to vanish bearish setup totally, but it could become the starting point for something bigger. Thus, although we acknowledge existing of bearish situation on monthly, we simultaneously see some inner process that could trigger at least deep upside retracement in medium-term or potentially even shift long-term sentiment to bullish.
In this situation it is better to work on definite patterns, such as grabber that we’ve got on weekly chart.
In short term perspective situation is relatively clear. Market has completed all our conditions for long entry and it is no sense to wait more – either weekly bullish patterns will start to work or they will fail. Thus, we could think about long entry around 1300 area with stop below weekly grabbers’ lows.
The technical portion of Sive's analysis owes a great deal to Joe DiNapoli's methods, and uses a number of Joe's proprietary indicators. Please note that Sive's analysis is his own view of the market and is not endorsed by Joe DiNapoli or any related companies.


