Sive Morten
Special Consultant to the FPA
- Messages
- 18,732
Fundamentals
In recent 2-3 weeks, especially after dramatic action after recent CPI release, when there was massive sell-off on stock market and Treasuries, major question that stands right now - whether Fed stands "in time" with inflation or not? Different answer will open different perspective for gold market. If we would suggest that Fed is lugging to inflation, this will mean that gold should continue upward trend and should grow faster. Otherwise, if Fed stands agreement with inflation or even in leading position - this will be headwind for gold market and should lead either to consolidation or even downside reversal.
Recent data of SPDR fund makes me think that situation is not really simple. Take a look by yourself:

Now we see clear mismatch in activity of gold market and physical buyers. Gold has returned back to September 2017 tops, and in general, it shows upward trend in 2018, while SPDR fund storages were decreasing as compares to September as in relation to starting point of 2018. It means that physical purchases stand not as strong as it was introduces in mass media. This is not good sign for gold market perspective.
This situation suggests that big players do not believe much in gold rally in nearest time. On Tuesday there will be first testimony of new Fed chairman in congress. It could appear that Fed policy could become more hawkish. Talking already stands about 4th rate increase in 2018. According to Fed fund watch tool by CME Group, probability is not too high, somewhere around 21%, but it has increased for 5% within a month.
US 10-year Treasuries has reached new 4-year top level of 2.91% of annual yield. Investors right now start to monitor another data - success of new US bonds auctions. It is done to understand demand from foreign investors, whether it is as strong as previously. Will be any signs of loosing interest to US bonds or demanding higher yield...
Last week auctions were rather successful and $258 Bln. of new bonds were issued. It was the second largest ever over a three-day period.
"Despite the hawkish stance by the Fed, which drove this move in the gold price, we are still above the $1,300 mark," said Think Markets' chief market analyst Naeem Aslam, flagging a key support level.
"We think some participants were surprised and unprepared, which created the largest weekly loss for this year."
Barnabas Gan forecast for 2018 is also stands down. He expects level of 1100$ by the end of the year, thinking that Fed hawkish policy is underestimated by market and it will become stronger barrier than it is treated right now.
"The high interest rate environment would be key driver that would drive gold prices lower," said OCBC analyst Barnabas Gan. "Since gold remains a zero yielding asset, higher interest rate environment could stimulate risk appetite and yield-chasing behaviour," said Gan, whose year-end outlook for gold is at
$1,100.
COT Report
CFTC data doesn't give us new inputs this week. Sentiment mostly stands bullish. By historical view, total speculative position is rather high and stands near historical top levels. last week some purchases have been done as net long position has increased slightly as well as open interest. So, According to CFTC data we do not have signs of massive sell-off yet. Still, here you can see the same picture as on SPDR fund - divergence between price and net long position dynamic. While price is growing and stands right now at new tops, or at least it is not dropping - net long position gradually decreasing. This could be a sign of coming collapse on gold market....

Technicals
Monthly
February mostly has passed invisibly for monthly chart as it was inside month for January. To change picture on monthly chart, market should show really significant swings.
Major resistance still stands at 1380-1391 that includes 2016 top, major Fib level and YPR1.
Taking a look at "dark side" it would be better if market washes out 1375 top. In this case it could totally destroy any, even theoretical chances, on downside butterfly. But as price stands below 1375, theoretically butterfly is still possible, despite that chances look phantom right now.
In fact, most important moment for long-term gold right now is ability to move higher. 1327 level is long-term COP target of AB-CD started at 1046$, in July 2015. First it was reached in July 2017. After logical minor bounce price returns back to it. But right now it should be an action higher, to next 1450 target, which is OP of the same AB-CD. If gold will not be able to do it - strong drop is possible, because price will fail to proceed next extension leg, showing inability and lack of strength to do it. This could break whole AB-CD construction.

Weekly
On weekly chart is the same story - inner week to previous one. In general, weekly picture brings mixed issues. From one side - there are no real signs of failure or breaking of bullish scenario. Trend stands bullish, market holds above minor 3/8 level. At the same time, some signs of weakness stand also. Thus, peaks strength are weaker compares to bottoms and we could recognize shape of wedge pattern is growing. Second - MACD bearish divergence could be formed as soon as trend will change to bearish.
Major concern here stands around OP target. It has not been reached yet but it should be before reversal or any other action. But how this will happen - either by strong upside breakout or just by nervousness spike on some data release. Weekly chart suggests that here we could get small butterfly "Sell", which could complete this AB=CD target.

Daily
This time frame is not simple for analysis. In fact, weekly chart suggests that somehow upward spike should happen, at least based on probability analysis. This, in turn, means that butterfly also has chances to be formed.
Right now gold stands in triangle consolidation which, as usual, could give two scenarios of breakout. Yesterday, our FX market analysis suggests that dollar should strength a bit more as we're watching butterflies as on EUR as on DXY. This, in turn, should lead to downward action here as well.
But minor downside continuation will not break chances of butterfly pattern as its invalidation point stands at 1307 lows. It means that market easily could go down slightly before upside reversal will happen. Most probable destination point again is the same K-support area and daily OS at 1310-1315:

Intraday
Price action that we see here, indirectly confirms our suggestion. Recall that on Friday we've talked about possible reverse H&S pattern that could trigger upside bounce. If you will take a look at this pattern now - you'll see that something is going wrong with it. I'm speaking on right shoulder. It looks too flat and long-term and doesn't correspond to idea of H&S pattern.
This makes me think that H&S pattern here probably will fail and we could get the same butterfly here as on EUR and DXY with either 1318 or even 1314 target:

What will happen after that it is difficult to foresee. Some upside bounce will follow probably, but whether it will become real upside reversal to 1377$ target, this is still a question. But, as we've said, breaking of 1307 lows significantly shift advantage in favor of bears.
Conclusion
Long term situation stands in tension moment. Gold rather soon should break 1380 resistance, otherwise trend could change and price could show significant drop.
In short-term perspective we will be watching for our scenario of butterfly appearing on hourly chart. Initially it could be good opportunity to go long. Later it will depend on pace of upside action. In general we need to understand whether gold will go to OP target @1377 or not.
The technical portion of Sive's analysis owes a great deal to Joe DiNapoli's methods, and uses a number of Joe's proprietary indicators. Please note that Sive's analysis is his own view of the market and is not endorsed by Joe DiNapoli or any related companies.
In recent 2-3 weeks, especially after dramatic action after recent CPI release, when there was massive sell-off on stock market and Treasuries, major question that stands right now - whether Fed stands "in time" with inflation or not? Different answer will open different perspective for gold market. If we would suggest that Fed is lugging to inflation, this will mean that gold should continue upward trend and should grow faster. Otherwise, if Fed stands agreement with inflation or even in leading position - this will be headwind for gold market and should lead either to consolidation or even downside reversal.
Recent data of SPDR fund makes me think that situation is not really simple. Take a look by yourself:
Now we see clear mismatch in activity of gold market and physical buyers. Gold has returned back to September 2017 tops, and in general, it shows upward trend in 2018, while SPDR fund storages were decreasing as compares to September as in relation to starting point of 2018. It means that physical purchases stand not as strong as it was introduces in mass media. This is not good sign for gold market perspective.
This situation suggests that big players do not believe much in gold rally in nearest time. On Tuesday there will be first testimony of new Fed chairman in congress. It could appear that Fed policy could become more hawkish. Talking already stands about 4th rate increase in 2018. According to Fed fund watch tool by CME Group, probability is not too high, somewhere around 21%, but it has increased for 5% within a month.
US 10-year Treasuries has reached new 4-year top level of 2.91% of annual yield. Investors right now start to monitor another data - success of new US bonds auctions. It is done to understand demand from foreign investors, whether it is as strong as previously. Will be any signs of loosing interest to US bonds or demanding higher yield...
Last week auctions were rather successful and $258 Bln. of new bonds were issued. It was the second largest ever over a three-day period.
"Despite the hawkish stance by the Fed, which drove this move in the gold price, we are still above the $1,300 mark," said Think Markets' chief market analyst Naeem Aslam, flagging a key support level.
"We think some participants were surprised and unprepared, which created the largest weekly loss for this year."
Barnabas Gan forecast for 2018 is also stands down. He expects level of 1100$ by the end of the year, thinking that Fed hawkish policy is underestimated by market and it will become stronger barrier than it is treated right now.
"The high interest rate environment would be key driver that would drive gold prices lower," said OCBC analyst Barnabas Gan. "Since gold remains a zero yielding asset, higher interest rate environment could stimulate risk appetite and yield-chasing behaviour," said Gan, whose year-end outlook for gold is at
$1,100.
COT Report
CFTC data doesn't give us new inputs this week. Sentiment mostly stands bullish. By historical view, total speculative position is rather high and stands near historical top levels. last week some purchases have been done as net long position has increased slightly as well as open interest. So, According to CFTC data we do not have signs of massive sell-off yet. Still, here you can see the same picture as on SPDR fund - divergence between price and net long position dynamic. While price is growing and stands right now at new tops, or at least it is not dropping - net long position gradually decreasing. This could be a sign of coming collapse on gold market....
Technicals
Monthly
February mostly has passed invisibly for monthly chart as it was inside month for January. To change picture on monthly chart, market should show really significant swings.
Major resistance still stands at 1380-1391 that includes 2016 top, major Fib level and YPR1.
Taking a look at "dark side" it would be better if market washes out 1375 top. In this case it could totally destroy any, even theoretical chances, on downside butterfly. But as price stands below 1375, theoretically butterfly is still possible, despite that chances look phantom right now.
In fact, most important moment for long-term gold right now is ability to move higher. 1327 level is long-term COP target of AB-CD started at 1046$, in July 2015. First it was reached in July 2017. After logical minor bounce price returns back to it. But right now it should be an action higher, to next 1450 target, which is OP of the same AB-CD. If gold will not be able to do it - strong drop is possible, because price will fail to proceed next extension leg, showing inability and lack of strength to do it. This could break whole AB-CD construction.
Weekly
On weekly chart is the same story - inner week to previous one. In general, weekly picture brings mixed issues. From one side - there are no real signs of failure or breaking of bullish scenario. Trend stands bullish, market holds above minor 3/8 level. At the same time, some signs of weakness stand also. Thus, peaks strength are weaker compares to bottoms and we could recognize shape of wedge pattern is growing. Second - MACD bearish divergence could be formed as soon as trend will change to bearish.
Major concern here stands around OP target. It has not been reached yet but it should be before reversal or any other action. But how this will happen - either by strong upside breakout or just by nervousness spike on some data release. Weekly chart suggests that here we could get small butterfly "Sell", which could complete this AB=CD target.
Daily
This time frame is not simple for analysis. In fact, weekly chart suggests that somehow upward spike should happen, at least based on probability analysis. This, in turn, means that butterfly also has chances to be formed.
Right now gold stands in triangle consolidation which, as usual, could give two scenarios of breakout. Yesterday, our FX market analysis suggests that dollar should strength a bit more as we're watching butterflies as on EUR as on DXY. This, in turn, should lead to downward action here as well.
But minor downside continuation will not break chances of butterfly pattern as its invalidation point stands at 1307 lows. It means that market easily could go down slightly before upside reversal will happen. Most probable destination point again is the same K-support area and daily OS at 1310-1315:
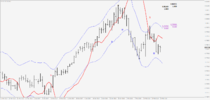
Intraday
Price action that we see here, indirectly confirms our suggestion. Recall that on Friday we've talked about possible reverse H&S pattern that could trigger upside bounce. If you will take a look at this pattern now - you'll see that something is going wrong with it. I'm speaking on right shoulder. It looks too flat and long-term and doesn't correspond to idea of H&S pattern.
This makes me think that H&S pattern here probably will fail and we could get the same butterfly here as on EUR and DXY with either 1318 or even 1314 target:
What will happen after that it is difficult to foresee. Some upside bounce will follow probably, but whether it will become real upside reversal to 1377$ target, this is still a question. But, as we've said, breaking of 1307 lows significantly shift advantage in favor of bears.
Conclusion
Long term situation stands in tension moment. Gold rather soon should break 1380 resistance, otherwise trend could change and price could show significant drop.
In short-term perspective we will be watching for our scenario of butterfly appearing on hourly chart. Initially it could be good opportunity to go long. Later it will depend on pace of upside action. In general we need to understand whether gold will go to OP target @1377 or not.
The technical portion of Sive's analysis owes a great deal to Joe DiNapoli's methods, and uses a number of Joe's proprietary indicators. Please note that Sive's analysis is his own view of the market and is not endorsed by Joe DiNapoli or any related companies.
")