Sive Morten
Special Consultant to the FPA
- Messages
- 18,673
Fundamentals
(Reuters) Gold slipped sharply on Friday after stronger than expected U.S. payrolls data for June but rebounded quickly, underpinned by concerns over the outlook for financial markets following Britain's Brexit vote.
Gold hit a low of $1,335.66 an ounce in the wake of data showing that U.S. non-farm payrolls increased by 287,000 jobs last month, the largest gain since October. That sent the dollar to a two-week high against the euro and reignited talk that the U.S. Federal Reserve could lift interest rates this year.
Spot gold, which has risen more than $100 an ounce since Britain voted to quit the EU, was down 0.1 percent at $1,358.87 an ounce by 2:27 p.m. EDT (1827 GMT). It was on track to close higher for the sixth straight week.
U.S. gold futures for August delivery, which fell as low as $1,336.30 an ounce in the wake of the jobs data, settled down 0.3 percent at $1,358.40. "The knee-jerk reaction to the stronger than expected payrolls data has been lower, but you're already seeing gold bounce off the lows," UBS analyst Joni Teves said.
"There are still a lot of people out there who want to build gold positions, and will be keen to come in on any
retracements." Traders had awaited the payrolls data for clues on U.S. monetary policy. Fed futures contracts, which suggested before the jobs report that traders saw only a 19 percent chance of a U.S. rate hike by December, now suggest a higher chance.
Lower rates tend to boost gold prices because they cut the opportunity cost of holding non-yielding bullion while weighing on the dollar, in which it is priced. "It's a great indicator that the market is still affected by
the Fed having to keep interest rates low despite the jobs report, and concerns are exacerbated by Brexit," said Anthem Blanchard, chief executive of Anthem Vault, noting the quick recovery after an early drop.
SPDR Gold Trust, the world's largest gold-backed exchange-traded fund, said its holdings fell by a little more
than four tonnes on Thursday to 978.29 tonnes, having posted its biggest daily inflow in six years on Tuesday.
In India, gold discounts soared to a record high of up to $100 an ounce this week as prices in the world's second-largest bullion consumer hit their highest in nearly three years.
COT Report
So, as we've got price drop on gold on Friday, while report was released on Wed - it doesn't show yet possible changes that haven't yet come to passed on Wed. Thus, it will be interesting to take a look at it on next week.
On current chart everything stands the same - as open interest as speculative long position stand at top:

Technicals
Monthly
Technically current upward action is first one after long term of decreasing and it should be interrupted by deep retracement sometime. Probably it should happen but this potential downward action has a great chance to become just a retracement. Overall political and financial situation in the world probably will not give a chance to relax. Thus, we have a positive long-term view on gold market.
As market slightly has moved above YPP and our K-resistance area, something is starting to form here, I mean pattern by which long-term global trend could change on gold.
Take a careful look at the picture - could you recognize here possible reverse H&S pattern? Besides the shape itself, some features here that in general typical for H&S. For example, relation between head and shoulders - 1.618. Butterfly... very often first part of H&S takes the shape of butterfly pattern...
Finally take a look at action on downward slope and upward one of the head - last move down was slower than current move up. All these moments point on possible H&S pattern here.
If we really will get it - then we could make an assumption on possible depth of retracement. Now the bottom of shoulder stands approximately around 1160 area...
Now market is approaching to major, all time 3/8 Fib resistance @ 1380 level. Let's see what will happen...

Weekly
Based on analysis of monthly chart, we probably should be focused on searching downward reversal patterns, that could confirm (or destroy, may be) or thoughts on monthy pattern.
Here guys, again, we have only some hints. It seems that something is forming here, some really important thing will follow, and probably soon, but not yet, as market just has finished upside action.
There are two important things here. First one forbids us to go long - weekly overbought and reaching of 1.618 extension of recent retracement down. Second - again, the same 1.618 ratio and hint on H&S, but now on direct one, bearish reversal pattern.
Weekly chart also shows that the bottom of downward retracement will be around 1160-1170 as here we have major 5/8 Fib support. And also we could get some opinion on the shape of retracement. H&S usually suggests some AB=CD down, based on the head and on right shoulder.

Daily
Daily chart is almost useless by far. Trend stands bullish here, but no really important information we have here. On Thu market has formed high wave pattern and NFP release was not able to push market out of its range - although spike down has happened, but close price and body of the candle remains inside high wave pattern.
The only thing that we could treat as relatively bearish is a Friday candle itself, since it looks like hanging man pattern. This is the only thing that we have here. Probably we should get more clarity within a week or so...

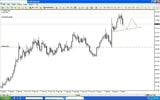
Hourly
Friday volatility was really strong, guys. Here we've got partial completion of our trading plan. Our DRPO "Sell" pattern has worked nice and even has exceeded its target, while it is not all clear yet with our second pattern - again H&S, but minor one.
As you can see here gold has formed another high wave pattern (take a look at 4 hour chart as well) that will be important within next week. We mostly are interested in dropping back inside the range of huge daily candle. IF this will happen, and market will confirm failure quality of upside breakout - this will be very important sign for us. To complete this scenario gold should start dropping on Mon, somewhere around current levels. We think that on gold we're coming close to thrilling moment, because possible retracement down is not just valuable by itself, but also because it will bring clarity to long, long-term perspective and give you direction.
As we've estimated - this is not the time to go long. So, we think that current time is a time to wait a bit. But may be some scalp intraday bearish setups also could be traded... if we will get any we will discuss them in daily videos...

Conclusion:
We continue to keep long-term bullish view on gold market. But now chances on deep retracement are very high due combination of as sentiment as technical moments. Partially we even could recognize thrilling pattern on monthly chart which brings more clarity and shows definite levels to watch for. Now is the major question whether it will be formed or not.
In short-term perspective we think that its not good time to go long. May be some scalp bearish patterns could be traded...
The technical portion of Sive's analysis owes a great deal to Joe DiNapoli's methods, and uses a number of Joe's proprietary indicators. Please note that Sive's analysis is his own view of the market and is not endorsed by Joe DiNapoli or any related companies.
(Reuters) Gold slipped sharply on Friday after stronger than expected U.S. payrolls data for June but rebounded quickly, underpinned by concerns over the outlook for financial markets following Britain's Brexit vote.
Gold hit a low of $1,335.66 an ounce in the wake of data showing that U.S. non-farm payrolls increased by 287,000 jobs last month, the largest gain since October. That sent the dollar to a two-week high against the euro and reignited talk that the U.S. Federal Reserve could lift interest rates this year.
Spot gold, which has risen more than $100 an ounce since Britain voted to quit the EU, was down 0.1 percent at $1,358.87 an ounce by 2:27 p.m. EDT (1827 GMT). It was on track to close higher for the sixth straight week.
U.S. gold futures for August delivery, which fell as low as $1,336.30 an ounce in the wake of the jobs data, settled down 0.3 percent at $1,358.40. "The knee-jerk reaction to the stronger than expected payrolls data has been lower, but you're already seeing gold bounce off the lows," UBS analyst Joni Teves said.
"There are still a lot of people out there who want to build gold positions, and will be keen to come in on any
retracements." Traders had awaited the payrolls data for clues on U.S. monetary policy. Fed futures contracts, which suggested before the jobs report that traders saw only a 19 percent chance of a U.S. rate hike by December, now suggest a higher chance.
Lower rates tend to boost gold prices because they cut the opportunity cost of holding non-yielding bullion while weighing on the dollar, in which it is priced. "It's a great indicator that the market is still affected by
the Fed having to keep interest rates low despite the jobs report, and concerns are exacerbated by Brexit," said Anthem Blanchard, chief executive of Anthem Vault, noting the quick recovery after an early drop.
SPDR Gold Trust, the world's largest gold-backed exchange-traded fund, said its holdings fell by a little more
than four tonnes on Thursday to 978.29 tonnes, having posted its biggest daily inflow in six years on Tuesday.
In India, gold discounts soared to a record high of up to $100 an ounce this week as prices in the world's second-largest bullion consumer hit their highest in nearly three years.
COT Report
So, as we've got price drop on gold on Friday, while report was released on Wed - it doesn't show yet possible changes that haven't yet come to passed on Wed. Thus, it will be interesting to take a look at it on next week.
On current chart everything stands the same - as open interest as speculative long position stand at top:
Technicals
Monthly
Technically current upward action is first one after long term of decreasing and it should be interrupted by deep retracement sometime. Probably it should happen but this potential downward action has a great chance to become just a retracement. Overall political and financial situation in the world probably will not give a chance to relax. Thus, we have a positive long-term view on gold market.
As market slightly has moved above YPP and our K-resistance area, something is starting to form here, I mean pattern by which long-term global trend could change on gold.
Take a careful look at the picture - could you recognize here possible reverse H&S pattern? Besides the shape itself, some features here that in general typical for H&S. For example, relation between head and shoulders - 1.618. Butterfly... very often first part of H&S takes the shape of butterfly pattern...
Finally take a look at action on downward slope and upward one of the head - last move down was slower than current move up. All these moments point on possible H&S pattern here.
If we really will get it - then we could make an assumption on possible depth of retracement. Now the bottom of shoulder stands approximately around 1160 area...
Now market is approaching to major, all time 3/8 Fib resistance @ 1380 level. Let's see what will happen...
Weekly
Based on analysis of monthly chart, we probably should be focused on searching downward reversal patterns, that could confirm (or destroy, may be) or thoughts on monthy pattern.
Here guys, again, we have only some hints. It seems that something is forming here, some really important thing will follow, and probably soon, but not yet, as market just has finished upside action.
There are two important things here. First one forbids us to go long - weekly overbought and reaching of 1.618 extension of recent retracement down. Second - again, the same 1.618 ratio and hint on H&S, but now on direct one, bearish reversal pattern.
Weekly chart also shows that the bottom of downward retracement will be around 1160-1170 as here we have major 5/8 Fib support. And also we could get some opinion on the shape of retracement. H&S usually suggests some AB=CD down, based on the head and on right shoulder.
Daily
Daily chart is almost useless by far. Trend stands bullish here, but no really important information we have here. On Thu market has formed high wave pattern and NFP release was not able to push market out of its range - although spike down has happened, but close price and body of the candle remains inside high wave pattern.
The only thing that we could treat as relatively bearish is a Friday candle itself, since it looks like hanging man pattern. This is the only thing that we have here. Probably we should get more clarity within a week or so...
Hourly
Friday volatility was really strong, guys. Here we've got partial completion of our trading plan. Our DRPO "Sell" pattern has worked nice and even has exceeded its target, while it is not all clear yet with our second pattern - again H&S, but minor one.
As you can see here gold has formed another high wave pattern (take a look at 4 hour chart as well) that will be important within next week. We mostly are interested in dropping back inside the range of huge daily candle. IF this will happen, and market will confirm failure quality of upside breakout - this will be very important sign for us. To complete this scenario gold should start dropping on Mon, somewhere around current levels. We think that on gold we're coming close to thrilling moment, because possible retracement down is not just valuable by itself, but also because it will bring clarity to long, long-term perspective and give you direction.
As we've estimated - this is not the time to go long. So, we think that current time is a time to wait a bit. But may be some scalp intraday bearish setups also could be traded... if we will get any we will discuss them in daily videos...
Conclusion:
We continue to keep long-term bullish view on gold market. But now chances on deep retracement are very high due combination of as sentiment as technical moments. Partially we even could recognize thrilling pattern on monthly chart which brings more clarity and shows definite levels to watch for. Now is the major question whether it will be formed or not.
In short-term perspective we think that its not good time to go long. May be some scalp bearish patterns could be traded...
The technical portion of Sive's analysis owes a great deal to Joe DiNapoli's methods, and uses a number of Joe's proprietary indicators. Please note that Sive's analysis is his own view of the market and is not endorsed by Joe DiNapoli or any related companies.
")