Sive Morten
Special Consultant to the FPA
- Messages
- 18,676
Fundamentals
So, the gold... Gold by the way was showing most rational performance last week. Indeed, when everything stands bad, what else could replace gold? As we've said yesterday, in our FX report - common people have the reasonable thoughts, kind of - "yes, JPow and Yellen are seem confident and maybe indeed, everything is under control, but who knows... I would better to withdraw some...". And I'm sure that majority thinks the same. Besides, many people do not believe to regulators, which is also reasonable. And of course, in such environment gold takes the special role, despite whether it is dropping or rising in a moment.
Market overview
Gold traded at record highs in some currencies this week and neared all-time peaks in U.S. dollar terms after banking sector turmoil sent prices of the safe haven asset rocketing 10% in a matter of days. Banking stocks and bonds continued to plummet on worries that more problems may emerge after several U.S. banks and Switzerland's Credit Suisse collapsed or required rescue.
In U.S. dollars, gold shot as high as $2,009.59 from $1,815 on March 9 and was within sight of its 2020 peak of $2,072.50. Gold traded at record highs in some currencies after banking sector turmoil sent prices of the safe-haven asset rocketing 10% in a matter of days In other currencies, records had already fallen. Gold rose above 3,000 Australian dollars and 165,000 Indian rupees for the first time and traded around 1,880 euros, just 20 euros shy of its euro record.
Money market funds also attracted their largest inflows since March 2020 in the week through March 22, with more than $300 billion moving into cash over the course of the past month, according to a Bank of America note that cites EPFR Global data.
Goldman Sachs expects a commodities super-cycle driven by China and the capital flight from energy markets and investment this month after concerns triggered by the banking sector, the U.S. bank's head of commodities said.
Currie added that concerns about the banking sector were centred around U.S. regional banks while Europe was relatively safe from contagion. WE could add - until US Justice impose penalties around $2 Bln due to recent probe. Now even $2-3 Bln penalty could shake already unstable system.
It’s a sharp turnaround for bullion, which slid last month on expectations the Federal Reserve would continue its aggressive monetary tightening to curb inflation. Those bets have since been greatly diminished, with swaps traders now split on whether the central bank will hike again this year. That’s a boon for non-yielding gold, and investors have responded by increasing their allocations to the market. In tonnage terms, exchange-traded fund holdings of the metal rose the most since April last week, according to an initial tally by Bloomberg.
Russia’s central bank said its bullion holdings jumped by 1 million ounces over the past year as it bought gold in the face of Western sanctions. The Bank of Russia said it held 74.9 million ounces of gold at the end of February, unchanged from the previous month but up from 73.9 million a year earlier. That bullion hoard was worth $135.6 billion, it said.

Central banks more broadly bought a record 1,136 tons (about 37 million ounces) of gold last year, according to data from the World Gold Council. Another big buyer was China, which begun to disclose gold purchases in December after years of silence. The People’s Bank of China has added about 102 tons to its gold pile in the four months through February, according to data on its website.
On political side I would mention couple of moments that confirm our recent discussion of coming AUKUS and China confrontation. First, D. Trump said that union of
Russia and China, together with normalization of international relations between Syria, Iran and S. Arabia is a worst nightmare of the US. And second is - New Zealand Foreign Affairs Minister Nanaia Mahuta said on Saturday she had expressed concerns over the South China Sea and tensions in the Taiwan Strait during talks with her Chinese counterpart at the end of a visit to Beijing.
New Zealand's tone on security and China's growing presence in the South Pacific toughened in the past year after China and the Solomon Islands struck a security pact. New Zealand has consistently expressed concerns about the potential militarisation of the Pacific, amid China's military buildup in the South China Sea.
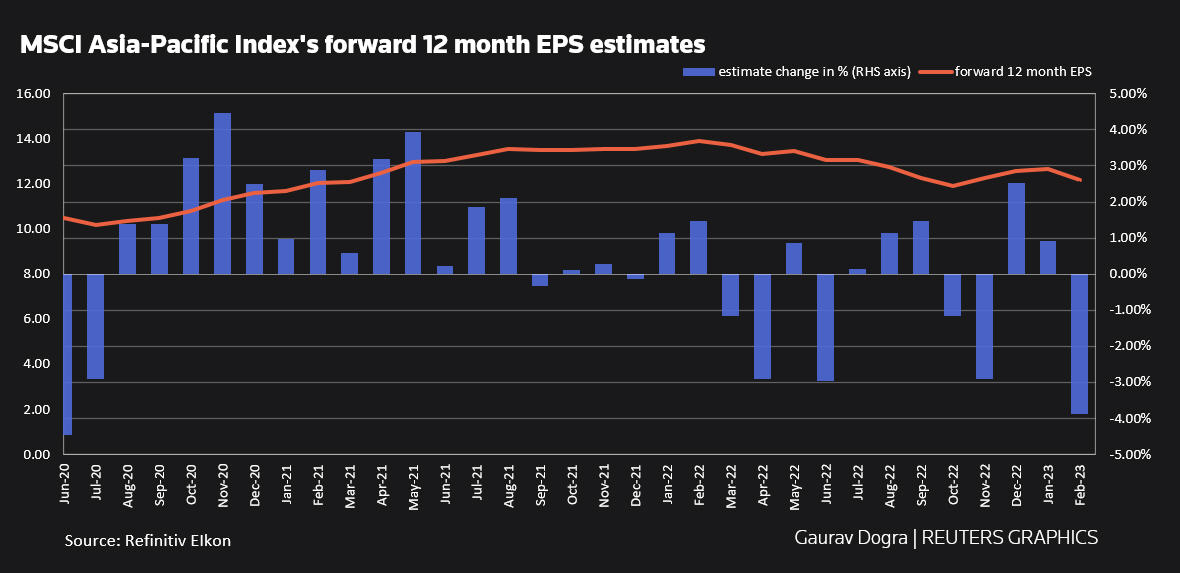
According to Refinitiv IBES data, analysts have cut their forward 12-month earnings' estimates by 3.6% since February, more than the 1.9% increases released in January. Some analysts expect China's recovery may not be enough to offset headwinds from weak global demand and supply constraints for export-reliant economies in the region.
Regional trade data showed China's economic reopening has not boosted Asian exporters much so far. Taiwan's exports fell in February to the lowest in nearly 24 months, while South Korea reported a fifth month of export declines. March data showed South Korea's 20-day exports to China fell 36.2% year-on-year, while Taiwan's export orders to China slumped 48.3% in the first two months of this year, the biggest drop since early 2009.
US keep grabbing EU producers. Volkswagen AG said lucrative new US incentives for EV makers were just too good to pass up when weighing to pick a partner or build its own factory to make cars for the new Scout brand. The German manufacturer this month moved ahead with plans for a $2 billion factory in South Carolina to produce electric SUVs as part of Scout Motors Inc. The factory is due to open in 2026 and will eventually churn out 200,000 EVs annually. That convinced VW to break ground on its own facility on 1,600 acres near Columbia, South Carolina, which will employ 4,000 workers when it opens in 2026.
Gold prices could surpass the record set at the height of the Covid-19 pandemic if ongoing turmoil in the banking sector persists and global central banks downshift their interest-rate hiking cycle, according to Sprott Inc., a top investor in the bullion industry.
BIS OUTLOOK ON THE US ECONOMY
This week we've got very interesting view on the US economy and banking crisis from the BIS. The conclusions are very grim for this decade's horizon, as a large burden of debt will drag the economy down. Briefly what their report is about:
Real (not nominal) GDP growth is economic activity that generates cash flows, where money is then invested or saved, or serves debt at the level of the entire economy. The average value of GDP growth in real terms is 1.75% and this figure continues to fall. That 1.75% goes to debt service first now (debt has priority) but all US debt is 220% of GDP (together with social obligations) So if interest rates on average 2%, then accrued interest payments will rise to 4,4% of GDP, giving a negative GDP growth of -2.65% per year.

That is, the higher the interest expenses, the more negative the GDP will be. To cover the costs, governments issued more debt, and 3.5 years later, when it came to refinancing, the debts were simply monetized through QE, leaving GDP growth only to cover private sector debt payments. In other words, without QE, there was not enough cash flow to service all of the systemic debt.
Why did QE run every 3.5 years? It's just the average maturity of public and private debt after 2009, when all the Central Banks of the West dropped their rates to zero.

Summary - The system in the US, EU, Japan, Britain will no longer be able to function without QE. The end of 2023 and the beginning of 2024 is the next debt refinancing period, and quantitative easing is needed again to finance it. If a new crisis arises, then large-scale QE.
The BIS estimates that the US Fed's balance sheet will rise to $12-14 trillion in a year or so. All new QE will certainly continue to devalue money, and increase the stratification of society, populism will grow stronger. In general, BIS draws a complete dead end, they believe that it is necessary to hold out until a jump in productivity or the creation of cheap energy sources.
Fears of tightening financial conditions leading to a recession are driving traders to rethink their risk exposure and seek out safety in the stock market.
OTHER THOUGHTS ON THE SUBJECT
In effect, the inflation fight is over. You don’t fight inflation by creating $300 billion out of thin air. But the Fed has concocted a scheme that will allow it to plausibly claim it is still in the inflation fight a little longer while simultaneously trying to minimize the negative impact of higher interest rates on the banks. Meanwhile, the banks can avoid the pain by accessing this crazy loan program. It is crazy because no sane person would make a loan based on the par value of the collateral. The value of the collateral is generally based on market value, plus a haircut to further protect the lender. By accepting collateral at face value, the Fed is effectively making unsecured loans. And this raises a question: what incentive do these banks have to ever pay this money back? If they default, they just lose some devalued bonds they don’t want anyway. It is highly likely these bad bonds will ultimately end up on the Fed’s balance sheet.
This looks a lot like a “kick the can down the road” scheme. It seems that Powell and Company are hoping this loan boondoggle will buy them time to keep tightening for a while longer in the hope that CPI will drop enough in the next couple of months to claim victory over inflation and then pivot without losing face. The Fed may have managed to get a finger in this hole, but it won’t be long before another hole appears. And then another. And then another. The question, in my mind, is where will the next hole manifest? And how will they plug that hole?
According to the W Post, the total capital buffer in the US banking system totals $2.2 trillion. Meanwhile, total unrealized losses in the system based on a pair of academic papers is between $1.7 and $2 trillion. In other words, if banks were suddenly forced to liquidate their bond and loan portfolios, the losses would erase between 77 percent and 91 percent of their combined capital cushion. It follows that large numbers of banks are terrifyingly fragile.”
As you understand, it is no big difference in the end - wether bank will collapse of Fed just will print money. Effect in long term anyway will be negative. So, the the Federal Reserve is trying to walk a tightrope — in a hurricane. With that hole in the dam seemingly plugged for the time being, the Fed pushed forward and raised interest rates by another 25 basis points at its March meeting. In effect, the bank bailout ended the inflation fight while allowing the Fed to continue the pretense of an inflation fight for a little while longer. What is particularly unique to the 2023 liquidity crisis is that the toxins are no longer about sub-prime credits, but the UST market, allegedly the most important and safe bond instrument in the world. The so-called “risk-free-returns” of Uncle Sam’s infamous IOUs are nothing more than “return-free-risk” thanks to the Fed’s overly high and rapid rate hike policies of 2022. What lies ahead is more consolidation among the larger banks and more centralization by the Fed over the banking system, as evidenced by the slow-creep toward CBDC and the Fed Now program to launch this year.
By opinion of Egon von Greyerz, the solidity of the banking system is based on confidence. With the fractional banking system, highly leveraged banks only have a fraction of the money available if all depositors ask for their money back. So when confidence evaporates, so do the balance sheets of the banks and depositors realise that the whole system is just a black hole. And this is exactly what is about to happen. For anyone who believes that this is just a problem with a few smaller US banks and one big one (Credit Suisse), they must think again.
The SNB is of course in a mess itself, having lost $143 billion in 2022. The SNB balance sheet is bigger than Swiss GDP and consists of currency speculation and US tech stocks. This central bank is the world’s biggest hedge fund and the least successful. But the Swiss banking system is very unsound, just like the rest of the world’s. A central bank which is bigger than the country’s GDP is extremely unsound. And a banking system which is 5x Swiss GDP makes it too big to save.
Although the Fed and ECB are much smaller in relation to their countries’ GDP than the SNB, these two central banks will soon discover that their assets of around $8 trillion each are grossly overvalued. With a global banking system on the verge of a systemic failure, Central Bankers and bankers have been working around the clock this weekend to temporarily avoid the inevitable collapse of the bankrupt financial system.
“2023 is likely to be the year of gold. Both fundamentally and technically gold looks like it will make major up moves this year.” And at the end of this article, I explain the importance of how and where gold should be held:“PREPARE FOR 10 YEARS OF GLOBAL DESTRUCTION.” “So my own preference would be to own physical gold and silver that only I have direct control of and can withdraw or sell with very short notice. It is also important to deal with a company that can move your metals at very short notice if the security or geopolitical situation would necessitate it.”
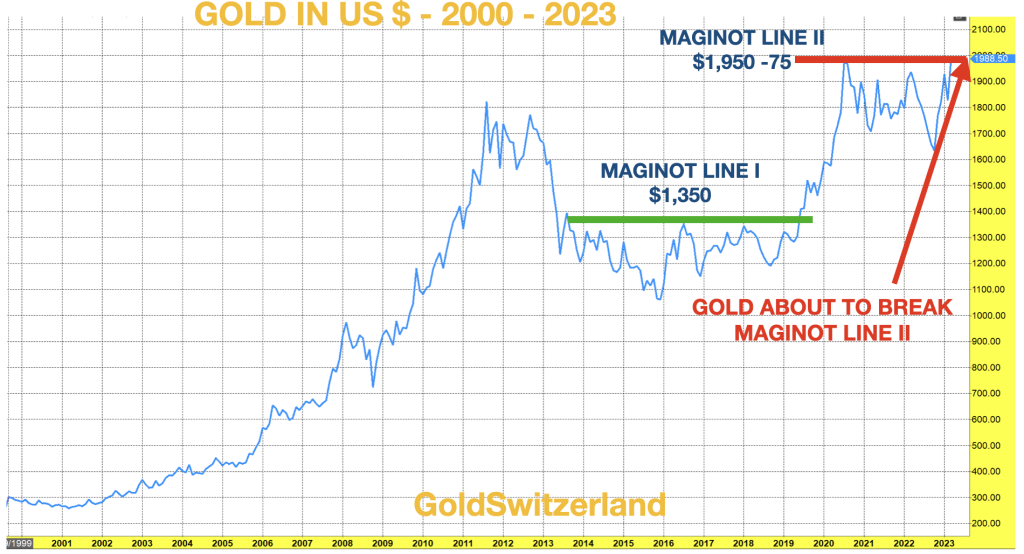
In February 2019 I wrote about what I called the Gold Maginot Line which had held for 6 years below $1,350. This is typical for gold. Having gone from $250 in 1999 to $1,900 in 2011, it then spent 8 years in a correction. At the time I forecast that the Maginot Line would soon break which it did and swiftly moved to $2,000 by August 2020. We have now had another period of consolidation since then and the next move above $2,000 and towards $3,000 is imminent.
Conclusion:
So, currently we have absolutely stunning combination of factors that are developing too fast. Not just economical but political either, and even in a higher degree. Our view is not too far from BIS conclusion. Yesterday we've said that expect new QE at least around $1.5-4 Trln. Using just a common sense, we could acknowledge with 100% confidence that Fed can't not to print. It has to print, that's all. Just because banks earn just around 3-3.5% on long-term investments, including long-term loans to real economy sector but have to pay above 4%, even on new BTFD (Buy This F**ng Debt) programme. Banks have no money for this - their interest margin is below the par for now. But this is only about banking sector. We have also mortgage loans exposure and, what is even greater - government debt problems, which have to be refinanced, paid out interest etc. We can't avoid new inflation spiral, and lower real interest rates.
Separate topic is a loss of confidence to regulatory authorities. Yesterday we've clearly shown that the Fed is loosing market's trust. We're not sure but it is highly likely that US Ministry of Justice will punish CS/UBS as a result of probe of relation to Russian Oligarchs. Switzerland that has frozen ~ $20 Bln by US Sanctions now is accused by the US that they do not fill them. For now the "small" penalty, even for $2Bln could destabilize system. So, we're living like on volcane - nobody nows where the next boom comes. Meantime, demand for gold is rising - Call/Put ratio breaks all highs:

In current situation, investors are totally disoriented. Where to run, what to do etc? The one thing we could say definitely - Fed has started crisis not to make stock holders and crypto investors happy. They will grab all liquidity that they could, just to safe own funds. Most probable by holding rates high or by breaking markets expectations on soon policy ease.
Some investors suggest that whatever collapse or inflation will come - gold market hardly will be attractive just because of high interest rates environment, and it can't be rival to short-term US Bills. We could argue that the real rate what is really matter and it tends to remain negative. Second - we're coming to environment when return of the investment becomes more important than return on the investment. Due to political processes external dollar devaluation is already in progress. Besides, we should not forget about economical crisis, economy slowdown and real sector depreciation. All these moments will bring toxic fruits. Gold performance could be volatile in nearest months, but more and more signs come in favor of real upside performance.
So, the gold... Gold by the way was showing most rational performance last week. Indeed, when everything stands bad, what else could replace gold? As we've said yesterday, in our FX report - common people have the reasonable thoughts, kind of - "yes, JPow and Yellen are seem confident and maybe indeed, everything is under control, but who knows... I would better to withdraw some...". And I'm sure that majority thinks the same. Besides, many people do not believe to regulators, which is also reasonable. And of course, in such environment gold takes the special role, despite whether it is dropping or rising in a moment.
Market overview
Gold traded at record highs in some currencies this week and neared all-time peaks in U.S. dollar terms after banking sector turmoil sent prices of the safe haven asset rocketing 10% in a matter of days. Banking stocks and bonds continued to plummet on worries that more problems may emerge after several U.S. banks and Switzerland's Credit Suisse collapsed or required rescue.
In U.S. dollars, gold shot as high as $2,009.59 from $1,815 on March 9 and was within sight of its 2020 peak of $2,072.50. Gold traded at record highs in some currencies after banking sector turmoil sent prices of the safe-haven asset rocketing 10% in a matter of days In other currencies, records had already fallen. Gold rose above 3,000 Australian dollars and 165,000 Indian rupees for the first time and traded around 1,880 euros, just 20 euros shy of its euro record.
Money market funds also attracted their largest inflows since March 2020 in the week through March 22, with more than $300 billion moving into cash over the course of the past month, according to a Bank of America note that cites EPFR Global data.
"It's all about risk hedging," said StoneX analyst Rhona O'Connell. "A Swiss bank is supposed to be the be all and end all of safe havens," she said. "If something else happens in the banking sector, you can expect gold to go higher." The failure of Silicon Valley Bank this month was "a gamechanger" for gold, she said. "The Fed will have to choose between higher inflation OR a recession/financial instability and either outcome is bullish for gold, which puts all time highs in play."
Some investors may sell gold to take profit in the short term but bullion's upward trend should continue, said Saxo Bank analyst Ole Hansen. "Peak rates have on three previous occasions during the past 20 years triggered a prolonged period of gold strength. Given the current situation a repeat cannot be ruled out."
Goldman Sachs expects a commodities super-cycle driven by China and the capital flight from energy markets and investment this month after concerns triggered by the banking sector, the U.S. bank's head of commodities said.
"As losses mounted, it spilled into commodities," Jeff Currie, global head of commodities for Goldman Sachs, told the Financial Times Commodities Global Summit on Tuesday. "Historically, when you have this kind of scarring event, it takes months to get capital back ... We will still get a deficit by June and it will drive oil prices higher."
"On copper, the forward outlook is extraordinarily postive. We'll be at the lowest observable inventories that have ever been recorded at 125,000 tonnes. We have peak supply occuring in 2024...Near term we put (the copper price) at $10,500 and longer term our price target is $15,000 a tonne. His remarks echoed those of major copper trader Trafigura which said the price could top $12,000. Copper hit a record high $10,845 in March 2022.
Currie added that concerns about the banking sector were centred around U.S. regional banks while Europe was relatively safe from contagion. WE could add - until US Justice impose penalties around $2 Bln due to recent probe. Now even $2-3 Bln penalty could shake already unstable system.
“The treatment of AT1 bonds has introduced a new source of uncertainty,” Marcus Garvey, head of metals strategy at Macquarie Group Ltd., wrote in a note. “The longer uncertainty rolls on, with neither market fears being wholly calmed nor a full-blown systematic crisis unfolding, the higher gold prices should be able to trade.”
It’s a sharp turnaround for bullion, which slid last month on expectations the Federal Reserve would continue its aggressive monetary tightening to curb inflation. Those bets have since been greatly diminished, with swaps traders now split on whether the central bank will hike again this year. That’s a boon for non-yielding gold, and investors have responded by increasing their allocations to the market. In tonnage terms, exchange-traded fund holdings of the metal rose the most since April last week, according to an initial tally by Bloomberg.
Russia’s central bank said its bullion holdings jumped by 1 million ounces over the past year as it bought gold in the face of Western sanctions. The Bank of Russia said it held 74.9 million ounces of gold at the end of February, unchanged from the previous month but up from 73.9 million a year earlier. That bullion hoard was worth $135.6 billion, it said.
Central banks more broadly bought a record 1,136 tons (about 37 million ounces) of gold last year, according to data from the World Gold Council. Another big buyer was China, which begun to disclose gold purchases in December after years of silence. The People’s Bank of China has added about 102 tons to its gold pile in the four months through February, according to data on its website.
On political side I would mention couple of moments that confirm our recent discussion of coming AUKUS and China confrontation. First, D. Trump said that union of
Russia and China, together with normalization of international relations between Syria, Iran and S. Arabia is a worst nightmare of the US. And second is - New Zealand Foreign Affairs Minister Nanaia Mahuta said on Saturday she had expressed concerns over the South China Sea and tensions in the Taiwan Strait during talks with her Chinese counterpart at the end of a visit to Beijing.
New Zealand's tone on security and China's growing presence in the South Pacific toughened in the past year after China and the Solomon Islands struck a security pact. New Zealand has consistently expressed concerns about the potential militarisation of the Pacific, amid China's military buildup in the South China Sea.
According to Refinitiv IBES data, analysts have cut their forward 12-month earnings' estimates by 3.6% since February, more than the 1.9% increases released in January. Some analysts expect China's recovery may not be enough to offset headwinds from weak global demand and supply constraints for export-reliant economies in the region.
"We think the primary drivers of Asian earnings downgrades are concerns about recession or a steep consumption slowdown in the developed markets, leading to Asian exporters' earnings estimates being revised down," said Manishi Raychaudhuri, Asia-Pacific head of equity research at BNP Paribas.
Regional trade data showed China's economic reopening has not boosted Asian exporters much so far. Taiwan's exports fell in February to the lowest in nearly 24 months, while South Korea reported a fifth month of export declines. March data showed South Korea's 20-day exports to China fell 36.2% year-on-year, while Taiwan's export orders to China slumped 48.3% in the first two months of this year, the biggest drop since early 2009.
US keep grabbing EU producers. Volkswagen AG said lucrative new US incentives for EV makers were just too good to pass up when weighing to pick a partner or build its own factory to make cars for the new Scout brand. The German manufacturer this month moved ahead with plans for a $2 billion factory in South Carolina to produce electric SUVs as part of Scout Motors Inc. The factory is due to open in 2026 and will eventually churn out 200,000 EVs annually. That convinced VW to break ground on its own facility on 1,600 acres near Columbia, South Carolina, which will employ 4,000 workers when it opens in 2026.
“We view it simplistically a little bit like the Gold Rush,” Scott Keogh, chief executive officer of the Scout brand said Monday, equating the 1849 California Gold Rush with the federal Inflation Reduction Act that provides incentives for domestically produced EVs. “There’s never been a better time to build a factory in America.”
Gold prices could surpass the record set at the height of the Covid-19 pandemic if ongoing turmoil in the banking sector persists and global central banks downshift their interest-rate hiking cycle, according to Sprott Inc., a top investor in the bullion industry.
“I certainly think we’re on our way to new highs,” Sprott’s Chief Executive Officer Whitney George said in an interview. After a market downturn, “the minute liquidity is restored back into the global market, gold seems to be always be the first thing to recover, and then often hits new highs.”
“For the lack of better words, our outlook is negative,” said Marko Kolanovic, the chief global markets strategist at JPMorgan Chase & Co. at a conference in Frankfurt, Germany, on Wednesday. As for positioning, Kolanovic advises investors to go more toward cash and short-term bonds where you get “paid to wait for the situation to clear up.”
BIS OUTLOOK ON THE US ECONOMY
This week we've got very interesting view on the US economy and banking crisis from the BIS. The conclusions are very grim for this decade's horizon, as a large burden of debt will drag the economy down. Briefly what their report is about:
Real (not nominal) GDP growth is economic activity that generates cash flows, where money is then invested or saved, or serves debt at the level of the entire economy. The average value of GDP growth in real terms is 1.75% and this figure continues to fall. That 1.75% goes to debt service first now (debt has priority) but all US debt is 220% of GDP (together with social obligations) So if interest rates on average 2%, then accrued interest payments will rise to 4,4% of GDP, giving a negative GDP growth of -2.65% per year.
That is, the higher the interest expenses, the more negative the GDP will be. To cover the costs, governments issued more debt, and 3.5 years later, when it came to refinancing, the debts were simply monetized through QE, leaving GDP growth only to cover private sector debt payments. In other words, without QE, there was not enough cash flow to service all of the systemic debt.
Why did QE run every 3.5 years? It's just the average maturity of public and private debt after 2009, when all the Central Banks of the West dropped their rates to zero.
Summary - The system in the US, EU, Japan, Britain will no longer be able to function without QE. The end of 2023 and the beginning of 2024 is the next debt refinancing period, and quantitative easing is needed again to finance it. If a new crisis arises, then large-scale QE.
The BIS estimates that the US Fed's balance sheet will rise to $12-14 trillion in a year or so. All new QE will certainly continue to devalue money, and increase the stratification of society, populism will grow stronger. In general, BIS draws a complete dead end, they believe that it is necessary to hold out until a jump in productivity or the creation of cheap energy sources.
Fears of tightening financial conditions leading to a recession are driving traders to rethink their risk exposure and seek out safety in the stock market.
“It ain’t pretty out there,” said Charlie McElligot, cross-asset strategist at Nomura Securities International. “The bank ‘profitability crisis’ has become a ‘solvency crisis,’ and will act as a catalyst for a substantial tightening impulse in financial conditions.”
OTHER THOUGHTS ON THE SUBJECT
In effect, the inflation fight is over. You don’t fight inflation by creating $300 billion out of thin air. But the Fed has concocted a scheme that will allow it to plausibly claim it is still in the inflation fight a little longer while simultaneously trying to minimize the negative impact of higher interest rates on the banks. Meanwhile, the banks can avoid the pain by accessing this crazy loan program. It is crazy because no sane person would make a loan based on the par value of the collateral. The value of the collateral is generally based on market value, plus a haircut to further protect the lender. By accepting collateral at face value, the Fed is effectively making unsecured loans. And this raises a question: what incentive do these banks have to ever pay this money back? If they default, they just lose some devalued bonds they don’t want anyway. It is highly likely these bad bonds will ultimately end up on the Fed’s balance sheet.
This looks a lot like a “kick the can down the road” scheme. It seems that Powell and Company are hoping this loan boondoggle will buy them time to keep tightening for a while longer in the hope that CPI will drop enough in the next couple of months to claim victory over inflation and then pivot without losing face. The Fed may have managed to get a finger in this hole, but it won’t be long before another hole appears. And then another. And then another. The question, in my mind, is where will the next hole manifest? And how will they plug that hole?
According to the W Post, the total capital buffer in the US banking system totals $2.2 trillion. Meanwhile, total unrealized losses in the system based on a pair of academic papers is between $1.7 and $2 trillion. In other words, if banks were suddenly forced to liquidate their bond and loan portfolios, the losses would erase between 77 percent and 91 percent of their combined capital cushion. It follows that large numbers of banks are terrifyingly fragile.”
As you understand, it is no big difference in the end - wether bank will collapse of Fed just will print money. Effect in long term anyway will be negative. So, the the Federal Reserve is trying to walk a tightrope — in a hurricane. With that hole in the dam seemingly plugged for the time being, the Fed pushed forward and raised interest rates by another 25 basis points at its March meeting. In effect, the bank bailout ended the inflation fight while allowing the Fed to continue the pretense of an inflation fight for a little while longer. What is particularly unique to the 2023 liquidity crisis is that the toxins are no longer about sub-prime credits, but the UST market, allegedly the most important and safe bond instrument in the world. The so-called “risk-free-returns” of Uncle Sam’s infamous IOUs are nothing more than “return-free-risk” thanks to the Fed’s overly high and rapid rate hike policies of 2022. What lies ahead is more consolidation among the larger banks and more centralization by the Fed over the banking system, as evidenced by the slow-creep toward CBDC and the Fed Now program to launch this year.
By opinion of Egon von Greyerz, the solidity of the banking system is based on confidence. With the fractional banking system, highly leveraged banks only have a fraction of the money available if all depositors ask for their money back. So when confidence evaporates, so do the balance sheets of the banks and depositors realise that the whole system is just a black hole. And this is exactly what is about to happen. For anyone who believes that this is just a problem with a few smaller US banks and one big one (Credit Suisse), they must think again.
The SNB is of course in a mess itself, having lost $143 billion in 2022. The SNB balance sheet is bigger than Swiss GDP and consists of currency speculation and US tech stocks. This central bank is the world’s biggest hedge fund and the least successful. But the Swiss banking system is very unsound, just like the rest of the world’s. A central bank which is bigger than the country’s GDP is extremely unsound. And a banking system which is 5x Swiss GDP makes it too big to save.
Although the Fed and ECB are much smaller in relation to their countries’ GDP than the SNB, these two central banks will soon discover that their assets of around $8 trillion each are grossly overvalued. With a global banking system on the verge of a systemic failure, Central Bankers and bankers have been working around the clock this weekend to temporarily avoid the inevitable collapse of the bankrupt financial system.
“2023 is likely to be the year of gold. Both fundamentally and technically gold looks like it will make major up moves this year.” And at the end of this article, I explain the importance of how and where gold should be held:“PREPARE FOR 10 YEARS OF GLOBAL DESTRUCTION.” “So my own preference would be to own physical gold and silver that only I have direct control of and can withdraw or sell with very short notice. It is also important to deal with a company that can move your metals at very short notice if the security or geopolitical situation would necessitate it.”
In February 2019 I wrote about what I called the Gold Maginot Line which had held for 6 years below $1,350. This is typical for gold. Having gone from $250 in 1999 to $1,900 in 2011, it then spent 8 years in a correction. At the time I forecast that the Maginot Line would soon break which it did and swiftly moved to $2,000 by August 2020. We have now had another period of consolidation since then and the next move above $2,000 and towards $3,000 is imminent.
Conclusion:
So, currently we have absolutely stunning combination of factors that are developing too fast. Not just economical but political either, and even in a higher degree. Our view is not too far from BIS conclusion. Yesterday we've said that expect new QE at least around $1.5-4 Trln. Using just a common sense, we could acknowledge with 100% confidence that Fed can't not to print. It has to print, that's all. Just because banks earn just around 3-3.5% on long-term investments, including long-term loans to real economy sector but have to pay above 4%, even on new BTFD (Buy This F**ng Debt) programme. Banks have no money for this - their interest margin is below the par for now. But this is only about banking sector. We have also mortgage loans exposure and, what is even greater - government debt problems, which have to be refinanced, paid out interest etc. We can't avoid new inflation spiral, and lower real interest rates.
Separate topic is a loss of confidence to regulatory authorities. Yesterday we've clearly shown that the Fed is loosing market's trust. We're not sure but it is highly likely that US Ministry of Justice will punish CS/UBS as a result of probe of relation to Russian Oligarchs. Switzerland that has frozen ~ $20 Bln by US Sanctions now is accused by the US that they do not fill them. For now the "small" penalty, even for $2Bln could destabilize system. So, we're living like on volcane - nobody nows where the next boom comes. Meantime, demand for gold is rising - Call/Put ratio breaks all highs:
In current situation, investors are totally disoriented. Where to run, what to do etc? The one thing we could say definitely - Fed has started crisis not to make stock holders and crypto investors happy. They will grab all liquidity that they could, just to safe own funds. Most probable by holding rates high or by breaking markets expectations on soon policy ease.
Some investors suggest that whatever collapse or inflation will come - gold market hardly will be attractive just because of high interest rates environment, and it can't be rival to short-term US Bills. We could argue that the real rate what is really matter and it tends to remain negative. Second - we're coming to environment when return of the investment becomes more important than return on the investment. Due to political processes external dollar devaluation is already in progress. Besides, we should not forget about economical crisis, economy slowdown and real sector depreciation. All these moments will bring toxic fruits. Gold performance could be volatile in nearest months, but more and more signs come in favor of real upside performance.
