Sive Morten
Special Consultant to the FPA
- Messages
- 18,771
Fundamentals
This week price performance could be described as "big expectations" with "minor results". The whole week market was preparing to NFP release but numbers have made no big impact as on price action as on sentiment. Friday action on gold by the way is an excellent example why it is very tricky thing to trade releases of major statistics data. Anyway, this week market sentiment has improved slightly but it is not argued that overall situation now has become strongly bullish. Yesterday we've discussed in depth current fundamental background. And come to conclusion that dollar should keep leadership on FX market. This brings nothing good to gold as well, especially on a background of rising interest rates.
Market overview
Gold steadied on Thursday, buoyed by a slight dip in the dollar, but held a tight range as investors steered clear of big bets before U.S. jobs data that could give the Federal Reserve more fuel to wind down economic support measures.
Data on Wednesday showed that U.S. private payrolls increased more than expected in September as COVID-19 infections started subsiding, boosting hiring at restaurants and other high-contact businesses.
The U.S. Senate appeared near to a temporary deal to avert a federal debt default in the next two weeks, after Democrats said they might accept a Republican proposal to defuse the partisan standoff that threatens the broader economy.
The dollar eased, but traded near a one-year high, buoyed by lingering inflation concerns and expectations the Fed would have to act sooner to normalise policy.
While gold is traditionally considered an inflation hedge, a stronger dollar makes gold more expensive for holders of other currencies.
A strong showing of private jobs in September ahead of Friday’s employment numbers encouraged bets that the Fed could start tapering soon.
Reduced stimulus and higher interest rates lift bond yields, translating into increased opportunity costs of holding non-yielding bullion.
Gold also seemed to have found some support on comments from an advisor that a default on China Evergrande’s offshore bond obligations was “imminent”.
Fed Chair Jerome Powell said it would take one more “decent” jobs report to set the process in motion for a reduction in U.S. central bank’s $120 billion in monthly bond purchases.
However, some analysts see gold’s outlook tilted to the downside, as the Fed may eventually hike interest rates regardless. Reduced stimulus and higher interest rates lift bond yields, translating into increased opportunity costs of holding bullion, which pays no interest. While safe-haven gold will find some support from elevated inflation, geopolitical tensions and rising Delta coronavirus cases, factors including Fed tapering, easing pandemic restrictions and strong growth will cap prices, Fitch Solutions said in a note dated Oct. 7.
Gold pared gains on Friday after rising more than 1% on U.S. jobs data miss, as investors came to terms with the possibility the Federal Reserve could still have enough fodder to wean the economy off stimulus this year.
U.S. employers added just 194,000 jobs in September, well below expectations. But upward revisions to prior months’ data mean the economy has now made up for half of the jobs deficit it faced in December.
Gold was also caught between headwinds from higher U.S. Treasury yields, and some support from a slightly weaker dollar.
The gold market now seems to expect a tapering announcement at some point this year, said Standard Chartered analyst Suki Cooper. “However, the downside appears well-supported, given the demand response from the physical market.”
· According to a survey by the World Gold Council, almost 80% of central bank reserve managers plan to increase their gold holdings over the next year
· Given that new gold supply is highly constrained, prices could reach new highs if inflation proves to be sticky rather than “transitory”
During the first half of 2021, garnering impressive investment results was only slightly more challenging than shooting fish in a barrel. Global equities and commodities enjoyed their fifth best six-month rolling returns in a century, with oil as the top performer (up 51.4%). By contrast, 10-Year U.S. Treasuries fell 24% in Q1, marking their worst quarter on record.
“Reflation” trades were rewarded, but traditional inflation hedges were not. Gold fell by 6.5% in H1 as investors, particularly in the U.S., dumped their holdings of the precious metal. $8.5 billion of outflows were recorded by U.S. gold-backed ETFs. However, since then, the investment backdrop has become more nuanced. Asset allocation in H2 might prove to be more difficult.
Fiscal Policy Factors In
The reflation narrative reflected the success of the COVID-19 vaccination rollout, paired with monetary and fiscal largesse. This combination led strategists to predict a V-shaped recovery as the global economy hit the reset button. Inflation prints came in higher than central bank targets, but 72% of investors in the June Bank of America Global Fund Manager survey believed the repeated reassurances of policymakers that this inflation was “transitory.”
In both June and July, U.S. CPI recorded 5.4% increases. In the eurozone, PPI rose a record 10.2% year-over-year. Monetarists would argue we are now seeing the lagged effects of unprecedented stimulus. In April 2020 alone, U.S. M3 (aka broad money) rose by 7.3%, a figure higher than any full year over the previous decade. S&P reports that government spending has increased by the equivalent of 13% of global GDP.
Fiscal policy has become a significant driver of aggregate demand. President Biden’s $1.4 trillion of infrastructure spending and the European Union’s Green Deal at $1 trillion are two examples. These initiatives require labor. But just as inflation has been dismissed as transitory, the tightness in labor markets in the U.S. and the UK are regarded as short-term and frictional.
The Role of Labor
However, labor has an increasingly loud political voice. Supply chain bottlenecks in the wake of COVID-19 also suggest that the inexorable rise of offshoring and globalization will slow. The Phillips curve, which measures the relationship between prices, wages and output fell into disuse in the 2000s. But labor compensation as a share of U.S. GDP has begun to tick up.
Has the “death” of the Phillips curve been greatly exaggerated?
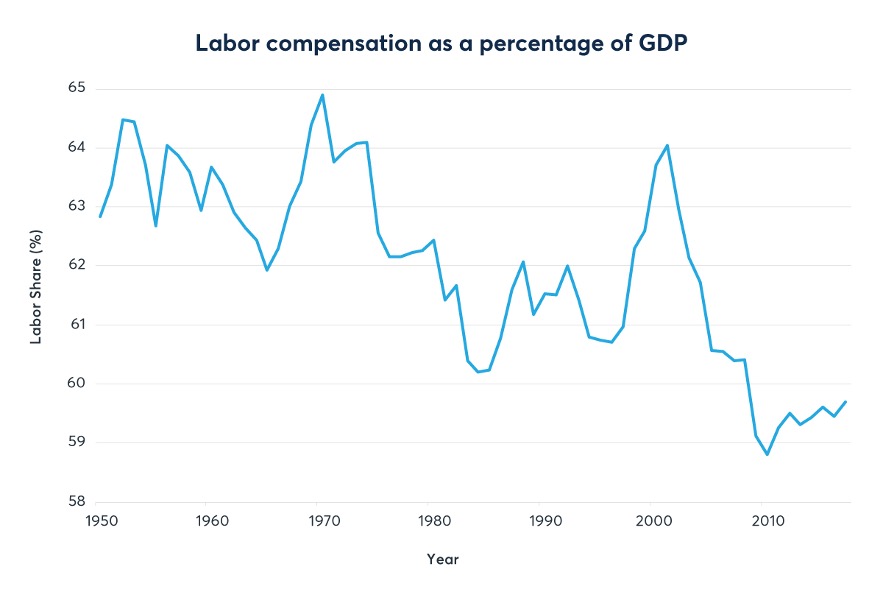
Source: Federal Reserve Bank of St. Louis
If policymakers are wrong and inflation proves sticky, gold is likely to move up the asset allocation agenda during the remainder of 2021. The opportunity cost of owning (zero-yielding) gold vs. 10-year U.S. Treasuries has only been lower in the last decade at the height of the COVID-19 pandemic between February 2020 and 2021.
In August 2020, the price of gold rose to new records, heading above $2000 per ounce. Globally, one-quarter of all bonds still have a negative yield (German bunds out to 30-years) and only one-third have a yield higher than 1%. India was eclipsed by Germany as the second biggest retail market for gold in H1, but Indian investors are returning as COVID-19 slowly abates. Current active cases there are at their lowest level since March 2020.
The latest Commitments of Traders report from the CFTC shows short gold (and silver) positions are being cut. Improving sentiment and changing positioning look likely to provide short-term support for gold.
Supply and Demand at a Tipping Point
Between 2001 and 2011, the price of gold surged from $225 per ounce to $1906 per ounce. This was accompanied by a record M&A ($38 billion in 2011) and capital expenditure binge. Since then, capex has fallen by 70%. Gold exploration budgets hit $10.8 billion in 2012, but gold discoveries (206 million oz.) peaked six years earlier. Since 2006, there have only a handful of new mines with potential reserves greater than 6 million oz. that have come on stream.
Cost cutting has forced miners to focus on brownfield sites, and existing reserves are rapidly being depleted. The Witwatersrand Basin in South Africa has produced approximately 40% of all the gold ever mined, but current production is around one-tenth of its peak in the 1970s. Reserves at many of the world’s biggest mines – Mponeng in South Africa, Carlin Trend in the U.S., and the Super Pit in Australia – are in decline.
Mark Bristow, the CEO of Barrick Gold, the second biggest miner, said in August that “the gold mining industry’s chronic tendency to harvest the gold price instead of investing in the future has resulted in declining reserves and a shortage of high-quality development projects.”
Perhaps the biggest support of all for gold is likely to come from central banks. At the turn of the century, the U.S. dollar made up 73% of reserves in the IMF’s COFER database. That has fallen to less than 60%. The share of Chinese renminbi and the euro have grown modestly, but the strong capital preservation characteristics of gold enable reserve managers to sell their dollars while waiting to see if a true competitor to the U.S. dollar will emerge from the challenging pack.
The Bank of Thailand purchased 90 tons of gold in April and May, increasing its holdings by 60%. The central banks of Brazil and Hungary have also been active, and Russia added to its gold holdings in July for the first time since June 2020. Almost 80% of reserve managers plan to increase their gold holdings over the next year, according to a survey by the World Gold Council.
This long-term support for gold prices from central bank buyers could provide a floor above $1700, given that new supply is highly constrained. If inflation remains stuck above policy targets, asset allocators will be forced to reconsider the traditional role of gold as a hedge. That would help gold regain its luster and could move prices higher.
COT Report
Sentiment this week doesn't encourage too much. Although we have some positive shifts but all of them are humble. CFTC data shows solid contraction of speculative short positions that leads to jump in net long total position. But open interest has changed just barely. Precious metals funds this week faced outflows of a net $188 million. Besides, SPDR Fund statistics doesn't support the change in sentiment showing outflows this week. It means that positive shifts are probably very short-term, due some rebalancing of speculative positions, or maybe preparation to NFP release.

Source: cftc.gov

Source: cftc.gov, charting by Investing.com

Source: SPDR Fund, FPA
Mostly guys the result of this week I would summed up by the phrase above -
Speaking about recent NFP - indeed, by looking in-depth on numbers, you could find that it was not as bad. Yes, headline numbers are poor, but last month numbers were revised up, second, private sector has shown good payrolls and drop in numbers mostly was due government employment. Finally, unemployment has dropped to 4.8% and what is more important - wage inflation is jumped. This explains sharp downside reversal on Friday's trading session.
In CME opinion above, Andrew Capon talks about important things, and they definitely play some role in gold performance. But mostly he appeals to physical demand and inflation. But physical demand is not a driving factor for cyclical fluctuations. Physical demand stands stable and changes slowly around 5-6 thousand tonnes per year. Most part of physical gold is distributed by pre-orders to mining companies. Very often they are domestic, such as in Russia government buys gold from Norilsky Nickel. Second - inflation should be treated differently. In BlackRock analysis (that we've placed in our weekly report few months ago) they said that it is very low correlation with common viewed inflation, such as PPI, PCE, CPI or even interest rates yield. This is artificial inflation, triggered by amplitude of the cycles around average speed of money value depreciation. Gold protects from this average devaluation on very long term perspective, but makes poor job against cyclical fluctuations.
The interest rates is the real driver for gold price. But in the short-term perspective it is very few reasons to be positive on this subject. Among analysts who answered an additional question on whether the greenback's strength was at an inflection point, a near 60% majority of analysts, 29 of 48, said no. Asked when that point would be reached, only a handful expected it to come this year. The remaining majority gave a timeline ranging between early 2022 to end-2024.
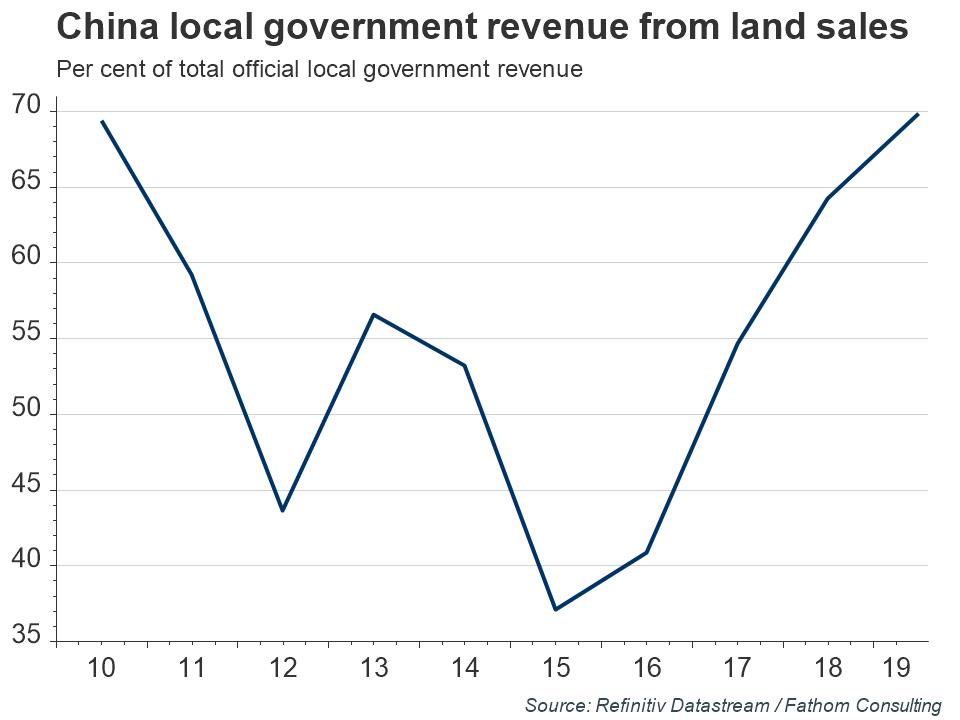
The only thing that could change situation drastically is unexpected factors, or temporary muted ones, such as spillovers from Evergrande. Local governments sells big squares of lands to accumulate liquidity as economy is slowing down. If effect spreads globally this could help gold. But for now we could speak about it only as hypothesis that has just probability to happen but not as real fact:
China’s economy had already been slowing before the recent intensification of the woes surrounding real estate developer Evergrande. A key focus for investors is the extent of the latter’s spillover to the broader housing market and economy. In August, floor space of newly started residential buildings fell by 1.7% on a year-on-year basis, while the land area acquired by real estate developers fell by around 10%. Sales of land are a crucial source of funds for local governments, equivalent to around 70% of their official revenues in 2019. So far, house price growth has slowed but has not moved into negative territory at a national level. Overall, policy is clearly less supportive of the housing market at the present time. Going forward, however, if growth were to slow too much, particularly ahead of next year’s 20th National Congress, policymakers could be tempted to relent and fire up this tried and tested tool to boost the economy.
Monthly
Long-term charts are not very interesting to us right now as recent price action barely impacts on the long-term picture. Price mostly stands in the same area where it has been for the whole month. On a technical side, we have few bearish moments that suggest deeper action, but, in general, market stands in very small pullback from ATH comparing to the scale of the rally. Market again shows problems with breaking through YPP. We have three equal tops month by month around YPP. It means that somewhere around 1835-1836 big selling orders hold gold from further upward action.
In a shorter-term everything is based on August huge trading range. With the more information from the Fed, we suggest that sentiment becomes more bearish and action to 1650 support area gets more chances to happen in near term. Next target is YPS1 at 1540$.
At the same time, as we've mentioned before, in long term scale price action has the features of retracement, forming big flag consolidation with choppy action inside and standing above nearest 3/8 Fib level. This type of action is difficult to call as strong bearish reversal, at least for now.

Weekly
Weekly trend remains bearish and we do not have reasons to change our view by far, despite recent pullback. Weekly time frame shows patterns and scenarios that theoretically are possible here. Gold very accurately follows to scenario that we've suggested a month ago. Here we have two important details. First is - gold inability to reach the upper border of triangle and early turn down. Since the drop is strong, we could say that this is real early reversal and hardly gold returns back to hit the triangle line. The most interesting thing now is what performance we get next week on daily chart and the degree of impact on higher time frames.
Recent week gives us indecision type of action and next step mostly depends on the direction of the breakout.

Daily
Gold still keeps bullish context on daily chart, but we need to consider few details that significantly makes it weaker and suggest that it would be better to not rely on it right now. First of all, daily performance is retracement in the light of weekly bearish tendency. And with the type of price action that we've got on Friday, that almost looks like bearish reversal session - context looks tricky. Besides, daily picture is better to analyze together with interest rates chart, because it shows real market reaction on NFP release.

Interest rates are totally ignored negative component and shows the real treatment - rates jump to 1.62%, completing our XOP target. On a way up market has broken 5/8 Fib resistance. Trend on all time frames stand bullish and we see acceleration - this is big hint that we should see higher levels soon.

Intraday
As a result of Friday's session we indeed have got butterfly pattern that is reversed down very fast. Price returns back in broken range and we've got huge bearish engulfing pattern, accompanied by W&R. This lets us to consider ultimate butterfly extension targets that could lead us back to 1720 $. In current circumstances we think it would be better to stay aside from taking any long positions by far. Scalp shorts could be considered on a pullback with stops above 1783 top.

This week price performance could be described as "big expectations" with "minor results". The whole week market was preparing to NFP release but numbers have made no big impact as on price action as on sentiment. Friday action on gold by the way is an excellent example why it is very tricky thing to trade releases of major statistics data. Anyway, this week market sentiment has improved slightly but it is not argued that overall situation now has become strongly bullish. Yesterday we've discussed in depth current fundamental background. And come to conclusion that dollar should keep leadership on FX market. This brings nothing good to gold as well, especially on a background of rising interest rates.
Market overview
Gold steadied on Thursday, buoyed by a slight dip in the dollar, but held a tight range as investors steered clear of big bets before U.S. jobs data that could give the Federal Reserve more fuel to wind down economic support measures.
Data on Wednesday showed that U.S. private payrolls increased more than expected in September as COVID-19 infections started subsiding, boosting hiring at restaurants and other high-contact businesses.
The U.S. Senate appeared near to a temporary deal to avert a federal debt default in the next two weeks, after Democrats said they might accept a Republican proposal to defuse the partisan standoff that threatens the broader economy.
The dollar eased, but traded near a one-year high, buoyed by lingering inflation concerns and expectations the Fed would have to act sooner to normalise policy.
While gold is traditionally considered an inflation hedge, a stronger dollar makes gold more expensive for holders of other currencies.
“There are some hiccups related to supply chain and energy markets, but this is not something that will derail the global economy. Hence, there are no real reasons for investors to seek gold as a safe haven,” said Julius Baer analyst Carsten Menke. However, given the “record high” number of open job positions in the United States, a “positive surprise on the non-farm payrolls should be adjustable for the gold market without causing a major sell-off”, Menke said, adding prices are likely to be volatile.
A strong showing of private jobs in September ahead of Friday’s employment numbers encouraged bets that the Fed could start tapering soon.
Gold market participants seem to be currently “buying on the dips”, Commerzbank commodities analyst Carsten Fritsch said.
Reduced stimulus and higher interest rates lift bond yields, translating into increased opportunity costs of holding non-yielding bullion.
“We’ll need to see gold prices break above major resistance levels before we have a better idea if gold is about to end its short-term bearish trend,” said Vincent Tie, sales manager at Singapore dealer Silver Bullion.
Gold also seemed to have found some support on comments from an advisor that a default on China Evergrande’s offshore bond obligations was “imminent”.
Fed Chair Jerome Powell said it would take one more “decent” jobs report to set the process in motion for a reduction in U.S. central bank’s $120 billion in monthly bond purchases.
If data overshoots to the upside, gold could face a knee-jerk downward reaction as bond yields would probably rise, but “a miss would be supportive for gold as the word ‘stagflation’ is increasingly appearing on the radar and gold benefits from risk-aversion”, O’Connell added.
However, some analysts see gold’s outlook tilted to the downside, as the Fed may eventually hike interest rates regardless. Reduced stimulus and higher interest rates lift bond yields, translating into increased opportunity costs of holding bullion, which pays no interest. While safe-haven gold will find some support from elevated inflation, geopolitical tensions and rising Delta coronavirus cases, factors including Fed tapering, easing pandemic restrictions and strong growth will cap prices, Fitch Solutions said in a note dated Oct. 7.
Gold pared gains on Friday after rising more than 1% on U.S. jobs data miss, as investors came to terms with the possibility the Federal Reserve could still have enough fodder to wean the economy off stimulus this year.
U.S. employers added just 194,000 jobs in September, well below expectations. But upward revisions to prior months’ data mean the economy has now made up for half of the jobs deficit it faced in December.
Gold gained sharply as the data at first appeared to be downbeat, but internals of the report seemed “overall to be not so bad,” said Jim Wyckoff, senior analyst at Kitco Metals. This drove expectations that the Fed will “continue on its path of wanting to taper monetary policy sooner, rather than later,” leading to the retreat in gold, although yet another poor jobs report next month could change that, Wyckoff added.
Gold was also caught between headwinds from higher U.S. Treasury yields, and some support from a slightly weaker dollar.
The gold market now seems to expect a tapering announcement at some point this year, said Standard Chartered analyst Suki Cooper. “However, the downside appears well-supported, given the demand response from the physical market.”
“For the gold narrative to really pick up again, we’d need an impulsive rally above $1,950-60, or the pre-COVID-vaccine-highs and that would require a significant catalyst not in the market right now,” said a New-York based precious metals trader.
Author: Andrew Capon, CME Group on Gold perspective
AT A GLANCE· According to a survey by the World Gold Council, almost 80% of central bank reserve managers plan to increase their gold holdings over the next year
· Given that new gold supply is highly constrained, prices could reach new highs if inflation proves to be sticky rather than “transitory”
During the first half of 2021, garnering impressive investment results was only slightly more challenging than shooting fish in a barrel. Global equities and commodities enjoyed their fifth best six-month rolling returns in a century, with oil as the top performer (up 51.4%). By contrast, 10-Year U.S. Treasuries fell 24% in Q1, marking their worst quarter on record.
“Reflation” trades were rewarded, but traditional inflation hedges were not. Gold fell by 6.5% in H1 as investors, particularly in the U.S., dumped their holdings of the precious metal. $8.5 billion of outflows were recorded by U.S. gold-backed ETFs. However, since then, the investment backdrop has become more nuanced. Asset allocation in H2 might prove to be more difficult.
Fiscal Policy Factors In
The reflation narrative reflected the success of the COVID-19 vaccination rollout, paired with monetary and fiscal largesse. This combination led strategists to predict a V-shaped recovery as the global economy hit the reset button. Inflation prints came in higher than central bank targets, but 72% of investors in the June Bank of America Global Fund Manager survey believed the repeated reassurances of policymakers that this inflation was “transitory.”
In both June and July, U.S. CPI recorded 5.4% increases. In the eurozone, PPI rose a record 10.2% year-over-year. Monetarists would argue we are now seeing the lagged effects of unprecedented stimulus. In April 2020 alone, U.S. M3 (aka broad money) rose by 7.3%, a figure higher than any full year over the previous decade. S&P reports that government spending has increased by the equivalent of 13% of global GDP.
Fiscal policy has become a significant driver of aggregate demand. President Biden’s $1.4 trillion of infrastructure spending and the European Union’s Green Deal at $1 trillion are two examples. These initiatives require labor. But just as inflation has been dismissed as transitory, the tightness in labor markets in the U.S. and the UK are regarded as short-term and frictional.
The Role of Labor
However, labor has an increasingly loud political voice. Supply chain bottlenecks in the wake of COVID-19 also suggest that the inexorable rise of offshoring and globalization will slow. The Phillips curve, which measures the relationship between prices, wages and output fell into disuse in the 2000s. But labor compensation as a share of U.S. GDP has begun to tick up.
Has the “death” of the Phillips curve been greatly exaggerated?
Source: Federal Reserve Bank of St. Louis
If policymakers are wrong and inflation proves sticky, gold is likely to move up the asset allocation agenda during the remainder of 2021. The opportunity cost of owning (zero-yielding) gold vs. 10-year U.S. Treasuries has only been lower in the last decade at the height of the COVID-19 pandemic between February 2020 and 2021.
In August 2020, the price of gold rose to new records, heading above $2000 per ounce. Globally, one-quarter of all bonds still have a negative yield (German bunds out to 30-years) and only one-third have a yield higher than 1%. India was eclipsed by Germany as the second biggest retail market for gold in H1, but Indian investors are returning as COVID-19 slowly abates. Current active cases there are at their lowest level since March 2020.
The latest Commitments of Traders report from the CFTC shows short gold (and silver) positions are being cut. Improving sentiment and changing positioning look likely to provide short-term support for gold.
Supply and Demand at a Tipping Point
Between 2001 and 2011, the price of gold surged from $225 per ounce to $1906 per ounce. This was accompanied by a record M&A ($38 billion in 2011) and capital expenditure binge. Since then, capex has fallen by 70%. Gold exploration budgets hit $10.8 billion in 2012, but gold discoveries (206 million oz.) peaked six years earlier. Since 2006, there have only a handful of new mines with potential reserves greater than 6 million oz. that have come on stream.
Cost cutting has forced miners to focus on brownfield sites, and existing reserves are rapidly being depleted. The Witwatersrand Basin in South Africa has produced approximately 40% of all the gold ever mined, but current production is around one-tenth of its peak in the 1970s. Reserves at many of the world’s biggest mines – Mponeng in South Africa, Carlin Trend in the U.S., and the Super Pit in Australia – are in decline.
Mark Bristow, the CEO of Barrick Gold, the second biggest miner, said in August that “the gold mining industry’s chronic tendency to harvest the gold price instead of investing in the future has resulted in declining reserves and a shortage of high-quality development projects.”
Perhaps the biggest support of all for gold is likely to come from central banks. At the turn of the century, the U.S. dollar made up 73% of reserves in the IMF’s COFER database. That has fallen to less than 60%. The share of Chinese renminbi and the euro have grown modestly, but the strong capital preservation characteristics of gold enable reserve managers to sell their dollars while waiting to see if a true competitor to the U.S. dollar will emerge from the challenging pack.
The Bank of Thailand purchased 90 tons of gold in April and May, increasing its holdings by 60%. The central banks of Brazil and Hungary have also been active, and Russia added to its gold holdings in July for the first time since June 2020. Almost 80% of reserve managers plan to increase their gold holdings over the next year, according to a survey by the World Gold Council.
This long-term support for gold prices from central bank buyers could provide a floor above $1700, given that new supply is highly constrained. If inflation remains stuck above policy targets, asset allocators will be forced to reconsider the traditional role of gold as a hedge. That would help gold regain its luster and could move prices higher.
COT Report
Sentiment this week doesn't encourage too much. Although we have some positive shifts but all of them are humble. CFTC data shows solid contraction of speculative short positions that leads to jump in net long total position. But open interest has changed just barely. Precious metals funds this week faced outflows of a net $188 million. Besides, SPDR Fund statistics doesn't support the change in sentiment showing outflows this week. It means that positive shifts are probably very short-term, due some rebalancing of speculative positions, or maybe preparation to NFP release.
Source: cftc.gov
Source: cftc.gov, charting by Investing.com
Source: SPDR Fund, FPA
Mostly guys the result of this week I would summed up by the phrase above -
Indeed market for the long term stands in narrow range and recent performance is difficult to call positive. Market strongly needs powerful driving factor, or catalysts, as it is said above to move from dead point. The second statement is also correct. Trading range now is rather wide indeed and to confirm starting of the new trend market stands in desperate need of significant rally, maybe above 1950$.“For the gold narrative to really pick up again, we’d need an impulsive rally above $1,950-60, or the pre-COVID-vaccine-highs and that would require a significant catalyst not in the market right now,” said a New-York based precious metals trader.
Speaking about recent NFP - indeed, by looking in-depth on numbers, you could find that it was not as bad. Yes, headline numbers are poor, but last month numbers were revised up, second, private sector has shown good payrolls and drop in numbers mostly was due government employment. Finally, unemployment has dropped to 4.8% and what is more important - wage inflation is jumped. This explains sharp downside reversal on Friday's trading session.
In CME opinion above, Andrew Capon talks about important things, and they definitely play some role in gold performance. But mostly he appeals to physical demand and inflation. But physical demand is not a driving factor for cyclical fluctuations. Physical demand stands stable and changes slowly around 5-6 thousand tonnes per year. Most part of physical gold is distributed by pre-orders to mining companies. Very often they are domestic, such as in Russia government buys gold from Norilsky Nickel. Second - inflation should be treated differently. In BlackRock analysis (that we've placed in our weekly report few months ago) they said that it is very low correlation with common viewed inflation, such as PPI, PCE, CPI or even interest rates yield. This is artificial inflation, triggered by amplitude of the cycles around average speed of money value depreciation. Gold protects from this average devaluation on very long term perspective, but makes poor job against cyclical fluctuations.
The interest rates is the real driver for gold price. But in the short-term perspective it is very few reasons to be positive on this subject. Among analysts who answered an additional question on whether the greenback's strength was at an inflection point, a near 60% majority of analysts, 29 of 48, said no. Asked when that point would be reached, only a handful expected it to come this year. The remaining majority gave a timeline ranging between early 2022 to end-2024.
As a bottom line, with current sentiment level that we have by COT report and with the interest rates dynamic when they stand around 1.62% it is difficult to count on something stunning. Overall situation stands not very friendly to the gold. But, as overall fundamental environment does not put too strong limitations on gold, we could keep getting some short-term bullish setups on daily and intraday charts. But our answer is definitely "No" if you would ask us about long term gold investments right now."The market in the near term is going to focus on the fact that we expect U.S. Treasury yields to keep rising on the back of the Fed's tapering of QE and also the ongoing recovery in the U.S. economy," said Tai Hui, chief Asia market strategist at JP Morgan Asset Management.
The only thing that could change situation drastically is unexpected factors, or temporary muted ones, such as spillovers from Evergrande. Local governments sells big squares of lands to accumulate liquidity as economy is slowing down. If effect spreads globally this could help gold. But for now we could speak about it only as hypothesis that has just probability to happen but not as real fact:
China’s economy had already been slowing before the recent intensification of the woes surrounding real estate developer Evergrande. A key focus for investors is the extent of the latter’s spillover to the broader housing market and economy. In August, floor space of newly started residential buildings fell by 1.7% on a year-on-year basis, while the land area acquired by real estate developers fell by around 10%. Sales of land are a crucial source of funds for local governments, equivalent to around 70% of their official revenues in 2019. So far, house price growth has slowed but has not moved into negative territory at a national level. Overall, policy is clearly less supportive of the housing market at the present time. Going forward, however, if growth were to slow too much, particularly ahead of next year’s 20th National Congress, policymakers could be tempted to relent and fire up this tried and tested tool to boost the economy.
Monthly
Long-term charts are not very interesting to us right now as recent price action barely impacts on the long-term picture. Price mostly stands in the same area where it has been for the whole month. On a technical side, we have few bearish moments that suggest deeper action, but, in general, market stands in very small pullback from ATH comparing to the scale of the rally. Market again shows problems with breaking through YPP. We have three equal tops month by month around YPP. It means that somewhere around 1835-1836 big selling orders hold gold from further upward action.
In a shorter-term everything is based on August huge trading range. With the more information from the Fed, we suggest that sentiment becomes more bearish and action to 1650 support area gets more chances to happen in near term. Next target is YPS1 at 1540$.
At the same time, as we've mentioned before, in long term scale price action has the features of retracement, forming big flag consolidation with choppy action inside and standing above nearest 3/8 Fib level. This type of action is difficult to call as strong bearish reversal, at least for now.
Weekly
Weekly trend remains bearish and we do not have reasons to change our view by far, despite recent pullback. Weekly time frame shows patterns and scenarios that theoretically are possible here. Gold very accurately follows to scenario that we've suggested a month ago. Here we have two important details. First is - gold inability to reach the upper border of triangle and early turn down. Since the drop is strong, we could say that this is real early reversal and hardly gold returns back to hit the triangle line. The most interesting thing now is what performance we get next week on daily chart and the degree of impact on higher time frames.
Recent week gives us indecision type of action and next step mostly depends on the direction of the breakout.
Daily
Gold still keeps bullish context on daily chart, but we need to consider few details that significantly makes it weaker and suggest that it would be better to not rely on it right now. First of all, daily performance is retracement in the light of weekly bearish tendency. And with the type of price action that we've got on Friday, that almost looks like bearish reversal session - context looks tricky. Besides, daily picture is better to analyze together with interest rates chart, because it shows real market reaction on NFP release.
Interest rates are totally ignored negative component and shows the real treatment - rates jump to 1.62%, completing our XOP target. On a way up market has broken 5/8 Fib resistance. Trend on all time frames stand bullish and we see acceleration - this is big hint that we should see higher levels soon.
Intraday
As a result of Friday's session we indeed have got butterfly pattern that is reversed down very fast. Price returns back in broken range and we've got huge bearish engulfing pattern, accompanied by W&R. This lets us to consider ultimate butterfly extension targets that could lead us back to 1720 $. In current circumstances we think it would be better to stay aside from taking any long positions by far. Scalp shorts could be considered on a pullback with stops above 1783 top.