Only Elliot Wave Analysis - SolidECN

EURUSD - Growth is possible.

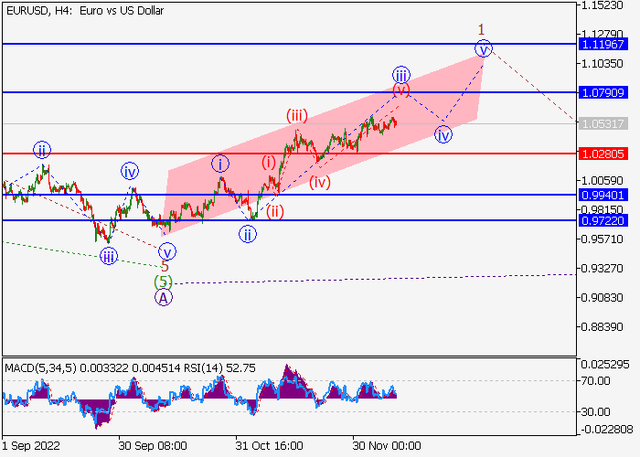
On the daily chart, the downward wave of the higher level А ended, within which the fifth wave (5) of А formed, and the development of the upward wave B started. Now, the first entry wave 1 of (А) of B is forming, within which the third wave of the lower level iii of 1 is developing.

If the assumption is correct, the EURUSD pair will grow to the area of 1.0790–1.1196. In this scenario, critical stop loss level is 1.0280.

eurusd.png
 
GBPUSD - Growth is possible.

On the daily chart, the downward fifth wave of the higher level 5 of (V) ended, within which the wave (5) of 5 formed, and the development of the upward first wave (1) started. Now, the third wave of the lower level 3 of (1) is forming, within which the wave iii of 3 has ended, and a local correction is forming as the wave iv of 3.

If the assumption is correct, the GBPUSD pair will grow to the area of 1.2590 – 1.2900. In this scenario, critical stop loss level is 1.1899.

gbpusd.png
 
USDJPY - A fall is possible.

On the daily chart, the third wave of the higher level 3 ended, and a downward correction forms as the fourth wave 4. Now, the wave of the lower level a of 4 is developing, within which the wave (v) of a is developing.

If the assumption is correct, the USDJPY pair will fall to the area of 133.20 – 127.36. In this scenario, critical stop loss level is 139.91.

usdjpy.png
 
AUDUSD - Growth is possible.

On the daily chart, the first wave of the higher level (1) formed, a downward correction ended as the second wave (2), and the third wave (3) develops, within which the first entry wave of the lower level i of 1 of (3) forms. Now, the wave (iii) of i is developing, within which the wave v of (iii) is developing.

If the assumption is correct, the AUDUSD pair will grow to the area of 0.7040 – 0.7142. In this scenario, critical stop loss level is 0.6584.

audusd.png
 
NZDUSD - Growth is possible.

On the daily chart, the upward wave of the higher level (А) formed, a downward correction ended as the wave (B), and the development of the wave (C) started. Now, the first entry wave of the lower level i of 1 of (C) is forming, within which the wave (iii) of i has formed, a local correction has ended as the wave (iv) of i, and the wave (v) of i is developing.

If the assumption is correct, the NZDUSD pair will grow to the area of 0.66 – 0.67. In this scenario, critical stop loss level is 0.6359.

nzdusd.png
 

USDCAD - Growth is possible.​

On the daily chart, the upward fifth wave of the higher level 5 and the wave (3) of 5 develop. Now, the third wave of the lower level 3 of (3) has formed, a downward correction has ended as the fourth wave 4 of (3), and the formation of the wave 5 of (5) has started, within which the wave i of 5 has ended, and the local correction ii of 5 is developing.

If the assumption is correct, the USDCAD pair will grow to the area of 1.3978 – 1.45. In this scenario, critical stop loss level is 1.3222.

usdcad.png
 
XAUUSD - The price is in a correction, a fall is possible.

On the daily chart, a downward correction ended as the fourth wave of the higher level (4), within which the wave C of (4) formed as a momentum, and the development of the fifth wave (5) started. Now, the first entry wave of the lower level 1 of (5) has formed, within which the wave v of 1 has developed, and a local correction has started as the second wave 2 of (5).

If the assumption is correct, the price of the asset will fall to the area of 1719.7 – 1695.85. In this scenario, critical stop loss level is 1824.

gold.png
 

XAGUSD - The price is in a correction and may grow.​

On the daily chart, a downward correction of the higher level ended as the second wave (2), and the third wave (3) develops, within which the first entry wave of the lower level 1 of (3) forms. Now, the wave iii of 1 has formed, and a local correction is developing as the wave iv of 1.

If the assumption is correct, the XAGUSD pair will grow to the area of 25 – 26. In this scenario, critical stop loss level is 21.82.

silver.png

 
Crude Oil - Growth is possible.

On the daily chart, the first wave of the higher level (1) formed, and a downward correction develops as the second wave (2), within which the wave А of (2) formed. Now, the development of wave B of (2) has started, within which the wave of the lower level a of B is developing.

If the assumption is correct, the asset will grow to the area of 93.25 – 100.5. In this scenario, critical stop loss level is 70.05.

oil.png
 
USDCHF - Growth is possible.

On the daily chart, the third wave of the higher level 3 develops, within which the upward first wave (1) of 3 formed, and a downward correction ended as the second wave (2) of 3. Now, the wave C of (2) has ended, and the development of the upward wave (3) of 3 is starting.

If the assumption is correct, the USDCHF pair will grow to the area of 0.99 – 1.0151. In this scenario, critical stop loss level is 0.9085.

usdchf.png
 
Back
Top