Sive Morten
Special Consultant to the FPA
- Messages
- 18,699
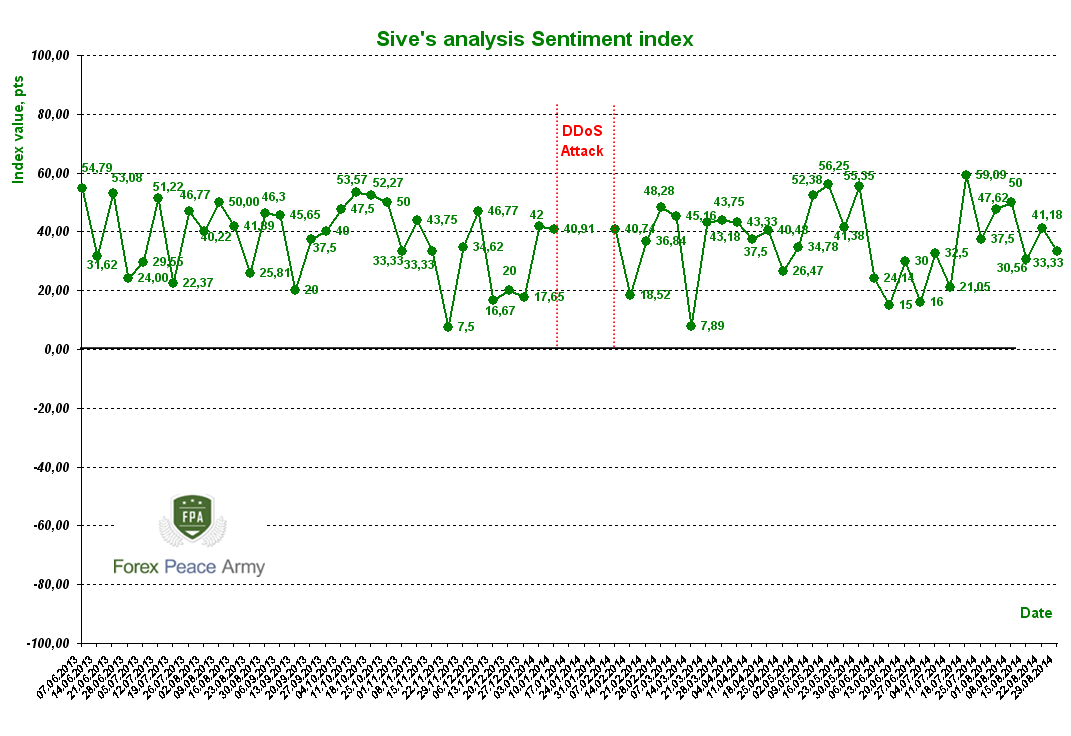
Chart shows the average gain/loss of our members that they've got on previous trading week on Sive's analysis. Profit/loss level is expressed not in natural value but as index value. The treatement of this index is the same as any survey index.
Index can fluctuate in [-100:+100] range.
1. Index value equals to "-100" means that on previous week our members have lost more than 100 pips on average due Sive's analysis and recomendations;
2. Index value in (-100:0) range means that on previous week our members have lost 1-100 pips on average due Sive's analysis and recomendations;
3.Index value equals to "0" means that on previous week our members have got flat result or earned/lost not due Sive's analysis;
4. Index value in (0:100) range means that on previous week our members have gained 1-100 pips on average due Sive's analysis and recomendations;
5. Index value equals to "+100" means that on previous week our members have earned more than 100 pips on average due Sive's analysis and recomendations.
Do not forget to take part in Survey by the end of each week!