Sive Morten
Special Consultant to the FPA
- Messages
- 18,659
Trade Description
November 27, 2009
November 27, 2009
You can follow my trading here.
Sive Morten Signals - Forex Trading Signals Test by Forex Peace Army
Today, I'm going to go over these two trades.
27 November, 2009. Sell EUR/USD 1.4904 t/p 1.4870 s/l 1.4903 (1,0 lot)
27 November 2009. Buy EUR/USD 1.4885 t/p 1.4970 s/l 1.4850 (0,5 lot)
Result – “179.00$” (closed at 1.4986)
Result – “425.00$” t/p
These were very interesting trades because they were based on directional signals, such as double penetration of moving average (Double Repo) and single penetration (Bread & Butter). So, let’s go through them.
1. Bread and Butter trade.
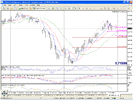
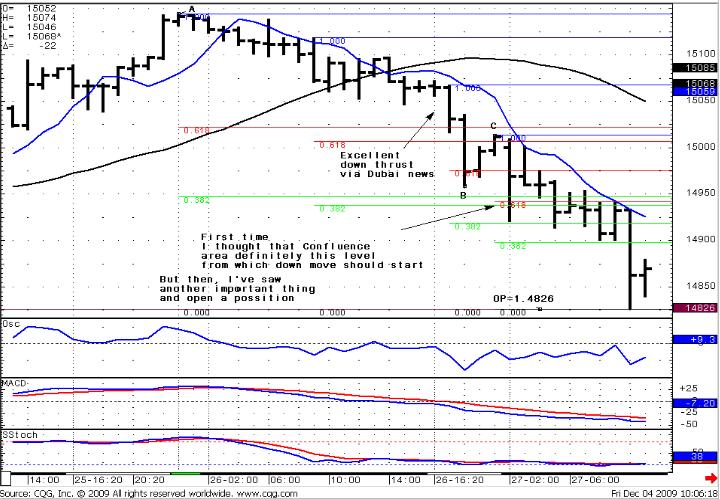
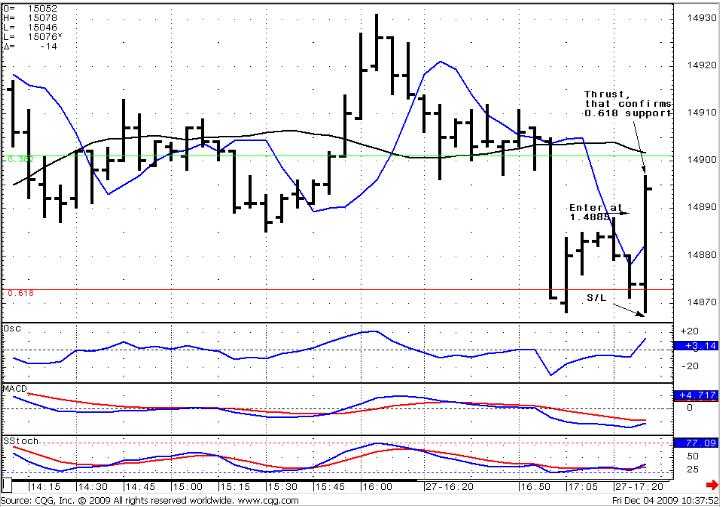
This was an 1 hour context – 5 min entry trade and context for this trade was as follows. Look at the 1-hour chart – we had an excellent down thrust move, market has reached an OP (maybe there was even an Agreement with Fib support, I don’t remember precisely) and stared retracement:
1-hour chart
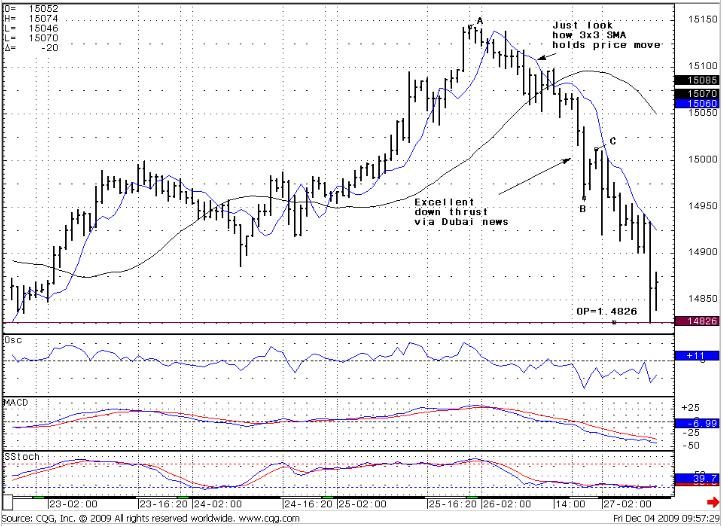
So the basic entry for this kind of trade is a moment that the market should continue down move after a retracement higher, with great probability because of the strong down thrust. It’s like a momentum of the market. At least till the 0.618 Fib level of the whole back move. When the retracement has started, there is just one thing left – I had to find the Fib. Resistance level where price should reverse down and I could start my short trade. There were a lot of Fib levels, so which one I had to choose? I’ve chose Fib confluence area first, but then I’ve saw that price didn’t reach this Fib confluence resistance at 1.4939-1.4941 and had showed a Wash & Rinse of another Fib resistance level at 1.4920. This was my signal to enter. Target, as I say, is 0.618 support from the whole up retracement – 1.4867 level. Let’s see, what had happened then… (look at 5-min chart)
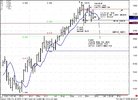
1-hour chart
20-min chart
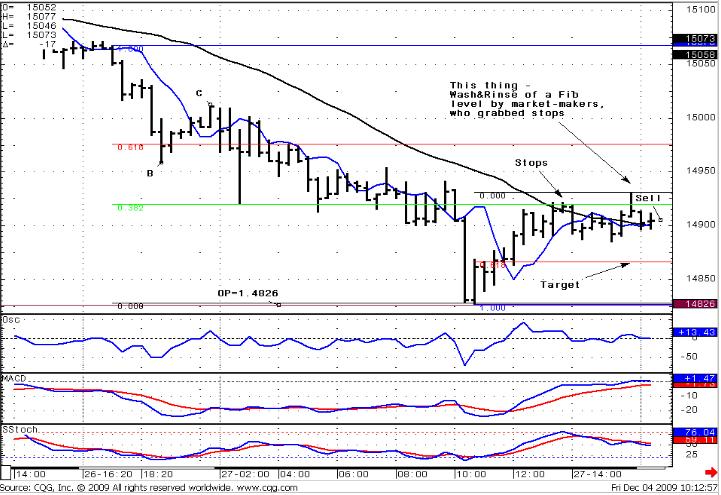
5-min chart
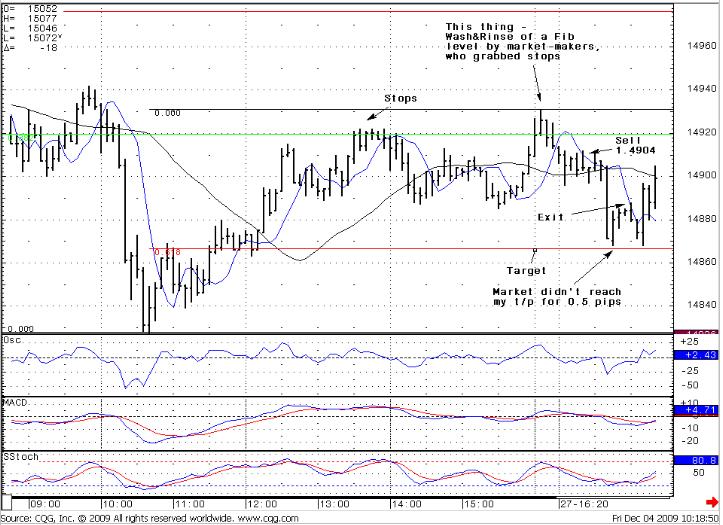
So, the market has reached a predetermined target level at 0.618 support. Unfortunately, it didn’t reach my t/p for 0.5 pips, and it was very fast trade, so I had to exit manually. But then I saw another and even more interesting possibility to trade - Double Repo.
2. Double Repo trade.
DR uses the same thrust for context, but demands double cross of 3x3 SMA. Also it shouldn’t have too much and deep consolidation between tops (or bottoms). So, when I’ve saw appreciation of my target level by the price, when it reached it for the second time and couldn’t break through, I’ve entered for a long position. Strictly, you need to wait for confirmation first – second close above 3x3 SMA to open a position, but I was near the computer and can watch and control the situation. If I will not receive this close – I close the position. So, how does it look like:
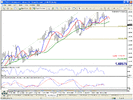
1-hour chart
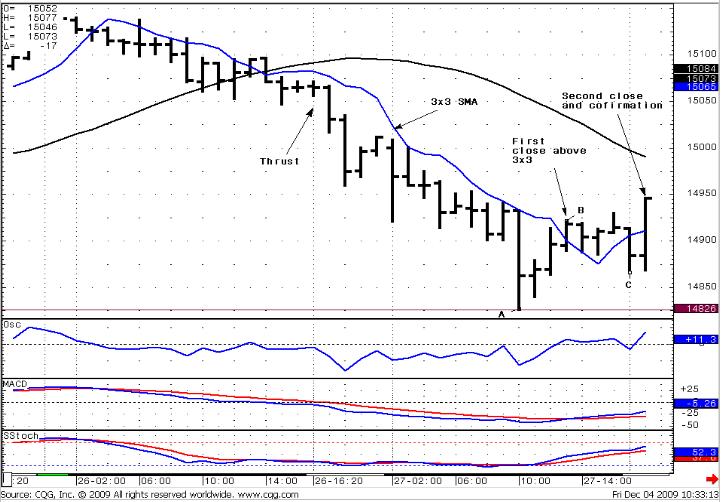
Besides, I’ve entered before confirmation, because saw a solid thrust from the level on 5-min chart:
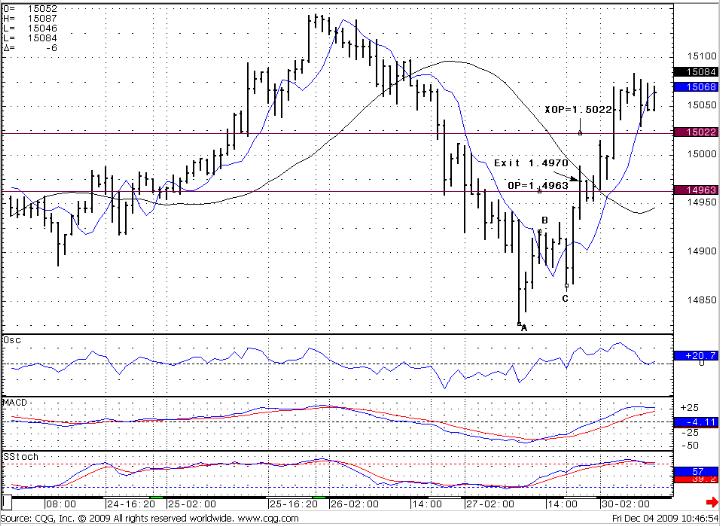
Then, I’ve calculated LPO’s and had chosen my target just above an OP (1.4963) at 1.4970. Although I could have chosen an XOP (It also was reached as you can see below), because the daily trends were up and confirmed the direction of the trade, my target was OP – because I had to leave this position overnight and I was sure that it will touch OP. About XOP I was not have confidence enough. Besides, remember that this trade was just after the news about Dubai came out.
So, the last chart:
1-hour chart