Sive Morten
Special Consultant to the FPA
- Messages
- 18,706
Fundamentals
(Reuters) The U.S. dollar gained on Friday, erasing earlier losses, as investors viewed the Federal Reserve as still likely to raise interest rates in the coming months, despite disappointing jobs growth in August.
Nonfarm payrolls rose by 151,000 jobs last month, the Labor Department said on Friday, below the 180,000 jobs that economists had expected.
"The jobs data is not weak enough to get people to give up on their Fed view," said Marc Chandler, global head of currency strategy at Brown Brothers Harriman in New York.
Hawkish statements from Fed Chair Janet Yellen and Vice Chair Stanley Fischer last week increased expectations before the jobs data that the U.S. central bank is closer to raising rates.
Some economists and investors believe a rate hike could happen when the Fed meets later this month, though most see the December meeting as the most likely time for a hike this year.
Goldman Sachs economists on Friday revised their expectations of a September rate hike upward to 55 percent, saying employment growth was above the pace Fed officials typically consider sufficient to hold the unemployment rate steady over time.
Traders see a 24 percent chance of a September hike, unchanged on the day, and a 57 percent chance of an increase by December, according to the CME Group's FedWatch tool.
Richmond Federal Reserve Bank President Jeffrey Lacker said on Friday that the U.S. economy appears strong enough to warrant significantly higher interest rates.
The dollar index .DXY, which measures the greenback against a basket of six major currencies, rose 0.21 percent to 95.667, after earlier falling to 95.189, the lowest level since last Friday.
The greenback also jumped 0.71 percent to 104.27 yen , after earlier rising to 104.31 yen, the highest since July 29.
The European Central Bank meeting next week and Bank of Japan meeting later in the month will also be watched for signs of further easing as they struggle to revive inflation and growth in the regions.
“The risk for this month is that the BOJ will underdeliver… and the yen will strengthen in response,” said Daragh Maher, head of FX strategy, U.S., at HSBC in New York. “But for now the mood does seem to be to buy dollar/yen on dips.”
Ignore the retail sales data – a contraction in UK output in Q3 is highly likely
by Fathom Consulting
Last week’s retail sales data tell us next to nothing about the health of the UK economy after the Brexit vote. We have put together our own indicator of underlying economic activity based purely on economic survey data. This (known as Fathom’s UK Economic Sentiment Indicator) fell sharply in July, to -0.4%. That was the lowest reading since early 2009. We will get a better picture of actual GDP growth in Q3 as we move through the quarter. Nevertheless, at this stage a contraction in output appears highly likely.

Last week’s UK retail sales data were much stronger than expected. Total sales volumes rose by 1.4% in July – above even the highest estimate submitted to Thomson Reuters in their regular survey of economists. What does this tell us about underlying activity in the UK economy in the wake of the EU referendum? Probably next to nothing. Monthly retail sales data are notoriously erratic, and in the short term, depend more on the vagaries of the weather than on economic fundamentals.

Retail sales and claimant count unemployment aside, we presently have very little in the way of hard economic data that relate to a period of time entirely after the Brexit vote. What we do have is a wide range of surveys. Some were moderately upbeat, and some were very weak. How should we weight all of these sometimes contradictory surveys together? Principal component analysis (PCA) offers one approach. Effectively, it is a method of distilling a wide range of economic data into just a few summary statistics.
UK Economic Sentiment Indicator
We apply PCA to the responses to a total of eleven questions from three closely-watched economic surveys. We consider five questions from the Bank of England Agents’ survey, four from the Markit PMIs, and two from the GfK consumer confidence survey. All of these surveys extend to July 2016. We find that the first principal component by itself is able to account for close to 60% of the variation in the underlying data. Moreover, each of the survey responses contributes positively to the first principal component. Because a more positive balance is seen as indicative of stronger economic activity in each case, this is a desirable property.

We have transformed the first principal component so that it has the same mean, and the same variance, as quarterly GDP growth. The resulting monthly series, which we label the Fathom UK Economic Sentiment Indicator (UKESI), is shown alongside quarterly GDP growth in the first chart. The UKESI fell by 0.6 percentage points between June and July, from 0.2% to -0.4%. That was the biggest one-month drop in the near 20-year history of our indicator, while the July reading by itself was the weakest since early 2009.
How should we interpret the July reading? The UKESI is more persistent than GDP growth. By construction, it has the same mean and variance, but it displays less short-term volatility. In that sense, we might interpret it as a measure of underlying economic activity, rather than the best possible prediction of actual GDP growth. Actual GDP growth is likely to be more volatile in any given quarter than our survey-based UKESI simply because the ONS will be able to identify ‘lumpy’ economic transactions that, because of their design, the surveys cannot hope to capture. Over time, as we receive more official statistics – such as the Index of Production, Output in the Construction Industry, and the Index of Services – we hope to build a more reliable estimate of actual GDP growth in Q3. Nevertheless, for the time being we conclude that survey readings for July, if sustained, appear consistent with a contraction in output of around 0.4% in the third quarter.


Looking further ahead, we continue to believe that the UK, although flirting with technical recession through the second half of this year, will avoid a severe downturn. A reduction in the level of output in Q3 is very likely, not least because Q2 appeared erratically strong. But we expect to see a gradual recovery in economic activity, and in the survey balances, as we move towards the year end.
COT Data
Investors still keep extreme shorts on GBP. Speculative net short postiion stands at all time low and take a look - they do not hurry to close it. Yes, minor reducing of shorts exists as open interest, but mostly market keeps shorts. In current situation it could be treated only as action down "to be continued..." in medium term perspectives.

Technicals
Monthly
So guys, our long-term forecast, that we've created in 2011 in our Military Forex Course, based on Elliot Waves has been completed:
Long Term Forecast on GBP rate
Right now monthly trend is bearish, but market is not at oversold on monthly chart. We've said that lows will not survive because market has all-time 0.618 AB=CD target below them, so that has happened. Market has dropped and right now stands there, no W&R.
Overall picture looks bearish by some signs. First is - acceleration down to AB-CD target. Usually fast drop on this point tells that market has chances to continue to AB=CD target, which stands at 1.06 area. Currently it seems too brave suggestion, but at least some minor continuation down is very probable.
The point is if you will take a look at all-time GBP chart, you'll see that market already has broken major 5/8 Fib support and on a way down, drop is really fast since first leg was on 2008 crisis. Overall fundamental situation is mostly supportive to this scenario, besides, 20 points is not really big distance to GBP that is more volatile than many other major currencies:
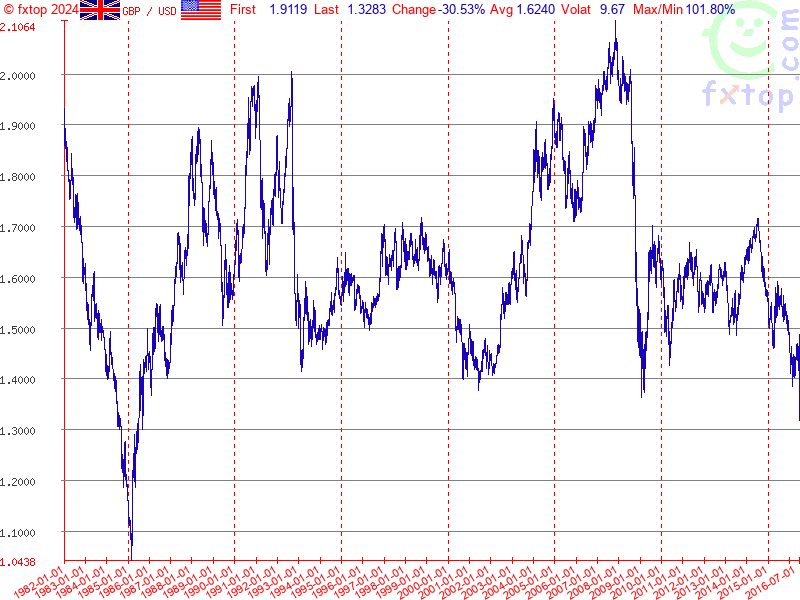
That's why technically there is nothing impossible with 1.06 area. - that will be AB=CD on a way down.
Second stands for shorter-term perspective. GBP has dropped below YPS1 and this indicates starting of new bearish trend, not just a retracement down, but trend.
Swings right now are so large, that monthly chart let's us talk on very long-term perspective and does not bring any clarity on shorter-term perspective.
As it is suggested by COT, we still should be ready for upside bounce, as bearish positions are overloaded. In general, we have being waiting for it quite some time already, because this upside bounce should become final step in our daily trading plan.
So, as no bounce has happened yet, in short-term perspective market could try to reach another AB-CD 0.618 traget. Initially we were focused on AB-CD pattern with 1.3080 target since it was more probable. As GBP has hit it already but shows no reaction, it could mean that A'B-CD target around 1.2450 area also could be hit, if we adjust our initial "A" point and shift it to "A' " as it is shown on the chart.
Last two months GBP stands rather tight. August month has become even inside one to July. September is just has started but may be in this months upside retracement will happen. At least some signs have appreared on intraday charts.

Weekly
Weekly chart shows very interesting information, and explains why our monthly AB-CD works. Actually guys, here we have rare pattern that calls Volatility Breakout (VOB). Those of you who follows our gold analysis knows that we've traded VOB on gold within 2 years and it has reached it's target around 1000$. Now GBP stands near its target as well:

Weekly chart was strongly oversold and major question is - do we have another VOB on Brexit? Usually VOB is absolute breakout as it was in 2008. Current breakout is smaller. But I think that we could treat it as VOB because more than 250 bars (weeks) has passed since first breakout. Although current VOB could be a bit weaker, but still it could have a downward continuation. It means that market could drop even lower than our monthly 1.3080 target, that is in general agrees with fundamental trend in UK economy. To understand how much lower - we need to get upside retracement first after VOB, to get AB-CD and calculate 0.618 extension target. In fact, upside action from 2008 till 2016 precisely was this "retracement" after VOB... As soon as we've got it - we've estimated 1.3080 target that currently is completed... Overall bearish Brexit impulse is also strong and sooner or later but it will get continuation, supported by BoE and MPC fiscal policy. Thus, technical VOB pattern is not isolated but supported by fundamental issues as well.
It is possible that current VOB target will coincide with butterfly one. Hardly current VOB will become strategical pattern. Mostly it is technical and based on market mechanics, rest of the impulse that still exists from Brexit drop. That's why its target should not be too extended down.
Also take a look that here we have two minor AB-CD's. One of them you can see here, while another one I will show on daily chart. May be this patterns will become a foundation for downside target estimation.
Speaking on upside retracement, weekly chart shows an area around former lows, that could be re-tested. This area starts around 1.3530 and stands for 1.3830-1.39. It's rather wide, but this is weekly chart. Probably action on daily and intraday charts will help us to estimate with more precision after some time.
Daily
Recent action on GBP is rather choppy, but it seems that market is consolidating around current lows and indeed is preparing for possible upside bounce. Reaction on NFP data was mild and has not changed overall setup. Action is very unstable and everything could change, of course, but right now, at least theoretically market could reach minimum upside target.
Actually we are not interested in other targets, because they stand above overbought area. And nearest target coincide with unfilled gap and first 3/8 Fib resistance.
Here guys, slowly formed, but we've got "222" Buy" pattern. Trend has turned bullish here, as well as weekly one. Upside action is not impressive, but may be market will be able to reach at least 1.3550 target of AB=CD pattern.
Also I've checked 25x5 DMA, that we use rather rare, but it could be used for undertsanding of sentiment of the market. Thus, on daily chart Cable has moved above 25x5 DMA, and already has re-tested it.

So, we'll see. Action is not really strong. We need this retracement up for taking potential short position, but as price behavior is very fragile, it's no assurance that we will get upside continuation. Brexit probably was so strong shock that market even after 2 months looks like lost itself...
4-hour
Here we have some other bullish signs, although they also not too strong. First of all, price has broken triangle consolidation up and was able to hold here after NFP release. September MPP was tested and GBP stands above it, approaches to MPR1.
Also here we could recognize possible butterfly "Sell" pattern that has the same target as daily "222" Buy. 1.618 extension will let GBP to close the Gab on daily chart. This probably will be upside limit for coming week.

Hourly
On hourly chart market has reached minor AB-CD target, and probably some retracement could happen before upside action will continue. There are two levels mostly stuitable for that. First one that coincides with WPP and K-support around 1.3165 area. Last one also coincides with upper border of triangle. That's why it will be particularly important. If GBP will return back inside of it, then it will bearish sign and upside continuation will get illusive hope.

Conclusion:
Currently we do not want to look too far in the future. Yes, market shows strong bearish action, especially on very long-term charts, drops down indeed look miserable, and from that standpoint GBP could reach even 1.06 target, but right now we're mostly interested in tactical weekly/daily setup of VOB pattern.
As market has started to show careful bullish signs, we return back to analysis of GBP and take a look at upside action. It seems that reality of Brexit was very strong impact and market has lost itself and currently can't get relief from this shock. Action now seems chaotic a bit and without any sense. Patterns that have been formed, although look bullish, but looks not very fascinating. That's being said, let's see whether GBP will be able to complete at least minor upside target around 1.3550.
In fact we need setup for short entry and we have no intention to trade GBP on a long side. That's why currently we could just monitor how upside action will develop.
The technical portion of Sive's analysis owes a great deal to Joe DiNapoli's methods, and uses a number of Joe's proprietary indicators. Please note that Sive's analysis is his own view of the market and is not endorsed by Joe DiNapoli or any related companies.
(Reuters) The U.S. dollar gained on Friday, erasing earlier losses, as investors viewed the Federal Reserve as still likely to raise interest rates in the coming months, despite disappointing jobs growth in August.
Nonfarm payrolls rose by 151,000 jobs last month, the Labor Department said on Friday, below the 180,000 jobs that economists had expected.
"The jobs data is not weak enough to get people to give up on their Fed view," said Marc Chandler, global head of currency strategy at Brown Brothers Harriman in New York.
Hawkish statements from Fed Chair Janet Yellen and Vice Chair Stanley Fischer last week increased expectations before the jobs data that the U.S. central bank is closer to raising rates.
Some economists and investors believe a rate hike could happen when the Fed meets later this month, though most see the December meeting as the most likely time for a hike this year.
Goldman Sachs economists on Friday revised their expectations of a September rate hike upward to 55 percent, saying employment growth was above the pace Fed officials typically consider sufficient to hold the unemployment rate steady over time.
Traders see a 24 percent chance of a September hike, unchanged on the day, and a 57 percent chance of an increase by December, according to the CME Group's FedWatch tool.
Richmond Federal Reserve Bank President Jeffrey Lacker said on Friday that the U.S. economy appears strong enough to warrant significantly higher interest rates.
The dollar index .DXY, which measures the greenback against a basket of six major currencies, rose 0.21 percent to 95.667, after earlier falling to 95.189, the lowest level since last Friday.
The greenback also jumped 0.71 percent to 104.27 yen , after earlier rising to 104.31 yen, the highest since July 29.
The European Central Bank meeting next week and Bank of Japan meeting later in the month will also be watched for signs of further easing as they struggle to revive inflation and growth in the regions.
“The risk for this month is that the BOJ will underdeliver… and the yen will strengthen in response,” said Daragh Maher, head of FX strategy, U.S., at HSBC in New York. “But for now the mood does seem to be to buy dollar/yen on dips.”
Ignore the retail sales data – a contraction in UK output in Q3 is highly likely
by Fathom Consulting
Last week’s retail sales data tell us next to nothing about the health of the UK economy after the Brexit vote. We have put together our own indicator of underlying economic activity based purely on economic survey data. This (known as Fathom’s UK Economic Sentiment Indicator) fell sharply in July, to -0.4%. That was the lowest reading since early 2009. We will get a better picture of actual GDP growth in Q3 as we move through the quarter. Nevertheless, at this stage a contraction in output appears highly likely.
Last week’s UK retail sales data were much stronger than expected. Total sales volumes rose by 1.4% in July – above even the highest estimate submitted to Thomson Reuters in their regular survey of economists. What does this tell us about underlying activity in the UK economy in the wake of the EU referendum? Probably next to nothing. Monthly retail sales data are notoriously erratic, and in the short term, depend more on the vagaries of the weather than on economic fundamentals.
Retail sales and claimant count unemployment aside, we presently have very little in the way of hard economic data that relate to a period of time entirely after the Brexit vote. What we do have is a wide range of surveys. Some were moderately upbeat, and some were very weak. How should we weight all of these sometimes contradictory surveys together? Principal component analysis (PCA) offers one approach. Effectively, it is a method of distilling a wide range of economic data into just a few summary statistics.
UK Economic Sentiment Indicator
We apply PCA to the responses to a total of eleven questions from three closely-watched economic surveys. We consider five questions from the Bank of England Agents’ survey, four from the Markit PMIs, and two from the GfK consumer confidence survey. All of these surveys extend to July 2016. We find that the first principal component by itself is able to account for close to 60% of the variation in the underlying data. Moreover, each of the survey responses contributes positively to the first principal component. Because a more positive balance is seen as indicative of stronger economic activity in each case, this is a desirable property.
We have transformed the first principal component so that it has the same mean, and the same variance, as quarterly GDP growth. The resulting monthly series, which we label the Fathom UK Economic Sentiment Indicator (UKESI), is shown alongside quarterly GDP growth in the first chart. The UKESI fell by 0.6 percentage points between June and July, from 0.2% to -0.4%. That was the biggest one-month drop in the near 20-year history of our indicator, while the July reading by itself was the weakest since early 2009.
How should we interpret the July reading? The UKESI is more persistent than GDP growth. By construction, it has the same mean and variance, but it displays less short-term volatility. In that sense, we might interpret it as a measure of underlying economic activity, rather than the best possible prediction of actual GDP growth. Actual GDP growth is likely to be more volatile in any given quarter than our survey-based UKESI simply because the ONS will be able to identify ‘lumpy’ economic transactions that, because of their design, the surveys cannot hope to capture. Over time, as we receive more official statistics – such as the Index of Production, Output in the Construction Industry, and the Index of Services – we hope to build a more reliable estimate of actual GDP growth in Q3. Nevertheless, for the time being we conclude that survey readings for July, if sustained, appear consistent with a contraction in output of around 0.4% in the third quarter.
Looking further ahead, we continue to believe that the UK, although flirting with technical recession through the second half of this year, will avoid a severe downturn. A reduction in the level of output in Q3 is very likely, not least because Q2 appeared erratically strong. But we expect to see a gradual recovery in economic activity, and in the survey balances, as we move towards the year end.
COT Data
Investors still keep extreme shorts on GBP. Speculative net short postiion stands at all time low and take a look - they do not hurry to close it. Yes, minor reducing of shorts exists as open interest, but mostly market keeps shorts. In current situation it could be treated only as action down "to be continued..." in medium term perspectives.
Technicals
Monthly
So guys, our long-term forecast, that we've created in 2011 in our Military Forex Course, based on Elliot Waves has been completed:
Long Term Forecast on GBP rate
Right now monthly trend is bearish, but market is not at oversold on monthly chart. We've said that lows will not survive because market has all-time 0.618 AB=CD target below them, so that has happened. Market has dropped and right now stands there, no W&R.
Overall picture looks bearish by some signs. First is - acceleration down to AB-CD target. Usually fast drop on this point tells that market has chances to continue to AB=CD target, which stands at 1.06 area. Currently it seems too brave suggestion, but at least some minor continuation down is very probable.
The point is if you will take a look at all-time GBP chart, you'll see that market already has broken major 5/8 Fib support and on a way down, drop is really fast since first leg was on 2008 crisis. Overall fundamental situation is mostly supportive to this scenario, besides, 20 points is not really big distance to GBP that is more volatile than many other major currencies:
That's why technically there is nothing impossible with 1.06 area. - that will be AB=CD on a way down.
Second stands for shorter-term perspective. GBP has dropped below YPS1 and this indicates starting of new bearish trend, not just a retracement down, but trend.
Swings right now are so large, that monthly chart let's us talk on very long-term perspective and does not bring any clarity on shorter-term perspective.
As it is suggested by COT, we still should be ready for upside bounce, as bearish positions are overloaded. In general, we have being waiting for it quite some time already, because this upside bounce should become final step in our daily trading plan.
So, as no bounce has happened yet, in short-term perspective market could try to reach another AB-CD 0.618 traget. Initially we were focused on AB-CD pattern with 1.3080 target since it was more probable. As GBP has hit it already but shows no reaction, it could mean that A'B-CD target around 1.2450 area also could be hit, if we adjust our initial "A" point and shift it to "A' " as it is shown on the chart.
Last two months GBP stands rather tight. August month has become even inside one to July. September is just has started but may be in this months upside retracement will happen. At least some signs have appreared on intraday charts.
Weekly
Weekly chart shows very interesting information, and explains why our monthly AB-CD works. Actually guys, here we have rare pattern that calls Volatility Breakout (VOB). Those of you who follows our gold analysis knows that we've traded VOB on gold within 2 years and it has reached it's target around 1000$. Now GBP stands near its target as well:
Weekly chart was strongly oversold and major question is - do we have another VOB on Brexit? Usually VOB is absolute breakout as it was in 2008. Current breakout is smaller. But I think that we could treat it as VOB because more than 250 bars (weeks) has passed since first breakout. Although current VOB could be a bit weaker, but still it could have a downward continuation. It means that market could drop even lower than our monthly 1.3080 target, that is in general agrees with fundamental trend in UK economy. To understand how much lower - we need to get upside retracement first after VOB, to get AB-CD and calculate 0.618 extension target. In fact, upside action from 2008 till 2016 precisely was this "retracement" after VOB... As soon as we've got it - we've estimated 1.3080 target that currently is completed... Overall bearish Brexit impulse is also strong and sooner or later but it will get continuation, supported by BoE and MPC fiscal policy. Thus, technical VOB pattern is not isolated but supported by fundamental issues as well.
It is possible that current VOB target will coincide with butterfly one. Hardly current VOB will become strategical pattern. Mostly it is technical and based on market mechanics, rest of the impulse that still exists from Brexit drop. That's why its target should not be too extended down.
Also take a look that here we have two minor AB-CD's. One of them you can see here, while another one I will show on daily chart. May be this patterns will become a foundation for downside target estimation.
Speaking on upside retracement, weekly chart shows an area around former lows, that could be re-tested. This area starts around 1.3530 and stands for 1.3830-1.39. It's rather wide, but this is weekly chart. Probably action on daily and intraday charts will help us to estimate with more precision after some time.
Daily
Recent action on GBP is rather choppy, but it seems that market is consolidating around current lows and indeed is preparing for possible upside bounce. Reaction on NFP data was mild and has not changed overall setup. Action is very unstable and everything could change, of course, but right now, at least theoretically market could reach minimum upside target.
Actually we are not interested in other targets, because they stand above overbought area. And nearest target coincide with unfilled gap and first 3/8 Fib resistance.
Here guys, slowly formed, but we've got "222" Buy" pattern. Trend has turned bullish here, as well as weekly one. Upside action is not impressive, but may be market will be able to reach at least 1.3550 target of AB=CD pattern.
Also I've checked 25x5 DMA, that we use rather rare, but it could be used for undertsanding of sentiment of the market. Thus, on daily chart Cable has moved above 25x5 DMA, and already has re-tested it.
So, we'll see. Action is not really strong. We need this retracement up for taking potential short position, but as price behavior is very fragile, it's no assurance that we will get upside continuation. Brexit probably was so strong shock that market even after 2 months looks like lost itself...
4-hour
Here we have some other bullish signs, although they also not too strong. First of all, price has broken triangle consolidation up and was able to hold here after NFP release. September MPP was tested and GBP stands above it, approaches to MPR1.
Also here we could recognize possible butterfly "Sell" pattern that has the same target as daily "222" Buy. 1.618 extension will let GBP to close the Gab on daily chart. This probably will be upside limit for coming week.
Hourly
On hourly chart market has reached minor AB-CD target, and probably some retracement could happen before upside action will continue. There are two levels mostly stuitable for that. First one that coincides with WPP and K-support around 1.3165 area. Last one also coincides with upper border of triangle. That's why it will be particularly important. If GBP will return back inside of it, then it will bearish sign and upside continuation will get illusive hope.
Conclusion:
Currently we do not want to look too far in the future. Yes, market shows strong bearish action, especially on very long-term charts, drops down indeed look miserable, and from that standpoint GBP could reach even 1.06 target, but right now we're mostly interested in tactical weekly/daily setup of VOB pattern.
As market has started to show careful bullish signs, we return back to analysis of GBP and take a look at upside action. It seems that reality of Brexit was very strong impact and market has lost itself and currently can't get relief from this shock. Action now seems chaotic a bit and without any sense. Patterns that have been formed, although look bullish, but looks not very fascinating. That's being said, let's see whether GBP will be able to complete at least minor upside target around 1.3550.
In fact we need setup for short entry and we have no intention to trade GBP on a long side. That's why currently we could just monitor how upside action will develop.
The technical portion of Sive's analysis owes a great deal to Joe DiNapoli's methods, and uses a number of Joe's proprietary indicators. Please note that Sive's analysis is his own view of the market and is not endorsed by Joe DiNapoli or any related companies.